America’s high-tech sector has been a key driver of economic growth in recent years – and this will likely continue. STEM fields – those in the areas of science, technology, engineering, and mathematics – are critical for the U.S. to remain competitive globally. According to the Bureau of Labor Statistics, which refers to STEM careers as “tomorrow’s jobs,” employment in STEM occupations is projected to grow by 10.5% between 2020 and 2030, compared to 7.5% growth in non-STEM jobs.
Workers in high-tech industries also tend to be better compensated than those working in other sectors. The typical worker in a STEM occupation earned $95,420 in 2021, more than double the median wage of $40,120 in non-STEM jobs.
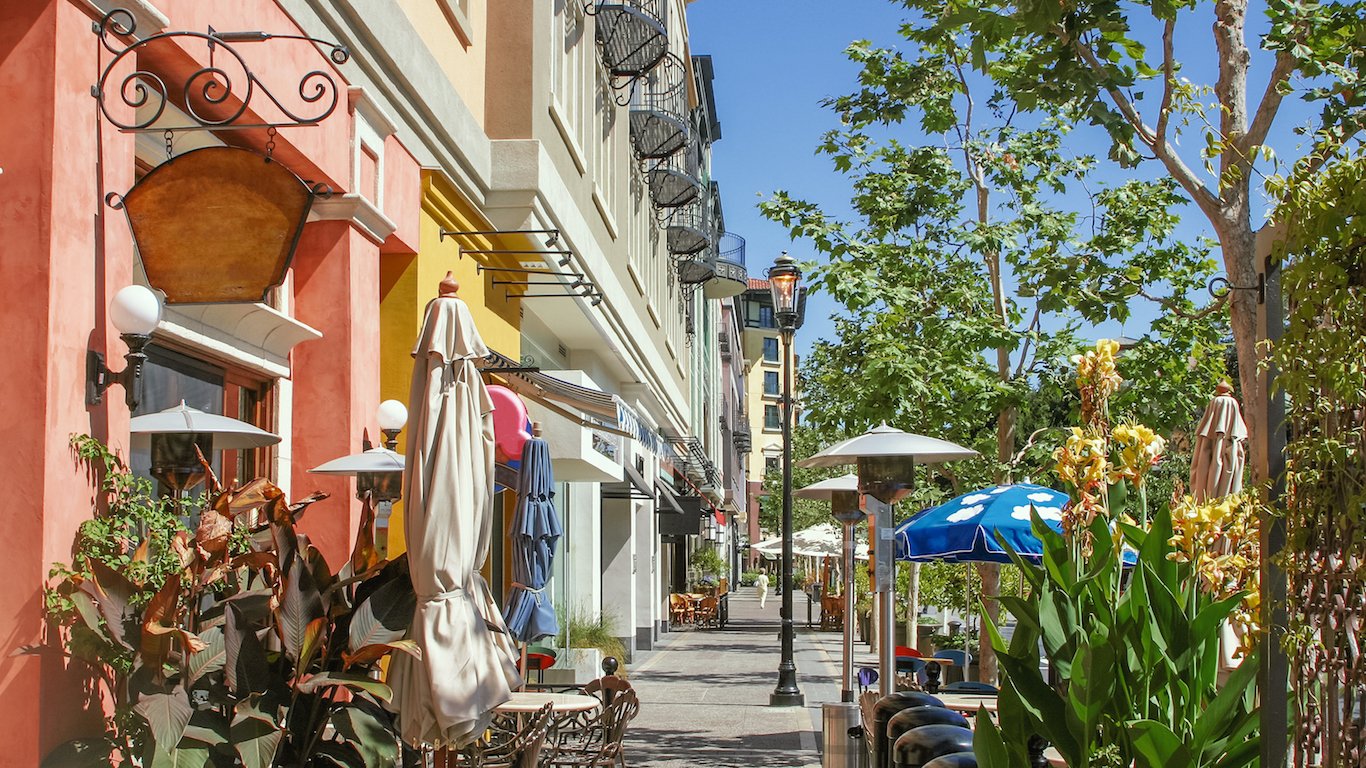
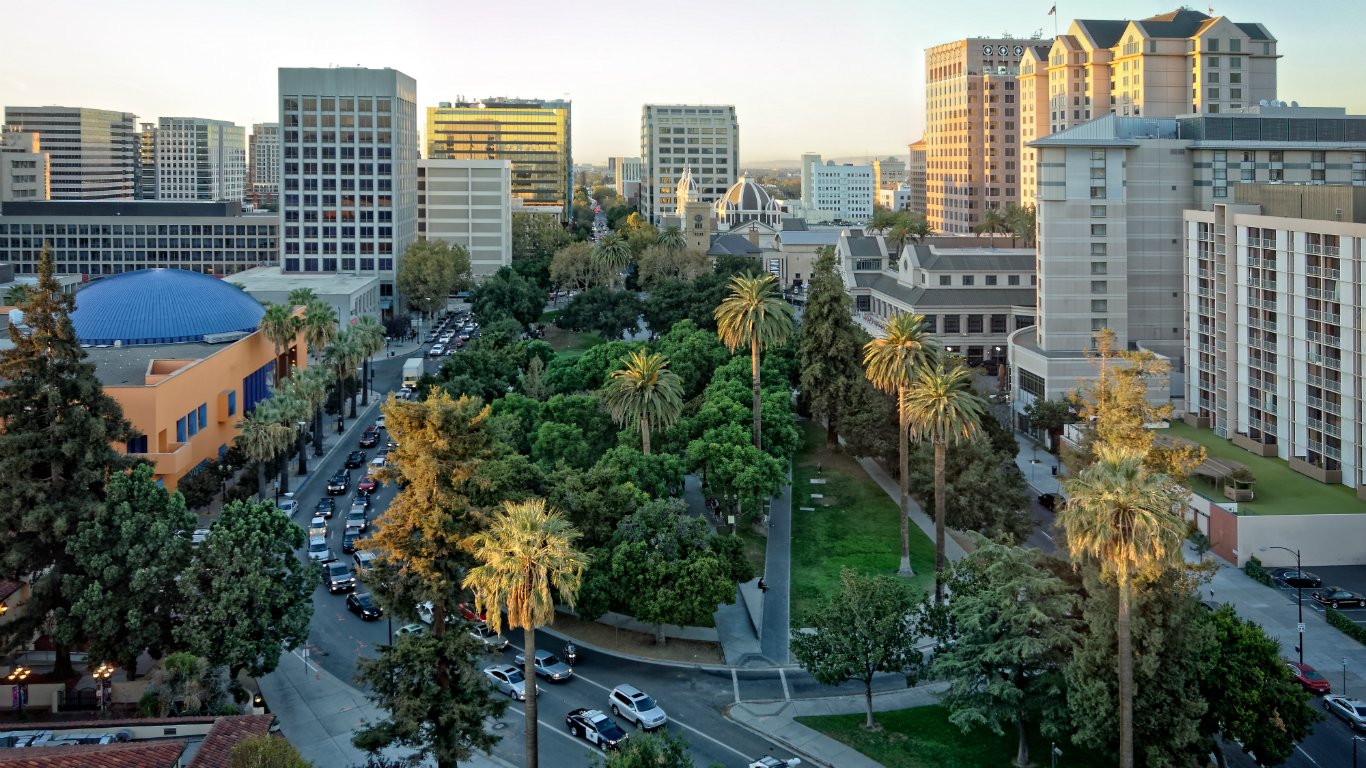
While demand for STEM workers is growing nationwide, high-tech jobs tend to be concentrated in some major cities. In the San Jose-Sunnyvale-Santa Clara metro area, located in California, jobs in high-tech industries account for 22.8% of overall employment compared to 9.5% of all employment nationwide. The most concentrated high-tech occupation in the metro area, relative to the U.S. as a whole, is computer and peripheral equipment manufacturing.
Jobs in STEM fields are generally well-paying, and those in the San Jose area are no exception. The average annual pay among occupations in STEM fields in the area stands at $416,830, about 2.6 times higher than the average pay across all occupations in the metro area.
All data used in this story is from the Bureau of Labor Statistics Quarterly Census of Employment and Wages. Metro areas were ranked based on employment in industries defined as “high-tech” by the BLS as a percentage of total employment. The BLS defines high-tech industries as those with a concentration of STEM occupations at least 2.5 times greater than their average concentration nationwide in goods-producing and service-providing industries.
| Rank | Metro area | Share of jobs in high-tech industries (%) | Adult residents with a 4-yr. degree or higher (%) | Average annual pay in STEM fields ($) |
|---|---|---|---|---|
| 1 | Boulder, CO | 25.0 | 63.0 | 146,158 |
| 2 | San Jose-Sunnyvale-Santa Clara, CA | 22.8 | 52.5 | 416,830 |
| 3 | California-Lexington Park, MD | 22.5 | 32.0 | 233,720 |
| 4 | San Francisco-Oakland-Hayward, CA | 19.7 | 50.7 | 229,896 |
| 5 | Huntsville, AL | 17.6 | 39.8 | 190,484 |
| 6 | Seattle-Tacoma-Bellevue, WA | 17.1 | 43.6 | 381,524 |
| 7 | Palm Bay-Melbourne-Titusville, FL | 16.4 | 30.9 | 106,139 |
| 8 | Boston-Cambridge-Newton, MA-NH | 14.8 | 48.9 | 177,997 |
| 9 | San Diego-Carlsbad, CA | 14.8 | 39.5 | 136,494 |
| 10 | Denver-Aurora-Lakewood, CO | 14.1 | 44.7 | 141,713 |
| 11 | Manchester-Nashua, NH | 13.3 | 38.6 | 151,926 |
| 12 | Austin-Round Rock, TX | 13.2 | 46.0 | 156,335 |
| 13 | Minneapolis-St. Paul-Bloomington, MN-WI | 12.8 | 42.7 | 131,741 |
| 14 | Trenton, NJ | 11.9 | 43.5 | 196,740 |
| 15 | Atlanta-Sandy Springs-Roswell, GA | 11.6 | 39.5 | 123,035 |
| 16 | Baltimore-Columbia-Towson, MD | 11.1 | 41.0 | 128,428 |
| 17 | Bridgeport-Stamford-Norwalk, CT | 10.9 | 48.9 | 189,069 |
| 18 | Pittsburgh, PA | 10.8 | 35.9 | 147,225 |
| 19 | Ann Arbor, MI | 10.8 | 56.7 | 142,542 |
| 20 | St. Louis, MO-IL | 10.5 | 35.4 | 124,487 |