
International trade is reported each month, but this is what the rest of us refer to as the trade deficit. After all, each month the United States imports are far more than it exports. Friday’s report showed that the trade deficit expanded in December as that strong U.S. dollar is hurting exports and allowing us to bring in cheaper goods from other countries. Monthly figures are volatile, but the real picture is what is happening year over year. Those annual figures are massive, but the reality is that they are not changing by all that much from year to year.
The trade deficit in December was -$43.4 billion on a seasonally adjusted reporting basis. Bloomberg was calling for a deficit of -$43.0 billion, and The Wall Street Journal expected a deficit reading of -$43.5 billion.
The Commerce Department revised November’s reading to -$42.2 billion from the preliminary -$42.4 billion.
Here is more proof about the strong dollar continuing to sway this number: exports were down by 0.3% and imports were up by 0.3%.
International trade was also responsible for a 0.47 point move on the downside against GDP growth in the fourth quarter.
America’s goods-trade deficit with many of its largest partners expanded last year.
[nativounit]
The real goods deficit increased $1.0 billion to $60.3 billion in December. The Commerce Department showed surplus and deficit nations as follows:
- December figures show surpluses in goods with South and Central America ($2.8 billion), the United Kingdom ($0.6 billion) and Brazil ($0.2 billion).
- Deficits were seen as follows: China ($29.7 billion), European Union ($13.3 billion), Germany ($6.4 billion), Japan ($6.3 billion), Mexico ($4.8 billion), South Korea ($2.5 billion), Italy ($2.2 billion), India ($2.0 billion), France ($1.4 billion), Canada ($1.4 billion), Saudi Arabia ($0.5 billion) and OPEC ($0.2 billion).
Where this matters in reality is in the annual numbers.
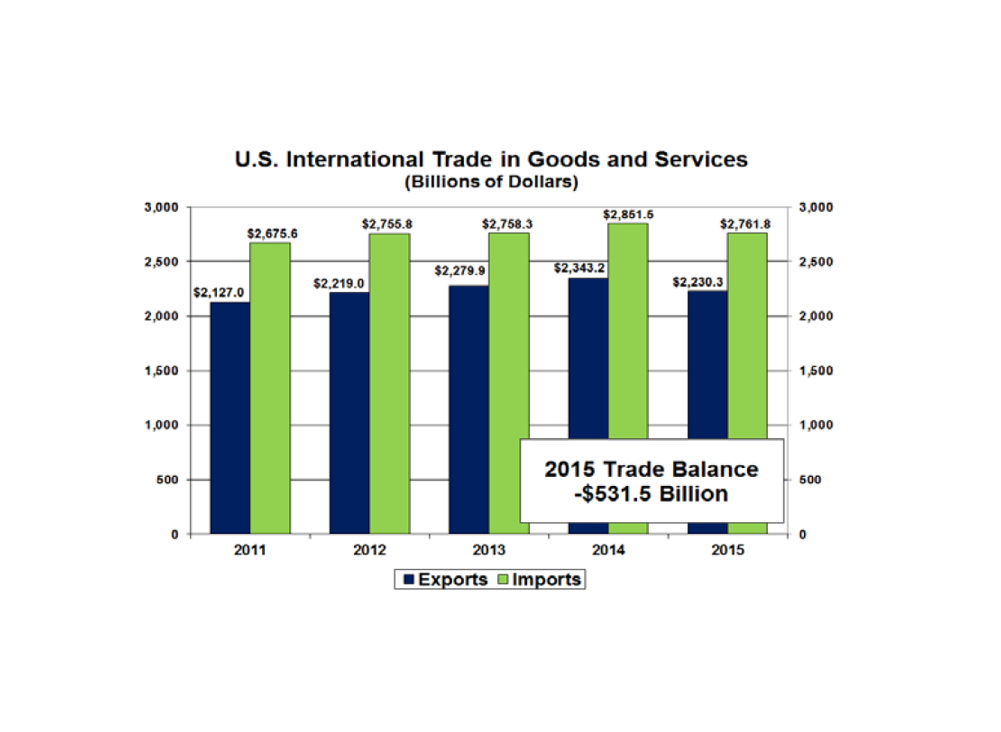
For 2015, the goods and services deficit was up $23.2 billion to $531.5 billion. Exports in 2015 were down $112.9 billion to $2.2303 trillion and imports were down $89.7 billion to $2.7618 trillion in 2015.
The full year of 2015 saw an increase in the goods and services deficit reflected a mix: an increase in the goods deficit of $17.5 billion (2.4%) to $758.9 billion and a decrease in the services surplus of $5.7 billion (2.4%) to $227.4 billion.
A chart from the Commerce Department below shows how the imports and exports are changing from year to year.
Contact [email protected] for any questions or corrections.