If you went through 2015 and the first six weeks of 2016, the weakness in the oil and gas sector was something most investors have not seen in years. Now oil is back over $30.00 and nearing $35.00, and the charts in some of the key oil and gas stocks and their exchange trafed funds (ETFs) seem to be reaching breakout levels. The oil and gas industry, and the investment community around energy, has been dealing all day with news of the death of Aubrey McClendon. It seems that something else may be happening here on the charts.
Before investors think of the term breaking-out on a chart means a return to old highs, let’s not all get too excited just yet. The oil patch likely still faces a lot of pressure ahead. Many oil companies just simply are not profitable — even after a big bounce. Many more oil and gas workers are either going to be laid off or they are going to end up with pay cuts or see other serious changes.
24/7 Wall St. wanted to focus on the key ETFs with charts breaking out. Again, these are not charts signaling that a return to highs is coming any time soon. They are just charts with breakout patterns that have a lot of room up to the next perceived resistance level.
[recirclink id=317460]
Another caveat: charts often fail to live up to what many technicians will tell you. And for a final caveat, many technicians look at different charts and many argue over which metrics (MACD, moving averages, RSI) should be considered. This look here just includes chart watches using former resistance and support levels and considers 50-day and 200-day moving averages. We also have included which oil and gas giants are the top holdings of each of these ETFs.
Energy Select Sector SPDR
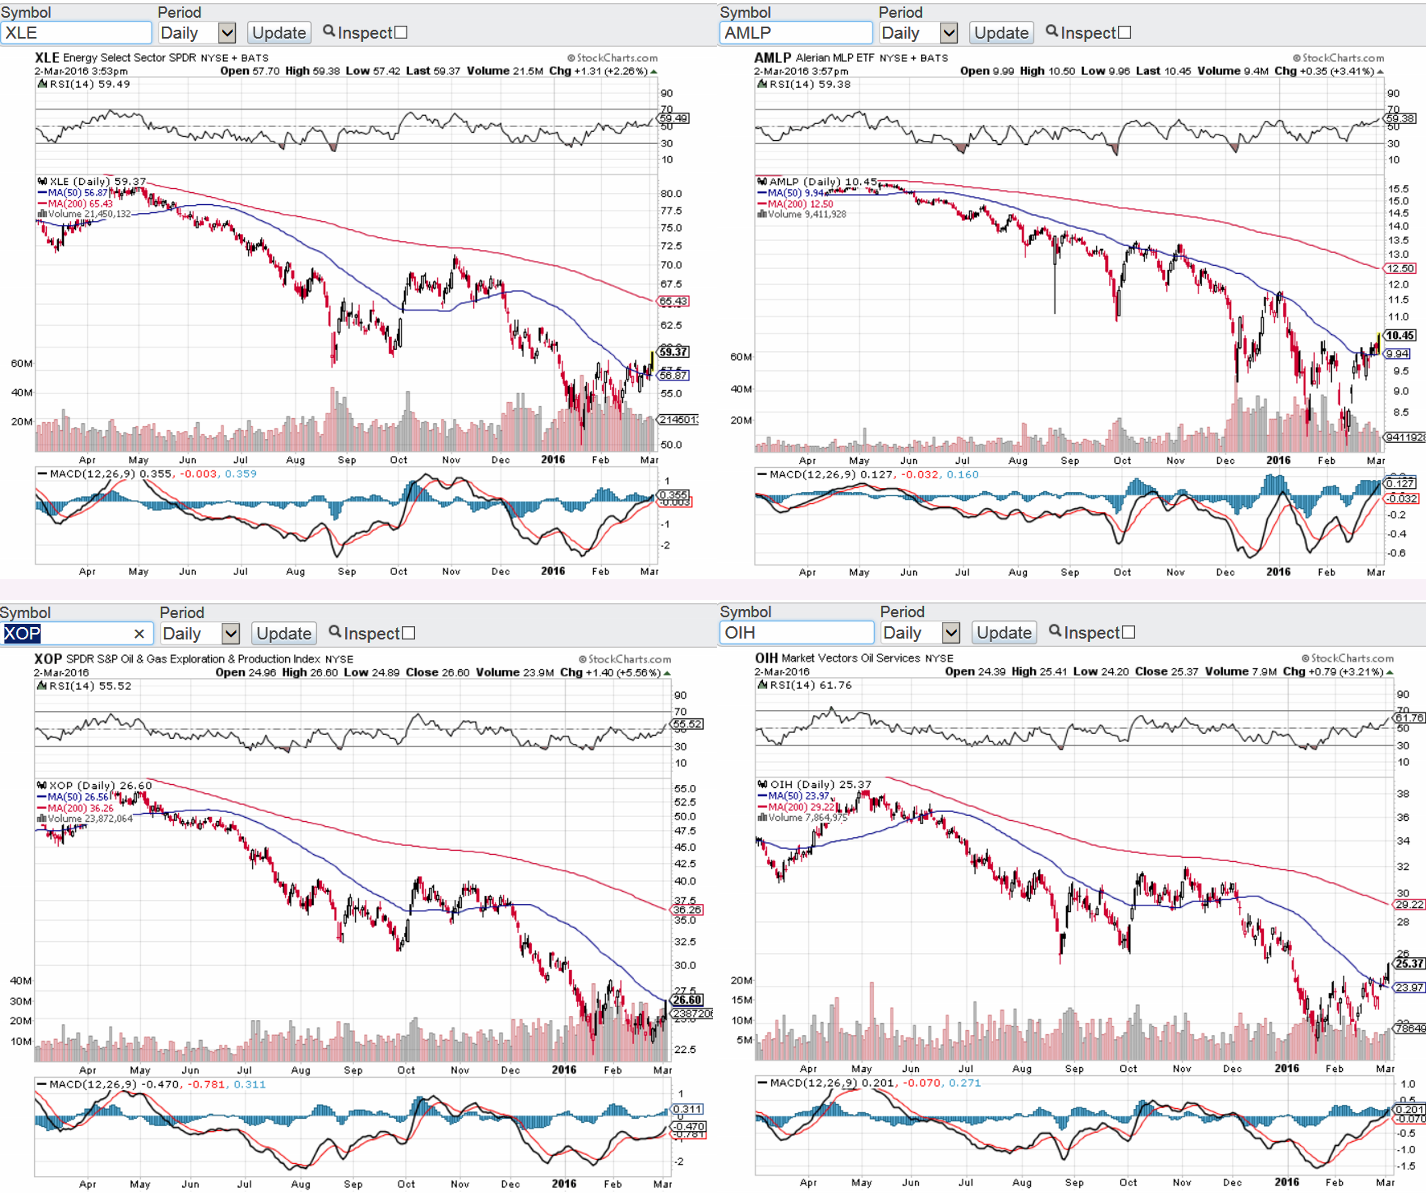
Energy Select Sector SPDR ETF (NYSEMKT: XLE) closed up 2.5% at $59.48, in a 52-week trading range of $49.93 to $83.66. It traded just over 25 million shares and has an average daily volume of almost 29 million. The Energy Select Sector SPDR has the following top holdings: Exxon Mobil, Chevron, Schlumberger, Occidental Petroleum, Pioneer Natural Resources, EOG Resources, Valero Energy, Phillips 66, Halliburton and Kinder Morgan.
The XLE has broken above its 50-day moving average, and the 200-day moving average is up at $65.43. Resistance around $59 was former support on three different occasions since last summer.
Alerian MLP
The Alerian MLP ETF (NYSEMKT: AMLP) closed up 3.5% at $10.47, versus a 52-week range of $7.77 to $17.35. This one is without leverage in ETFs and master limited partnerships (MLPs) and, unlike many closed-end funds, does not actively allocate large amounts of its assets in private securities or in MLP-like vehicles that are not really MLPs. The Alerian MLP ETF has the following as top holdings: Energy Transfer Partners, Magellan Midstream Partners, Enterprise Products Partners, Buckeye Partners, Plains All American Pipeline, MPLX, Williams Partners and ONEOK Partners.
The AMLP ETF has broken above the 50-day moving average by about 50 cents to $10.45, and the 200-day moving average is all the way up at $12.50. The next pivots for resistance could be hard at $11.00 and $11.50.
SPDR S&P Oil & Gas Exploration & Production
SPDR S&P Oil & Gas Exploration & Production ETF (NYSEMKT: XOP) closed up 5.44% at $26.57, within a 52-week range of $22.06 to $56.18. Its volume on Wednesday was 26.1 million shares, versus an average daily volume of 20.4 million. This SPDR’s top holdings in exploration and production are as follows: Cabot Oil & Gas, Antero Resources, EQT, Gulfport Energy, Range Resources, Exxon Mobil, Occidental Petroleum, Parsley Energy, Phillips 66 and Chevron.
The XOP ETF is just now challenging its 50-day moving average around $26.60, and the next resistance level might be $27.75 to $28.00 and then up around $30.00.
Market Vectors Oil Services
Market Vectors Oil Services ETF (NYSEMKT: OIH) closed up 3.3% at $25.39, in a 52-week trading range of $20.46 to $39.80. This one used to be the Oil Services HOLDRs, and volume used to be even more active. It traded 7.7 million shares and its average volume is almost 7.5 million shares. Its top equity holdings were as follows: Schlumberger, Halliburton, Baker Hughes, Cameron International, National Oilwell Varco, Helmerich & Payne, Tenaris, Core Laboratories, FMC Technologies and Weatherford International.
The OIH had its 50-day moving average at $23.97, and the next simple resistance point looks closer to $26.00, but the 200-day moving average is all the way up at $29.22.
[recirclink id=316736]
Again, support and resistance lines on charts, and ditto for prior pivot points, are certainly not assured to be exact points of support and resistance. A view of these four charts has been taken from StockCharts.com.
Contact [email protected] for any questions or corrections.