This year truly has been a wonderful bull market year for stocks, with double-digit gains taking the S&P 500 Index and the Dow Jones Industrial Average to new all-time highs. The confusion in June around Ben Bernanke and the Federal Reserve exiting or tapering off quantitative easing is moving further and further into the past. Now we have a technical analyst call that sounds almost too good to be true. Jay Lefkowicz of Concept Capital Markets in New York City is calling not just for 2,000 or even 2,500 on the S&P 500. This CFA and CMT is calling for the S&P 500 to ultimately rise to 2,584!
We had a chance to catch up with Mr. Lefkowicz on his fresh technical analysis and ask about how he came up with this prediction for the S&P 500 to ultimately rise to 2,584. It was using textbook Fibonacci technical analysis methods, and we asked him some questions about this. His fresh industry article that went into the July 2013 version of the Market Technicians Association Technically Speaking magazine has been included after the interview.
24/7 Wall St. looked at this market prediction versus the current S&P 500 Index price. With the S&P 500 around 1,675, this implies long-term stock market upside of roughly 54%. The SPDR S&P 500 (NYSEMKT: SPY) trades at close to $167.50, which would imply (but does not state) a long-term gain for the huge exchange traded fund (ETF) of up to $257.95, minus any annual ETF management fees and/or performance tracking measures. This also implies big gains for the Dow Jones Industrial Average and the Nasdaq as well, but market technicians do not always imply that the chart of one index is mirrored exactly (or at all) for other index charts.
*******
24/7: Jay, first off thank you for allowing us to present this to our readers. I must say that seeing a projection of over 2,000 on the S&P 500 Index is no small task. So when I see 2,500 or in this case 2,584 on the S&P 500 I can only wonder what sort of time period we are talking about. Is this a straight move with few pullbacks? Is it is a five-year call? Please explain.
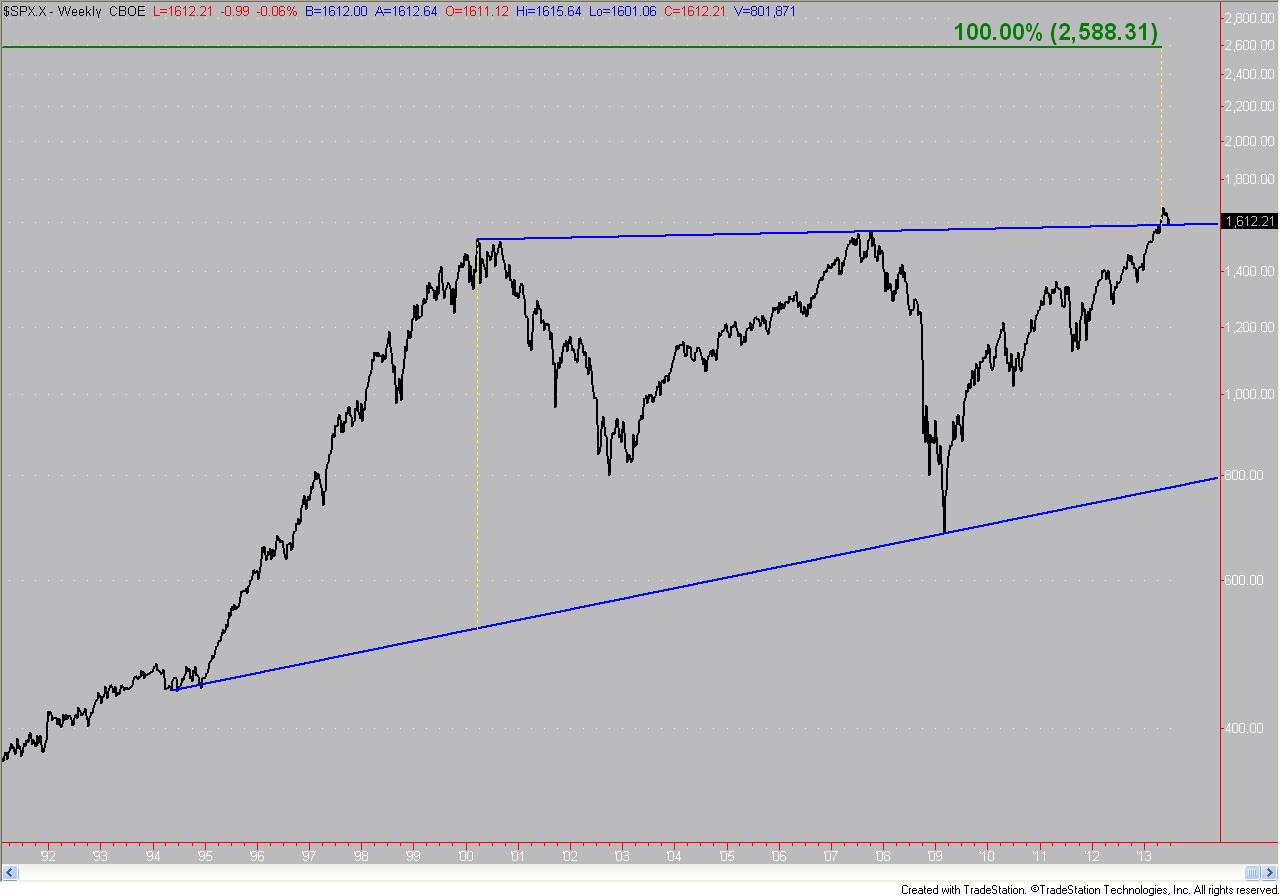
JL: The analysis was based on Weekly and Monthly charts of the S&P 500 Index. I’ve been watching an 80-year chart for the past couple of years, and after the breakout in May, I focused in on the rally that began in 1994. Connecting the tops since 2000 yields a 13-year triangle, therefore a breakout from a 13-year pattern will require years to resolve. My target date is the next Fibonacci date, August 13, 2021 (8/13/21). Over the next 8 years, one should expect some pullbacks.
24/7: While timing is of course an issue, what pitfalls would cause you to reconsider your call? What sort of technical damage would have to be done?
JL: All the work I do is based on the Reward:Risk ratio (the convention is Risk:Reward, but who says “I like this idea, it’s a 1:2 trade”?). The minimum acceptable ratio is 2:1, so with 900 points of potential upside, acceptable risk can be up to 450 points. Looking at the rally since the 2009 low, a pullback below the 38.2% Fibonacci retracement of a rally (wherever it peaks) would be a cause for concern — from this point that works out to about 1,300 (on the S&P 500).
24/7: Jay, true technicians say that the fundamentals of the market take a total backseat or are not even relevant in true technical analysis. If you are calling for a move to over 2,000 and then over 2,500 on the S&P 500, then what does this imply for other major indexes like the DJIA, Nasdaq, and even the troubled European and Chinese stock markets while their economies struggle?
JL: First, I think fundamentals drive the charts and a technician must make an unbiased judgment based on price information. There are very good fundamental analysts looking at a small number of stocks. Large institutions act on that information, which builds the charts. My job is to look at the developing picture and determine if the pattern says Buy, Sell, or do nothing. As far as other indices, I do shorter term work on the e-mini S&P 500 (ES), NASDAQ 100 (NQ) and Russell 2000 (TF) futures. The prices for the major market ETFs (SPY, QQQ, and IWM) are based on those futures. I have a 1,748 target for ES and 3,193 – 3,213 for NQ.
24/7: Is anyone else is making a huge call like this that you are in touch with, or are you a lone wolf here calling for upside this large?
JL: I participate in a technicians email group and so far only one other technician mentioned the same pattern. I’m not sure if that is good or bad. My initial thought is that a majority of technical work does not look back as far as I did.
24/7: The last thing I would like to ask is around market participation, or lack thereof. The little guy and retail investor was shaken out of the stock market during or after the recession. What would you tell an investor who missed the rally in stocks so far about there still being 50% more upside to the stock market?
JL: Look at this excellent chart from BAML on Sell Side Equity Allocation recommendations. Non-participants are not alone. As far as an individual investor, I could get into the whole equities are risky and not for everyone, past results do not guarantee future performance pabulum. I can advise them to speak to a professional advisor that can tailor an investment plan to their specific needs and goals.
The following article has been republished with permission from Concept Capital Markets
S&P 500 INDEX: TO INFINITY AND BEYOND? NO, “JUST” 2,584
by Jay Lefkowicz, CFA, CMT
On May 10th, S&P 500 Index (SPX) confirmed the breakout above a 13-year ascending triangle pattern in the weekly chart that projects to about 2588.
On May 31st, SPX confirmed the breakout above in the monthly chart that projects to about 2536.
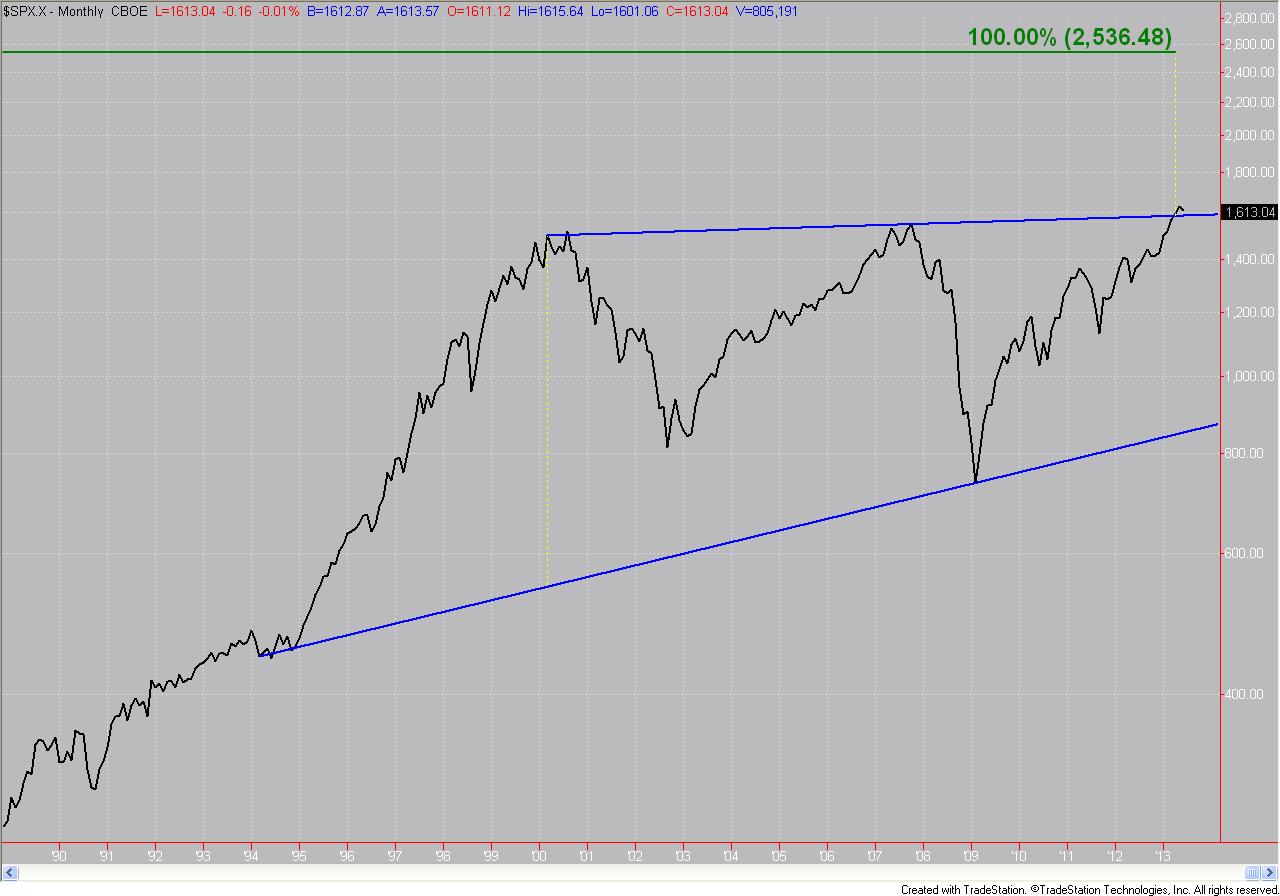
Since the monthly chart breakout validates the weekly chart breakout, our upside expectation becomes 2584 with an 8-year time horizon. That ties everything together with a nice, neat Fibonacci bow. Based on a recent close of 1631.38, a move to 2584 would be a 58% advance. Over 8 years, that works out to a 5.9% compounded annual return.
As far as a real return, such an advance may not eclipse the real (inflation adjusted) SPX high from August 2000, depending on your inflation expectations. Going back to the start of SPX (December 30, 1927), it took 29 years (August 1929 to December 1958) and 24 years (November 1968 to December 1992) to reach new real highs. Expecting SPX to approach its prior real high in 2021 is not out of line with the two previous instances.
The most recent high in the real SPX was in August 2000. The prior peaks were in November 1968 and August 1929. It took 24 and 29 years respectively to eclipse the old peaks.

Source: Bloomberg Finance LP and U.S. Department of Labor: Bureau of Labor Statistics
Fun with Fibonacci Numbers
Below are the first 18 numbers in the sequence:
- 1, 1, 2, 3, 5, 8, 13, 21, 34, 55, 89, 144, 233, 377, 610, 987, 1597, 2584
- The triangle took 13 years to develop
- The top of the triangle is 1588 this month (0.6% from 1597)
- The Weekly Chart projection is 2588 (0.2% from 2584)
- The Weekly breakout was confirmed on May 10 (2 days after Fibonacci day 5/8/13)
- The measured move from the Weekly Chart is 1000.7 (1.4% from 987)
- Expecting the move to take 8 years generates a familiar Fibonacci ratio (8/13 ≈ 61.8%)
- That makes our target date the next Fibonacci Day 8/13/21
BY JAY LEFKOWICZ, CFA, CMT
Editor’s note: This report was originally published by Concept Capital Markets, LLC, and is republished here with permission.
Contact [email protected] for any questions or corrections.