
March 12, 2020 will go down in the history books as the worst trading day since the stock market crash in October of 1987. And to say that the history books will say that assumes that there are not any worse days ahead. The Dow closed down 9.99% at 21,200.62 on Thursday, accompanied by a loss of 9.5% on the S&P 500 to 2,480.64 and a loss of 9.4% to 7,201.80 on the tech-heavy Nasdaq. That means that the bull market that had raged for 11 years until the middle of February has already turned into a raging bear market that is now down nearly 30% from its peak.
24/7 Wall St. wanted to look at the daily data for a comparison back to Black Monday on October 19, 1987. We have used the Dow as the major reference mark because back then the Dow was how even the most of the professional investors of the day referred to “the stock market.”
The Dow’s closing bell of 21,200.62 on October 12, 2020 was down a sharp 28.3% from the peak level of 29,568.57 just on February 12, 2020. The all-time peaks of the S&P 500 and NASDAQ were roughly as brutal over the last month, even if the peaks may have been on different days. The S&P 500 is now down at 2,480.64 for a peak (3,393.52) to current closing trough loss of 26.9%. The tech-heavy NASDAQ’s 750 point drop on this day to 7,201.80 is down 26.8% from the February all-time high of 9,838.37.
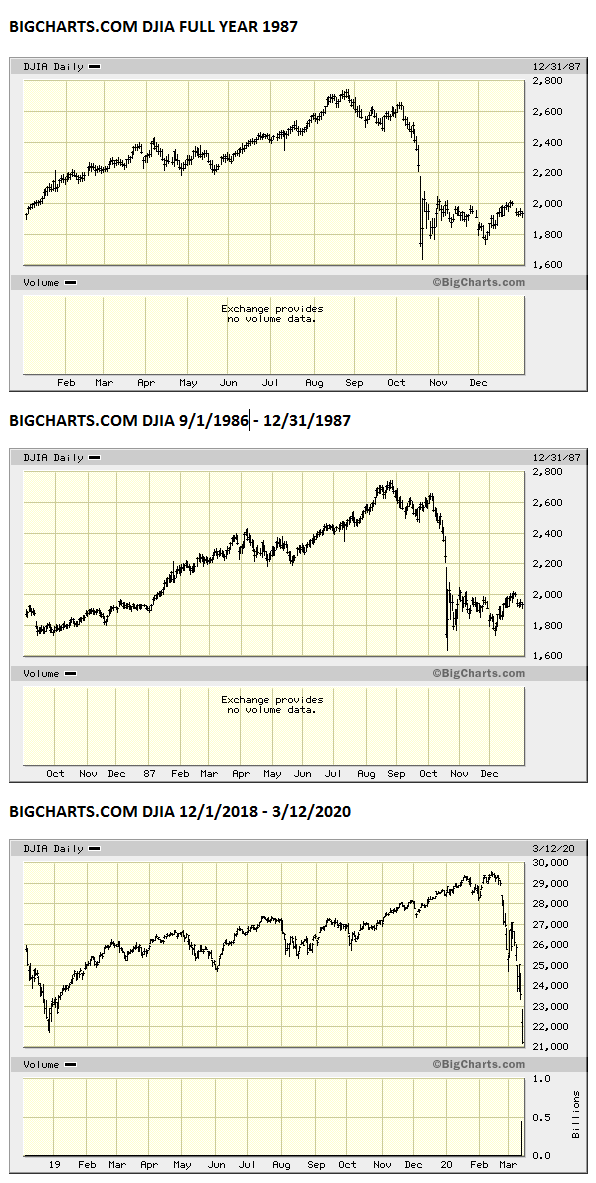
Now look back to the moves of 1987 versus today. There are some similarities in performance ahead of the 1987 crash (see charts below), but the real crash of 1987 was seen in a much shorter period.
When the Dow crashed on October 19, 1987 it went from 2,246.73 the prior Friday to 1,738.74 that day. The numbers sure are smaller than today’s 21,200 but the 507.99 point drop that day represented a loss of 22.6% in a single trading day. The good news about the 1987 one-day crash is that the market did rebound sharply for two pivotal trading days to 1,841.01 the next day and then to 2,027.85.
[nativounit]
The bad news about that 289.11 point rally over the next two days in October of 1987 was that the recovery was only about 57% of what was lost in a single day. And more bad news was that a range of roughly 2,000 to 2,050 in the Dow acted as strong resistance on the charts on multiple occasions for months and the market lingered for a long period.
It was not until January 6, 1988 that the the Dow managed to close higher than the 2-day recovery period (again, 2,027.85) with a close of 2,037.80. Zooming forward a year to October 19, 1988 had the Dow only at 2,137.27, and the Dow seemed to stumble every time it rose about 2% to 3% from the 2,100 mark.
What is rather interesting about the period of the crash of 1987 compared to 2020 is that the Dow had peaked at 2,746.65 on August 25, 1987 after rising as much as 44.8% from the close-out Dow price of 1,895.95 at the end of 1986.
Comparing that move to 2020, the Dow’s fourth quarter of 2018 was a period of extreme panic selling as long as it’s not compared to this period now. That panic-selling low close for the Dow in late 2018 was 21,792.20 on December 24, 2018. That put the Dow’s recent peak of 29,568.57 up 35.7% from that closing low reference point in late 2018.
There are many issues to consider about reference in 2020 to 1987. Pure technicians would suggest that chart comparisons always matter. Fundamentalists would argue that the modern economy is vastly different from then versus now, and it’s hard to ignore that only 12 of the Dow’s 30 components of 2020 were members of the Dow back at the time of the 1987 crash. IBM was the only tech stock in the Dow at the time of the 1987 crash, when most small and mid-sized businesses were still using typewriters.
Back in 1987 the market was dealing with a frothy performance, but the interest rate environment was night and day back then. There was no such thing as a coronavirus or any other type of virus that caused the 1987 crash, and they didn’t even really have OPEC to blame. The difference between then and now on the regulation side is that we now have tight trading curbs that prevent a free-fall of that magnitude from happening as rapidly, and interest rates are at extreme lows in 2020.
Perhaps the only good news here about what’s happening in 2020 is that the trading halts and trading curbs did appear to actually work. And let’s call it like it is — even as crappy as this trading day turned out to be, it almost felt like it could have been worse.
[wallst_email_signup]
We have included 3 stock charts from BigCharts.com as a reference point. The first includes a one-year Dow chart for all of 1987. The second chart is from September 1, 1986 to December 31, 1987 and the last chart includes the Dow’s dismal fourth quarter of 2018 up to March 12, 2020.
Contact [email protected] for any questions or corrections.