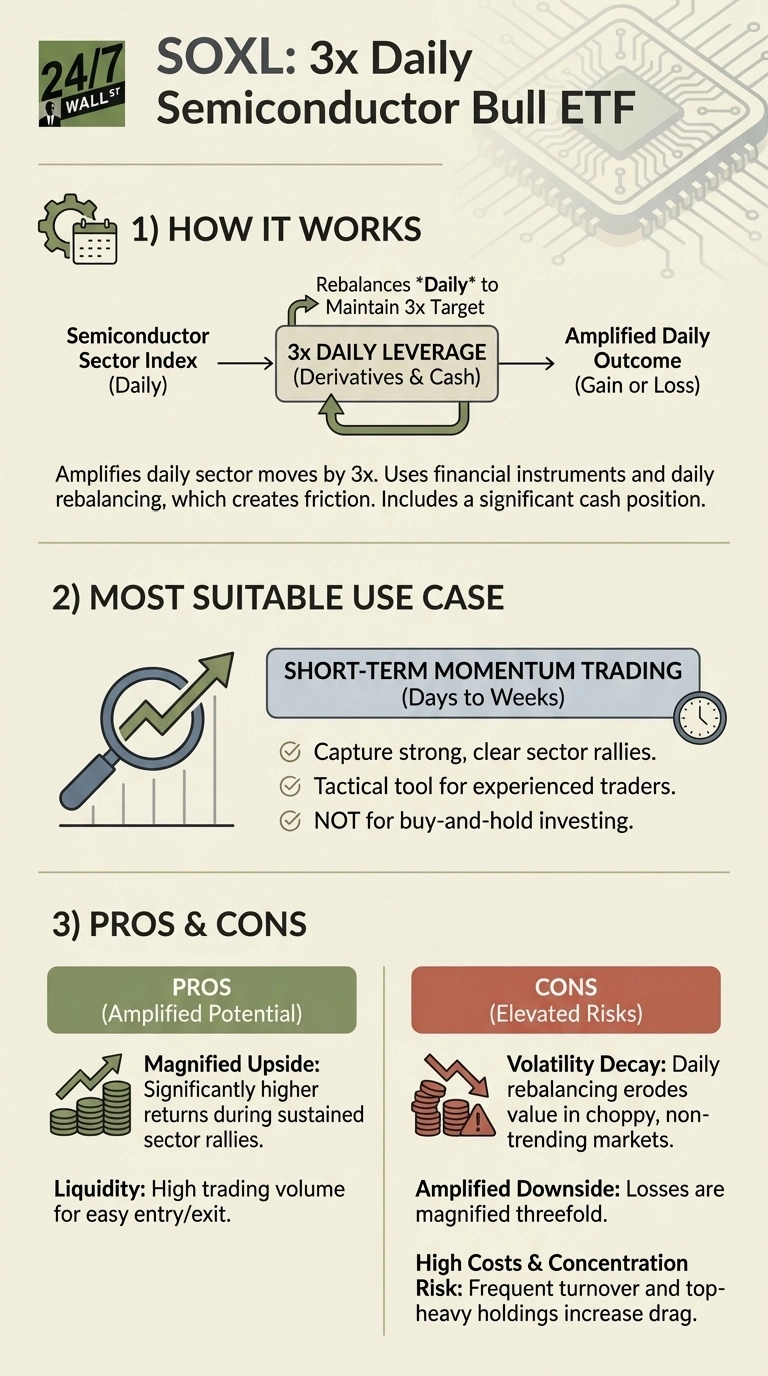
Leveraged ETFs demand a different monitoring framework than buy-and-hold funds, and SOXL’s 3x daily exposure to semiconductors makes the distinction especially sharp. With $13.6 billion in assets and an extremely high portfolio turnover rate driven by daily rebalancing, this fund combines sector momentum and structural decay. As 2026 approaches, investors need to separate broad semiconductor trends from the mechanics that make leveraged products behave differently than their underlying holdings.
The Memory Cycle and AI Capex: What Moves the Sector
Two macro forces will shape semiconductor performance in 2026. First, memory pricing power matters enormously. Micron, representing 4.5% of SOXL’s equity exposure, posted 257% year-over-year earnings growth as the memory downturn reversed. But that recovery depends on sustained AI infrastructure spending and data center buildouts. Watch quarterly DRAM and NAND pricing reports from TrendForce and DRAMeXchange, published monthly, to gauge whether supply discipline holds or excess capacity returns.
Second, AI chip capital expenditure cycles drive the equipment makers that comprise roughly 10% of SOXL’s holdings. Lam Research, Applied Materials, and KLA collectively indicate whether hyperscalers are expanding fab capacity or pausing. Monitor their quarterly earnings calls, particularly commentary on backlog and lead times. When equipment orders soften, semiconductor rallies typically stall within two quarters.
Rebalancing Costs and Concentration Risk
SOXL’s structure creates friction that matters more in choppy markets than trending ones. The fund holds roughly 30% in cash and treasury instruments, plus a 13.8% ICE Semiconductor Index Swap position, to achieve daily rebalancing. This cash drag reduces upside capture during rallies. When the fund climbed 48% from its November low of $30.81 to a December high of $50.09, then dropped 17% within two days, that volatility eroded value through compounding effects.
Top-ten concentration at 40% of equity exposure creates meaningful risk. Broadcom alone represents 6.1% and trades at a forward P/E ratio of 38x, expecting earnings to nearly double. If that growth disappoints, SOXL amplifies the damage threefold. Check Direxion’s monthly fact sheets for shifts in holdings concentration and tracking error versus the underlying index.
Distribution consistency also signals strategy execution. Review the fund’s income sources quarterly, whether from dividends, securities lending, or derivative premiums, to understand payout sustainability.
A Simpler Alternative Worth Knowing
The VanEck Semiconductor ETF (SMH) offers unleveraged semiconductor exposure with a 0.35% expense ratio and $17 billion in assets. Its 15-year track record and tighter bid-ask spreads make it easier to monitor execution quality and avoid daily rebalancing decay during sideways markets.
For 2026, watch memory pricing trends monthly and track whether SOXL’s 30% cash position starts compressing upside as volatility persists.
Contact [email protected] for any questions or corrections.