Playing It Safe at 70 With $2.5 Million Is Likely To Backfire
A 70-year-old investor with $2.5 million in blue-chip dividend stocks faces a question many retirees wrestle with: is playing it safe actually risky? On Reddit's r/Bogleheads forum, one user questioned whether their early-70s father's portfolio with just 10% in stocks…

This post may contain links from our sponsors and affiliates, and Flywheel Publishing may receive compensation for actions taken through them.

A 70-year-old investor with $2.5 million in blue-chip dividend stocks faces a question many retirees wrestle with: is playing it safe actually risky? On Reddit’s r/Bogleheads forum, one user questioned whether their early-70s father’s portfolio with just 10% in stocks was too conservative, noting it “seems just almost too conservative, where it’s almost at a tipping point where it’s actually risky.”
The portfolio holds five established dividend payers: Johnson & Johnson (NYSE:JNJ | JNJ Price Prediction), Microsoft (NASDAQ:MSFT), Procter & Gamble (NYSE:PG), Coca-Cola (NYSE:KO), and Verizon (NYSE:VZ). All five are profitable companies with strong margins and long dividend histories. At 70 with a substantial nest egg, the real question is whether this allocation matches the investor’s actual time horizon and income needs.
| Key Factor | Details |
|---|---|
| Age | 70 years old |
| Portfolio Value | $2.5 million |
| Holdings | 5 blue-chip dividend stocks |
| Current Yields (approx.) | JNJ 2.1%, MSFT 0.95%, PG 2.9%, KO 2.6%, VZ 6.7% |
| Weighted Average Yield | ~3.1% |
| Estimated Annual Income | ~$77,500 |
The Income Reality: Dividends Alone Won’t Cut It
Based on current dividend yields, this portfolio generates roughly $77,500 annually at a blended rate of about 3.1%. Johnson & Johnson currently yields around 2.1% after a 3.1% dividend increase in April 2026 brought the annual payout to $5.36 per share, marking the company’s 64th consecutive year of dividend growth. Procter & Gamble yields near 2.9%, Coca-Cola approximately 2.6%, Microsoft close to 0.95%, and Verizon around 6.7%. That blended income falls short of the $100,000 that a standard 4% withdrawal rate would provide on a $2.5 million portfolio.
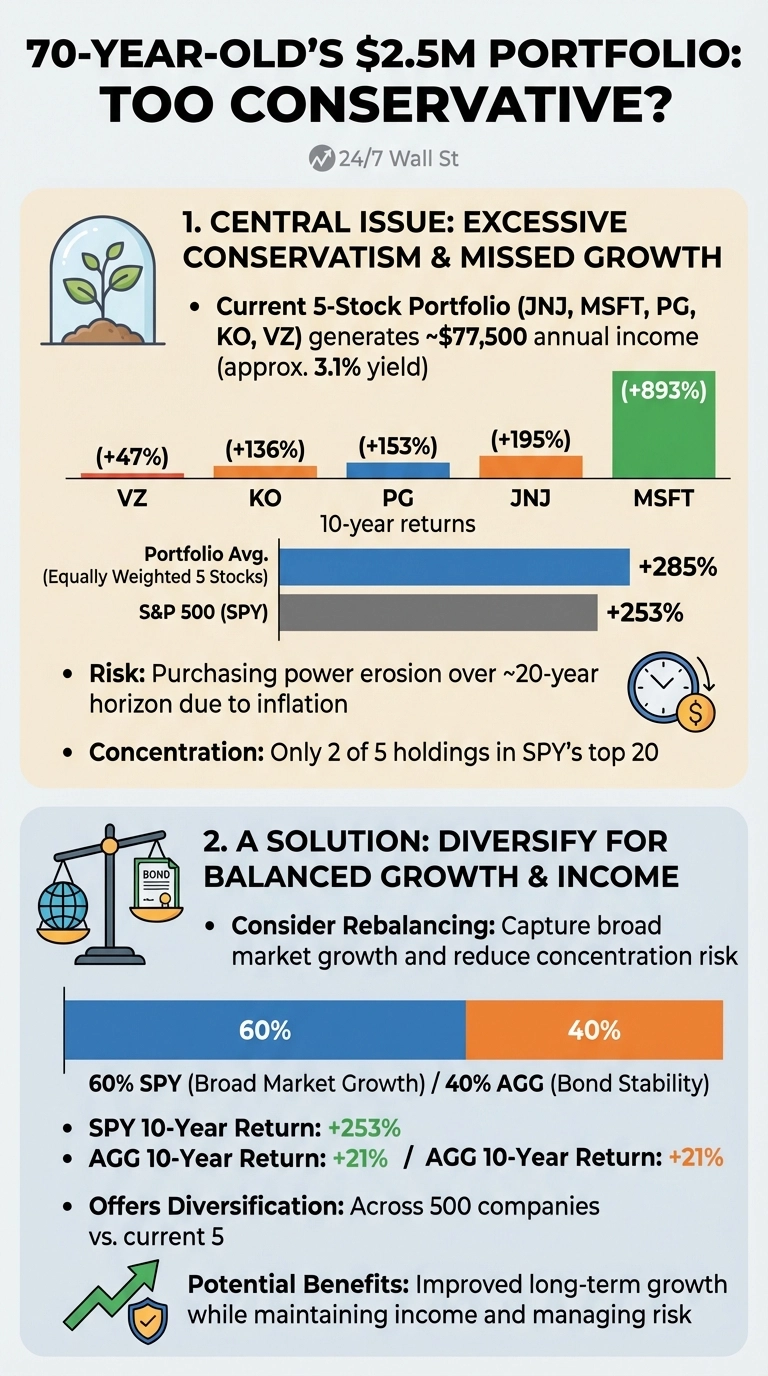
The 10-year performance data tells a clear story about trade-offs. Defensive holdings like JNJ (+195%), PG (+153%), KO (+136%), and VZ (+47%) delivered modest returns, while Microsoft surged 893% over the same span. The S&P 500 gained 253%. An equally weighted portfolio across all five would have grown roughly 285% over 10 years, beating the broad market largely on the strength of Microsoft alone.
At 70, this investor likely has a planning horizon well beyond a decade. According to UN World Population Prospects data, a 70-year-old in the United States has a total life expectancy of about 86 years, meaning 16 or more additional years to fund. The traditional “age in bonds” guideline would call for 70% bonds and 30% stocks. This portfolio runs 100% equities, which sounds aggressive until you examine the betas: four of the five holdings sit below 0.40 (JNJ 0.33, PG 0.39, KO 0.39, VZ 0.33), making them significantly less volatile than the broader market. Only Microsoft, with a beta near 1.07, provides meaningful growth exposure.
The Real Risk: Inflation and Longevity
The most serious threat to this portfolio is purchasing power erosion, not short-term market swings. At 3% annual inflation, $2.5 million loses half its real value in roughly 24 years. Dividend growth helps slow that erosion. Johnson & Johnson has now raised its payout for 64 consecutive years, Procter & Gamble for 70 straight years, and Microsoft has delivered annual dividend increases for 21 consecutive years at a roughly 10% average annual pace over the past decade. Even so, those growth rates vary considerably across the five holdings, and not all of them protect purchasing power equally.
Verizon presents a specific concern. Despite a yield around 6.7%, the company’s 10-year total return of just 47% severely lags its portfolio peers. High yield often signals that the market is skeptical about long-term growth prospects or dividend sustainability, and Verizon faces a fresh competitive challenge: following SpaceX’s IPO in 2026, investors have grown wary of satellite internet competition threatening traditional mobile carriers. That dynamic has weighed on Verizon shares and pushed the yield higher, but it has also sharpened questions about the company’s place in a five-stock retirement portfolio.
Observations on Similar Portfolios
Some retirees in comparable situations have shifted toward a 60/40 structure, pairing a broad market index with a bond allocation, to capture both income and growth within a single framework. Over 10 years, the S&P 500 returned 253% against AGG’s 21%, a gap that illustrates the real cost of prioritizing stability over growth at an age when time horizons still stretch 15 or more years. Others holding individual stocks have trimmed lagging high-yield positions in favor of broader technology exposure. Microsoft’s track record makes the case: it delivered 893% in total returns over the past decade while raising its dividend at roughly 10% per year, combining capital appreciation and growing income in a way few single stocks can match.
Considerations for Similar Portfolios
Retirees in comparable situations typically start by sizing up their actual income gap. When dividend income plus Social Security covers everyday expenses with room to spare, there is flexibility to optimize for long-term growth rather than near-term yield. Concentration in just five stocks also raises real diversification concerns: entire sectors including energy, financials, and most of technology are absent from this portfolio, creating gaps that become more consequential the longer the holding period. Verizon’s lagging performance deserves particular scrutiny, especially given the new competitive dynamics emerging from satellite internet providers and the stock’s outsized role in this portfolio’s income generation.
Caution makes sense at 70, but bonds returning 21% over 10 years while equities returned 253% represents a tangible opportunity cost. With potentially 16 or more years ahead, a portfolio anchored in just five low-beta stocks may not deliver the purchasing power protection a long retirement actually demands. The individual companies here are largely high-quality. The harder question is whether this specific five-stock mix, without any exposure to faster-growing sectors, is the right tool for a multi-decade income challenge.
This analysis is for informational purposes only and not personalized financial advice. Consult a qualified financial advisor for guidance specific to your situation.
Editor’s note: This update refreshed the dividend yields for all five portfolio holdings to current 2026 figures (JNJ ~2.1%, MSFT ~0.95%, PG ~2.9%, KO ~2.6%, VZ ~6.7%), added context on Johnson & Johnson’s 64th consecutive annual dividend increase and Microsoft’s decade-long ~10% average annual dividend growth rate, and incorporated the emerging competitive threat to Verizon from SpaceX’s satellite internet expansion following its 2026 IPO.
Contact [email protected] for any questions or corrections.
I am a long time investor and student of business, and believe finding good companies that can become great investments is the best game on earth. After 20 years of writing and researching the public markets it is clear that individuals have never had more tools and information to take control of their financial lives. From ETFs and $0 commissions to cryptos and prediction markets there has never been a greater democratization of access to investing.
I write to help people understand the investments available to them so they can make the best choice for their portfolio, whether they're starting out or looking for income in retirement.