
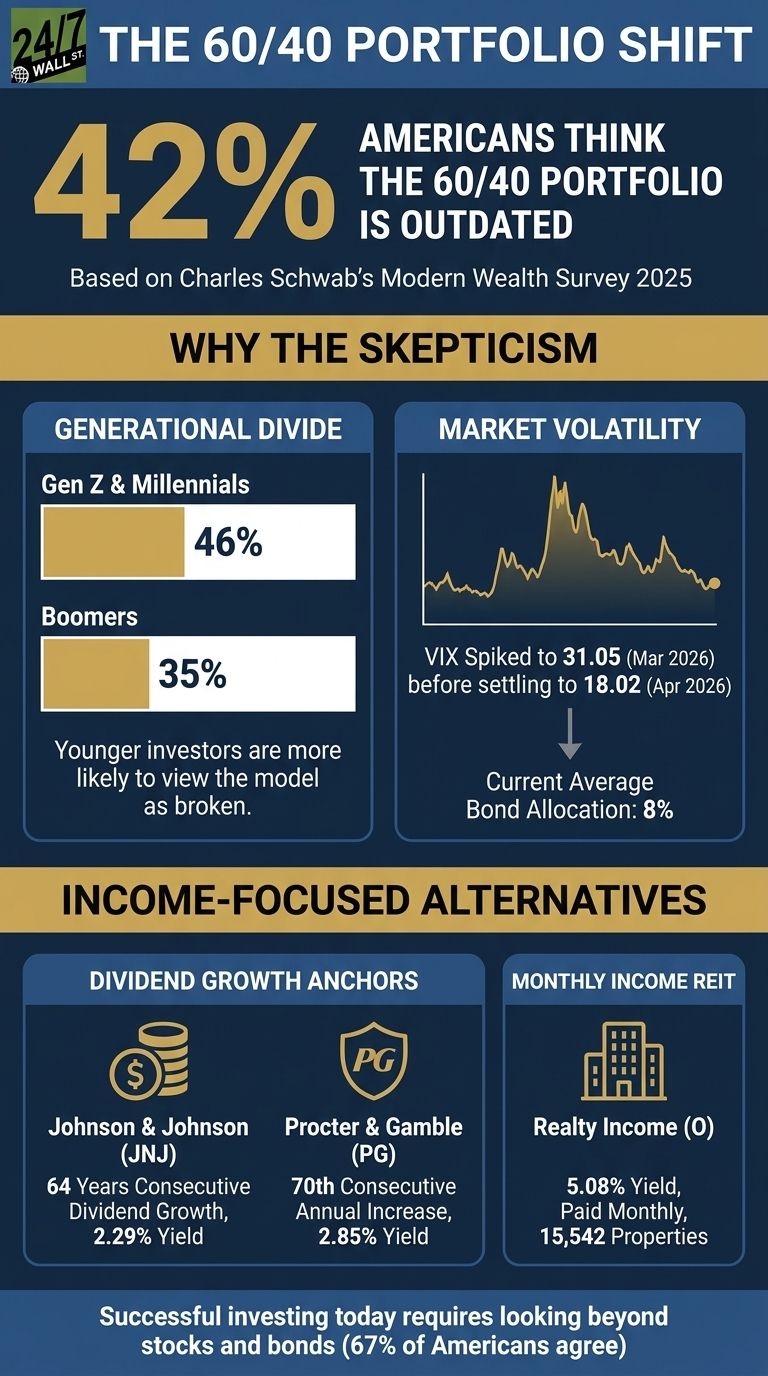
The traditional 60/40 portfolio, 60% stocks and 40% bonds, has been the default retirement allocation for decades. Charles Schwab’s Modern Wealth Survey 2025 found that 42% of Americans believe that mix is outdated, and the skepticism runs sharpest among younger investors. Among Gen Z and Millennials, 46% agree the model no longer works, compared with 39% of Gen X and just 35% of Boomers. The more striking number, though, is the consensus on what comes next: 67% of Americans say successful investing today requires looking beyond stocks and bonds entirely.
The macro backdrop explains why. The 10-year Treasury yield stood near 4.56% in mid-July 2026, up from the 4.35% level seen in late April, as markets priced in a possible Federal Reserve rate hike and energy inflation from the U.S.-Iran conflict pushed commodity costs higher. Consumer sentiment has sunk even deeper into distress. The University of Michigan Consumer Sentiment Index touched an all-time record low of 44.8 in May 2026 before rebounding to 49.5 in June, still the second-lowest reading on record. Year-ahead inflation expectations remain at a still-elevated 4.6%, well above the 3.4% reading in February before the conflict began. The VIX spiked to 31.05 on March 27, 2026, and has since settled to around 15.67. Pre-retirees who watched bonds and stocks fall together in 2022 are no longer looking for diversification in theory. They want diversification that actually diversifies.
What Americans Actually Hold
The Schwab survey breaks down the average portfolio into pieces that look nothing like 60/40. Stocks make up 25%, mutual funds 13%, bonds 8%, ETFs 6%, real estate 7%, cryptocurrency 10%, alternatives 3%, and options and futures 3%. Bonds at 8% is the headline figure. Investors have already migrated away from fixed income, even when their stated allocation targets have not caught up. The survey also found that 45% of respondents express interest in owning alternatives, with plans to increase crypto, alternatives, and real estate exposure over the next two decades.
The Income Replacement Framework
For pre-retirees focused on cash flow, the replacement for the bond sleeve typically draws from three buckets: dividend-paying equities, REITs, and covered call strategies. The logic is straightforward. Bonds were held for income and stability. Dividend equities deliver income with growth. REITs deliver real-estate-linked yield. Covered calls convert equity volatility into premium income. Three names illustrate how the building blocks actually differ from one another.
Johnson & Johnson (NYSE:JNJ | JNJ Price Prediction) anchors the defensive dividend role. The board approved a 3.1% increase to $1.34 per quarter in April 2026, marking the 64th consecutive year of dividend growth. At a yield of approximately 3.2%, the stock delivers nearly double the healthcare sector average of 1.8%. Q1 2026 revenue rose 9.9% to $24.06 billion, with adjusted EPS of $2.70, and management reaffirmed a full-year free cash flow target of roughly $21 billion.
[content-price-target ticker=”JNJ”]
Procter & Gamble (NYSE:PG) plays the same defensive role with a current quarterly dividend of $1.0885 per share, confirmed as recently as July 14, 2026. That marks the 70th consecutive annual dividend increase and 136 unbroken years of payouts since the company’s incorporation in 1890. A beta near 0.4 means the stock moves less than the broader market, making it the closest approximation a common stock offers to the volatility profile of an investment-grade bond.
[content-price-target ticker=”PG”]
Realty Income (NYSE:O) handles the REIT slot and the income-frequency piece. The company declared its 670th consecutive monthly dividend in May 2026, with the most recent rate set at $0.2710 per share for the July 2026 payment. The portfolio held 15,571 properties as of March 31, 2026, with Q1 2026 occupancy confirmed at 98.9%. Q1 2026 revenue rose 12.2% year over year to $1.55 billion. For an investor accustomed to bond coupons arriving twice a year, a monthly check from net-lease real estate is the most direct income substitute available in public markets.
[content-price-target ticker=”O”]
What This Means For Pre-Retirees
Three practical questions follow from the data above. First, the bond sleeve in the average American portfolio already sits near the survey’s 8% figure, so the more useful question is whether that reflects a deliberate target or simple drift over time. Second, with the 10-year Treasury now near 4.56%, a blended dividend-equity and REIT allocation targeting 3% to 5% with embedded growth may serve income needs better than a static bond position, particularly given that duration risk has cost fixed-income investors dearly in recent years. Third, a REIT like Realty Income carries genuine equity volatility. It pairs differently with lower-beta dividend growers than a straightforward one-for-one bond swap would suggest, and that asymmetry is worth understanding before making any allocation shift.
Data Sources
Survey data on portfolio composition and generational attitudes toward the 60/40 model come from the Charles Schwab Modern Wealth Survey 2025. Yield and consumer sentiment figures are drawn from Federal Reserve Economic Data (FRED) and the University of Michigan Surveys of Consumers. Dividend histories and quarterly results for Johnson & Johnson, Procter & Gamble, and Realty Income are sourced from company SEC filings and investor relations disclosures.
Editor’s note: This update refreshes the 10-year Treasury yield to approximately 4.56% as of mid-July 2026, replaces the March 2026 consumer sentiment reading of 53.3 with the June 2026 final reading of 49.5 (which followed a record low of 44.8 in May), updates Realty Income’s property count to 15,571 and its monthly dividend rate to $0.2710, and adds context on the company’s 670th consecutive monthly payment and Q1 2026 revenue growth of 12.2%.
Contact [email protected] for any questions or corrections.