Whether you are a beginner or a retiree, generating passive income can be your primary investing goal. No matter where you are in your investment journey, a consistent stream of income can help build wealth. To do this, many prefer to invest in dividend stocks. While they make quarterly payments, there’s never a guarantee that the dividends will continue. If you want to reduce risk and generate a passive source of income, consider exchange-traded funds (ETFs).
They are professionally managed funds that invest in hundreds of dividend-paying stocks. Many of these top ETFs pay monthly dividends, generating steady passive income for you. They look for stocks with a steady payout, strong financials, and high yields. Some also generate additional income by selling call options. Here are three well-diversified ETFs that pay monthly dividends like clockwork with a yield up to 8%.
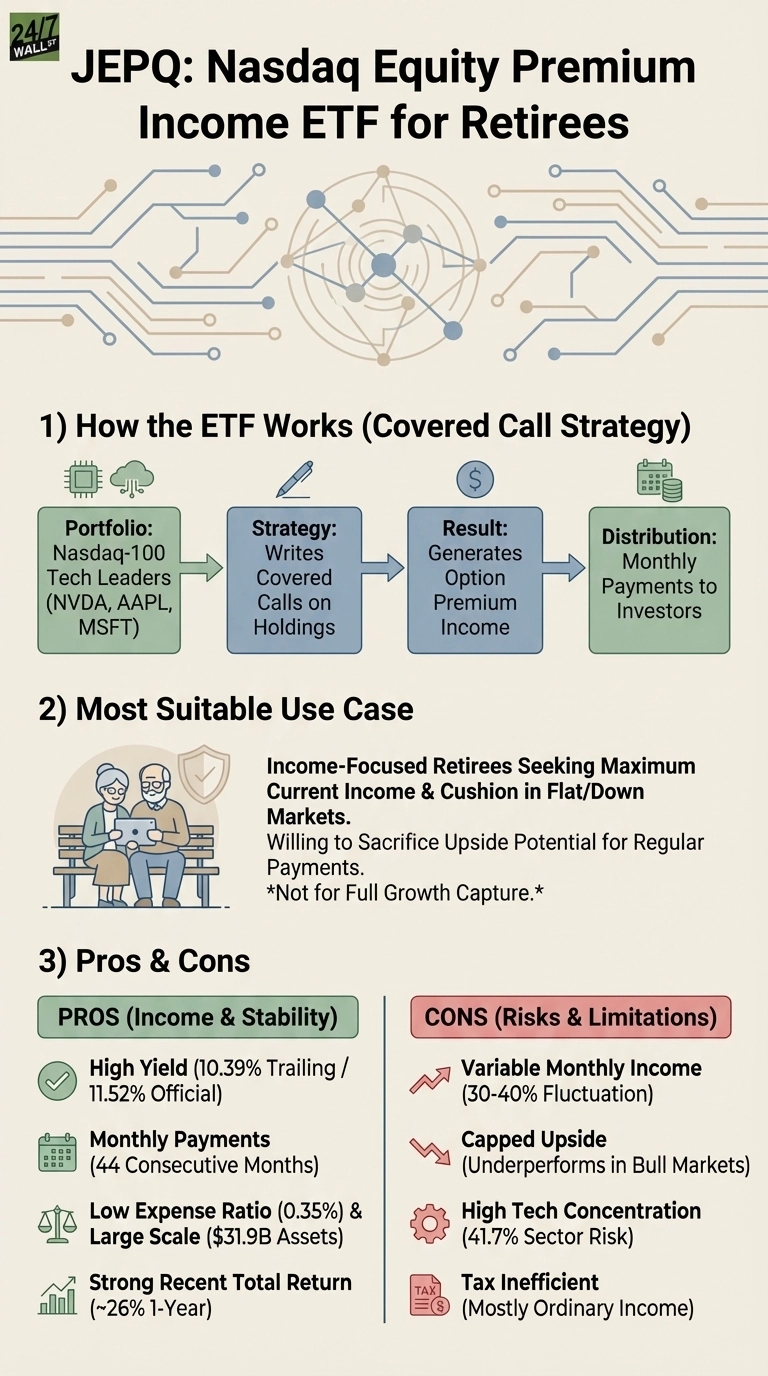
JPMorgan Equity Premium Income ETF
The JPMorgan Nasdaq Equity Premium Income ETF (NYSEARCA:JEPQ) is a unique ETF offering an excellent yield of 11.42%. A popular choice amongst dividend investors, the fund generates income by investing in blue-chip stocks and selling options. This unique strategy generates a premium for the ETF, which helps maintain the high yield.
It invests in stocks in the Nasdaq 100 index and picks the companies that have low volatility. This helps offer downside protection to the investors. It then sells call options and generates a premium on them. The fund has $32 billion in assets under management. It has generated a 3-year return of 89.11%.
JEPQ has an expense ratio of 0.35% and pays monthly dividends. It has increased dividends for 3 consecutive years and recently announced a dividend of $0.465 per share. While the yield won’t be consistent month to month, you can count on it being higher than other dividend ETFs.
The ETF invests in 108 stocks, with the highest concentration in the technology sector at 41%. This is followed by communication services at 12% and consumer discretionary at 10.4%. Since it is a tech-heavy fund, the top 10 holdings are the Magnificent Seven, including Nvidia, Meta Platforms, Amazon, Apple, Alphabet, and Microsoft.
JEPQ is a solid income vehicle and a king when it comes to dividend ETFs.
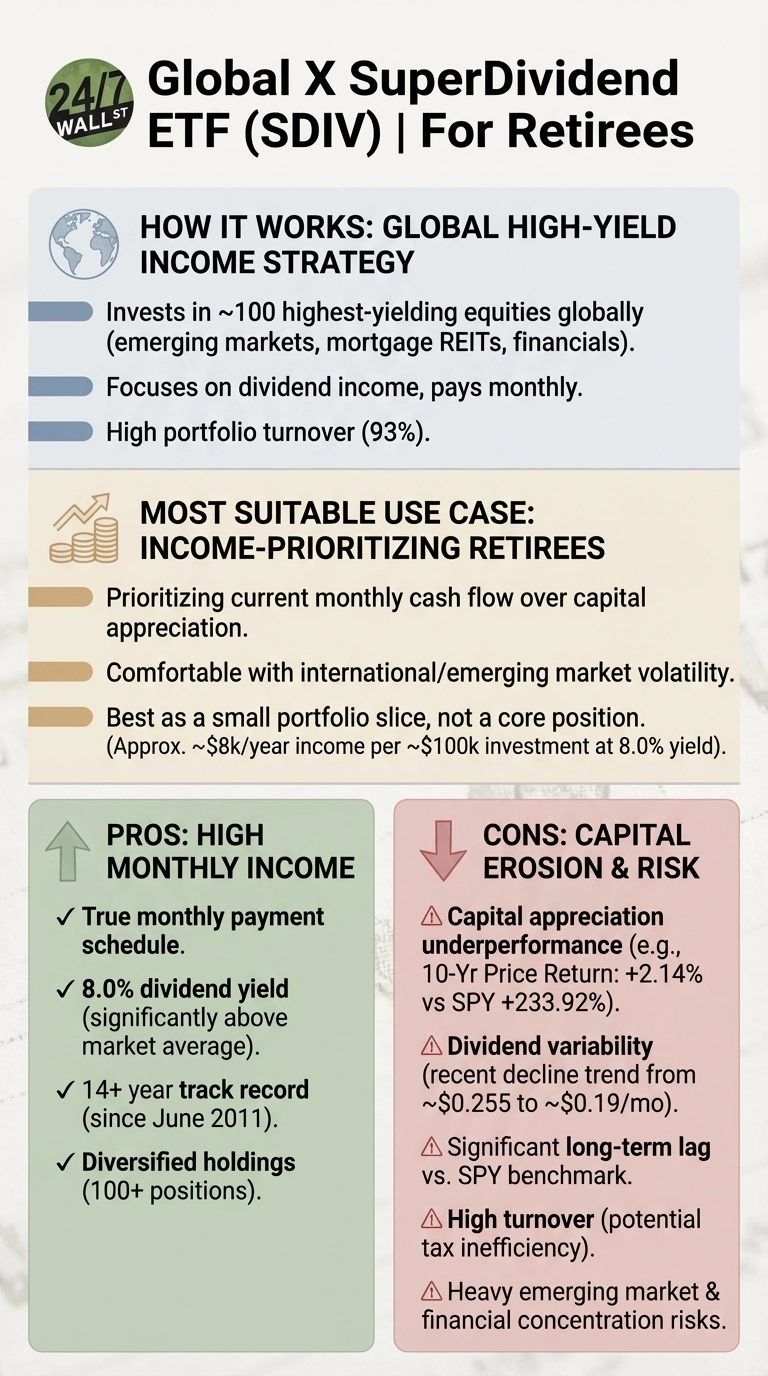
Global X SuperDividend ETF
The Global X SuperDividend ETF (NYSEARCA:SDIV) will give international exposure to your portfolio. The fund invests in 100 of the highest dividend-paying stocks in the global market. SDIV has a yield of 8.88% and selects stocks from the Solactive Global SuperDividend Index. It announced a dividend of $0.19 in January.
The fund pays monthly dividends and has paid dividends for 14 straight years. It has an expense ratio of 0.58%. With regard to the sectors, it invests 31% in financials, 17% in the energy sector, and 15% equally in materials and real estate. Country-wise, it has the highest allocation in the United States (28.8%), Brazil (14.2%), and Britain (10.5%).
While the fund holds only 106 stocks, no stock has a weightage higher than 2%. It invests in the highest-yielding stocks in the world and doesn’t look at the dividend history or sustainability.
SDIV has generated an average annualized return of 28.27% in a year and 11.43% in 3 years. If you’re looking to build a globally diversified portfolio by investing in an industry away from tech, this is the ETF to choose.
An investment of $100,000 in the ETF can generate about $8,800 in annual dividends. It prioritizes regular income over capital appreciation and is trading for $25 as of writing.
Amplify CWP Enhanced Dividend Income ETF
An actively managed fund, the Amplify CWP Enhanced Dividend Income ETF (NYSEARCA:DIVO) invests in dividend-paying stocks and writes covered calls on them. It aims to deliver steady monthly income by ensuring low volatility. Ideal for low-risk investors, DIVO has a yield of 4.81%. It has also delivered impressive performance and generated an average annualized return of 15.30% in a year and 14.11% in 3 years.
The ETF has an expense ratio of 0.56% and invests in only 40 stocks. It lays emphasis on investing in high-quality large-cap companies that have shown a strong dividend history and earnings growth. It is heavily concentrated on financials (26.98%), technology (16.46%), and consumer discretionary (14.12%).
Its top 10 holdings include RTX Corp, Caterpillar Inc., Home Depot, American Express, Apple, Microsoft, Visa, and CME Group. These are companies that have remained strong even during market uncertainties. While DIVO uses a covered call strategy, it doesn’t go all-in on the income component. It holds a part of the portfolio and uses a covered call strategy on just a portion of the portfolio. It allows the fund managers to capture the upside while maintaining security for investors. This helps generate income, maintain dividends, and reduce volatility.
DIVO has gained 9.78% in the past year and is exchanging hands for $46.59.