Wells Fargo (NYSE: WFC) and Citigroup (NYSE: C) both reported Q4 2025 earnings on January 14, 2026, yet investors sold off both stocks despite solid results. The selloff reflects concern over net interest income pressure in a higher-for-longer rate environment. Since January 1, 2026, Wells Fargo has declined 4.98% while Citigroup has slipped just 0.36%, revealing how different business models respond to the same rate backdrop.
How the Quarter Landed: Asset Cap Removal vs. Cost Restructuring
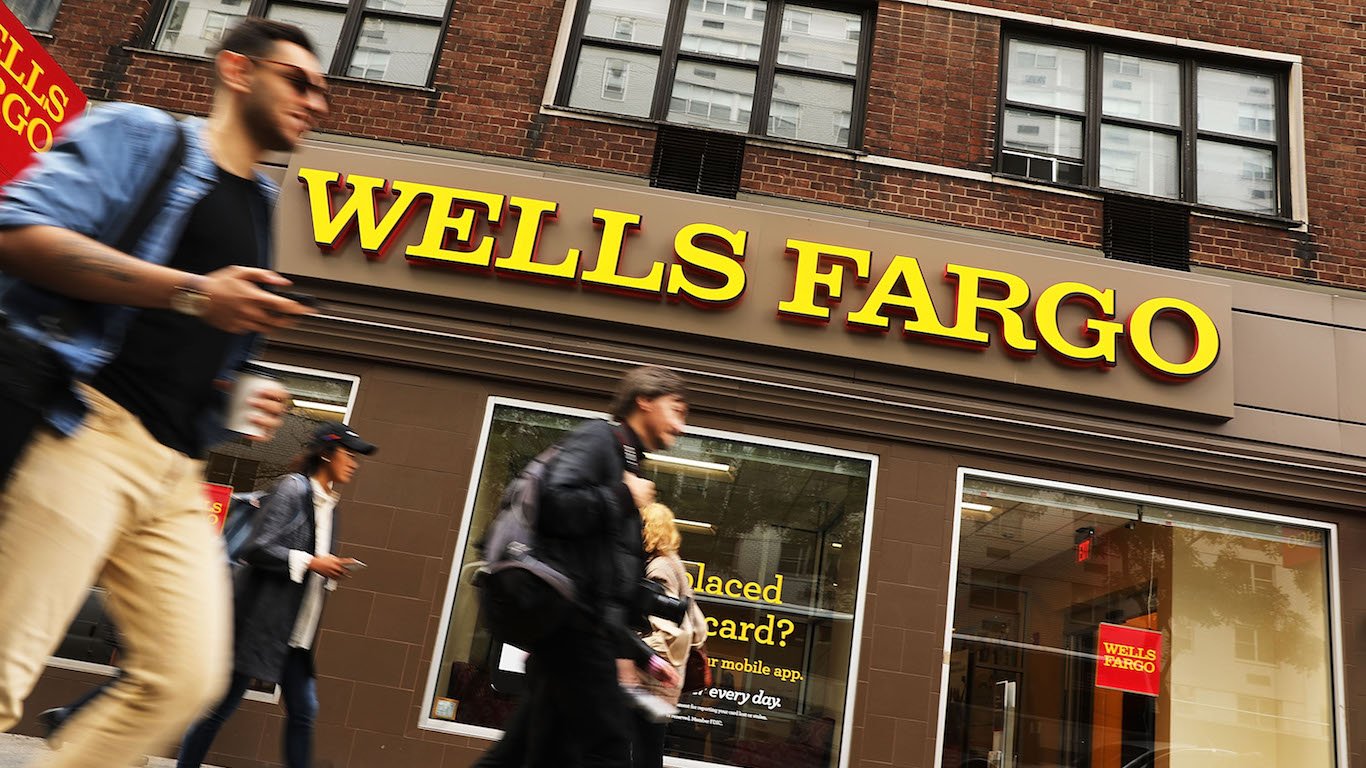
Wells Fargo delivered $21.29 billion in revenue and $1.76 EPS, topping earnings expectations but falling short on the top line. Its Consumer, Small & Business Banking segment rose 9% to $6.59 billion, while Credit Card climbed 7% to $1.38 billion. CEO Charlie Scharf called the removal of the Federal Reserve asset cap transformational: “Strong financial performance, removal of the asset cap […] and stronger growth in both our consumer and commercial businesses make me proud of our 2025 results.” Net interest income grew 4% year-over-year on higher loan balances and fixed-rate asset repricing.
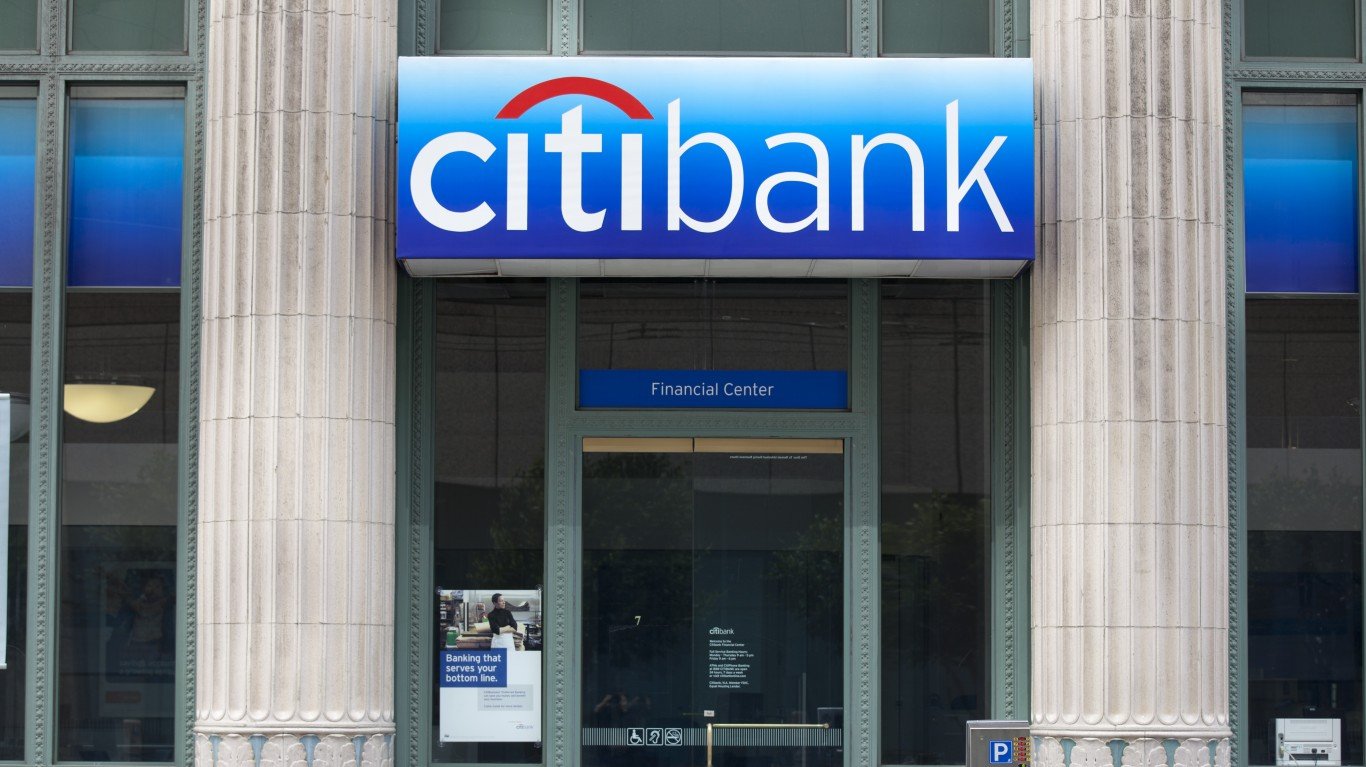
Citigroup posted $19.90 billion in revenue and $1.19 EPS, missing both estimates. Net income fell 13.8% to $2.5 billion, weighed down by 6% higher operating expenses tied to compensation, legal, and technology costs. Banking revenues surged 78% and Services rose 15%, but Markets slipped 1%. CEO Jane Fraser’s restructuring included 1,000 job cuts in January 2026. The bank’s presence in 180+ countries provides diversification but also exposes it to geopolitical volatility.
One Bet on Domestic Growth, One on Global Reach
With the asset cap lifted, Wells Fargo can grow deposits and loans without regulatory constraint. Management raised its medium-term return on tangible common equity target to 17% to 18% from 15%, expects mid-single-digit loan and deposit growth in 2026, and anticipates two more Fed rate cuts. The 10Y-2Y yield curve spread at 0.64% supports net interest margin expansion, though further cuts could compress that advantage.
Citigroup leans into institutional banking, cross-border services, and wealth management. Its $208 billion market cap reflects a lower valuation than Wells Fargo’s $278 billion, with Citi trading at 1.06x book value versus Wells Fargo’s 1.64x. Fraser’s turnaround targets a lower expense base while protecting Services and Banking revenue, though Russia-related tax impacts continue to surface.
| Metric | Wells Fargo | Citigroup |
| Dividend Yield | 1.95% | 2.06% |
| Q4 Buybacks + Dividends | $6.4B | $5.6B |
| Price-to-Book | 1.64x | 1.06x |
Why Wells Fargo Edges Ahead for Income
Wells Fargo increased its quarterly dividend 13% over 2025 to $0.45 and repurchased $5.0 billion in stock during Q4 alone. Citigroup’s 2.06% yield is slightly higher, but declining net income and rising expenses cloud the picture. Wells Fargo’s domestic focus also insulates it from geopolitical risk. For those drawn to a turnaround play, Citi’s discount to book value offers appeal, though the restructuring timeline remains uncertain. Trump’s proposed credit card interest rate cap poses a shared risk, though Wells Fargo’s diversified consumer banking portfolio may absorb it better than Citi’s card-heavy U.S. personal banking segment.