Williams Companies (NYSE:WMB | WMB Price Prediction) CEO Chad Zamarin made a point recently that cuts through a lot of noise about U.S. energy dominance. The numbers he laid out reveal a structural asymmetry that most investors haven’t fully priced in.
“The United States is the largest exporter of natural gas. We export a third of global LNG supplies. We only export about 3% of global liquid fuel supplies.”
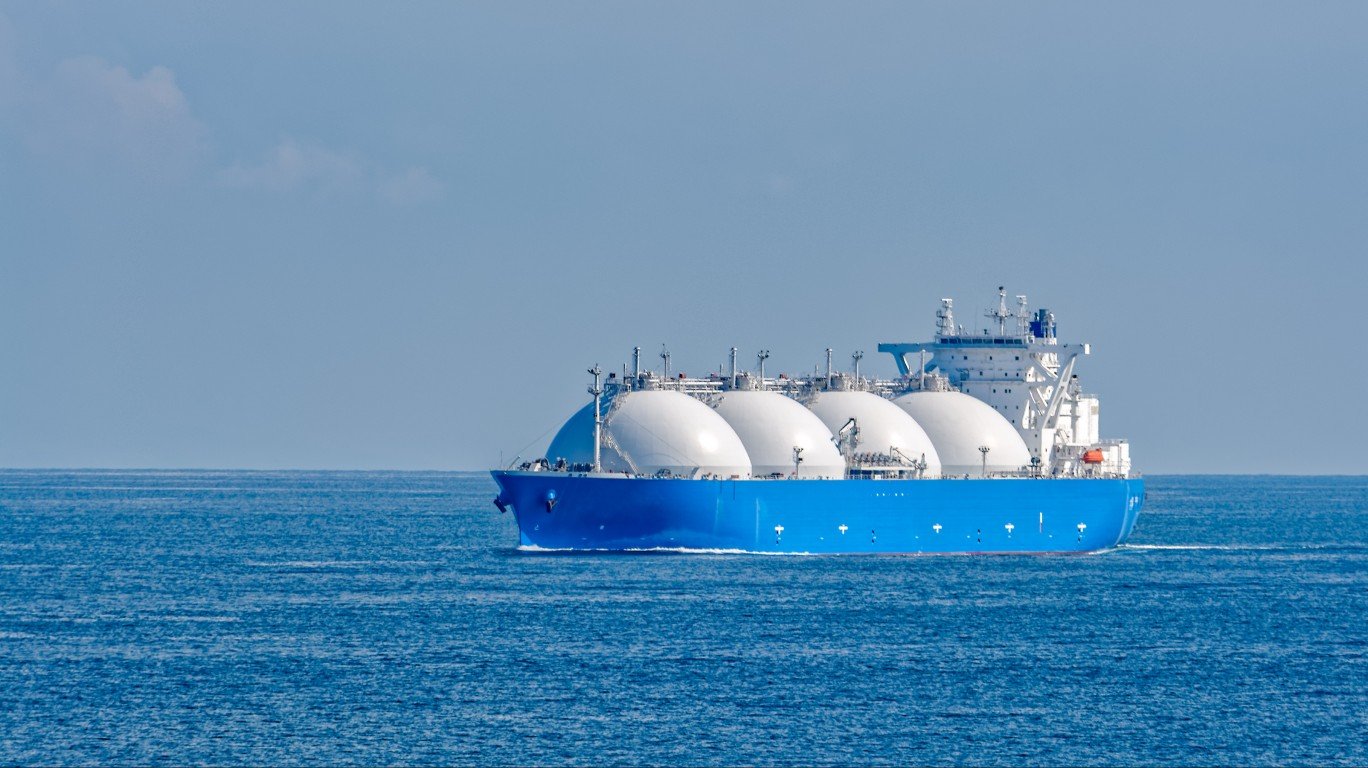
One in three molecules of LNG traded globally originates in the United States. But when it comes to oil, the U.S. is essentially a minor player on the export stage, shipping out just 3% of global liquid fuel supplies.
The production data behind this is striking. The U.S. produces approximately 110 billion cubic feet of natural gas per day but only consumes approximately 80 billion cubic feet per day domestically. That surplus flows through pipelines, gets liquefied, and gets shipped to energy-hungry markets worldwide. The U.S. is producing 40% more energy than it consumes.
Why the LNG vs. Oil Gap Matters Right Now
The geopolitical implications are real and immediate. When global oil markets get rattled by a disruption in the Strait of Hormuz or a Middle East flare-up, U.S. consumers feel it at the pump almost instantly, because oil is a globally priced commodity and the U.S. is a price-taker, not a price-setter, in that market.
Natural gas is different. Because the U.S. dominates LNG export capacity, domestic prices are more insulated. Zamarin noted that domestic natural gas prices saw a smaller spike since the war began versus other global markets, with natural gas sitting near $3 per unit at the time of the interview. The Henry Hub data confirms this relative stability: February 2026 saw natural gas at $3.62/MMBtu, well below the $8.81/MMBtu peak hit in August 2022.
Being the dominant producer, Zamarin’s argument goes, is precisely what creates the buffer against geopolitical crises.
The Williams Investment Case
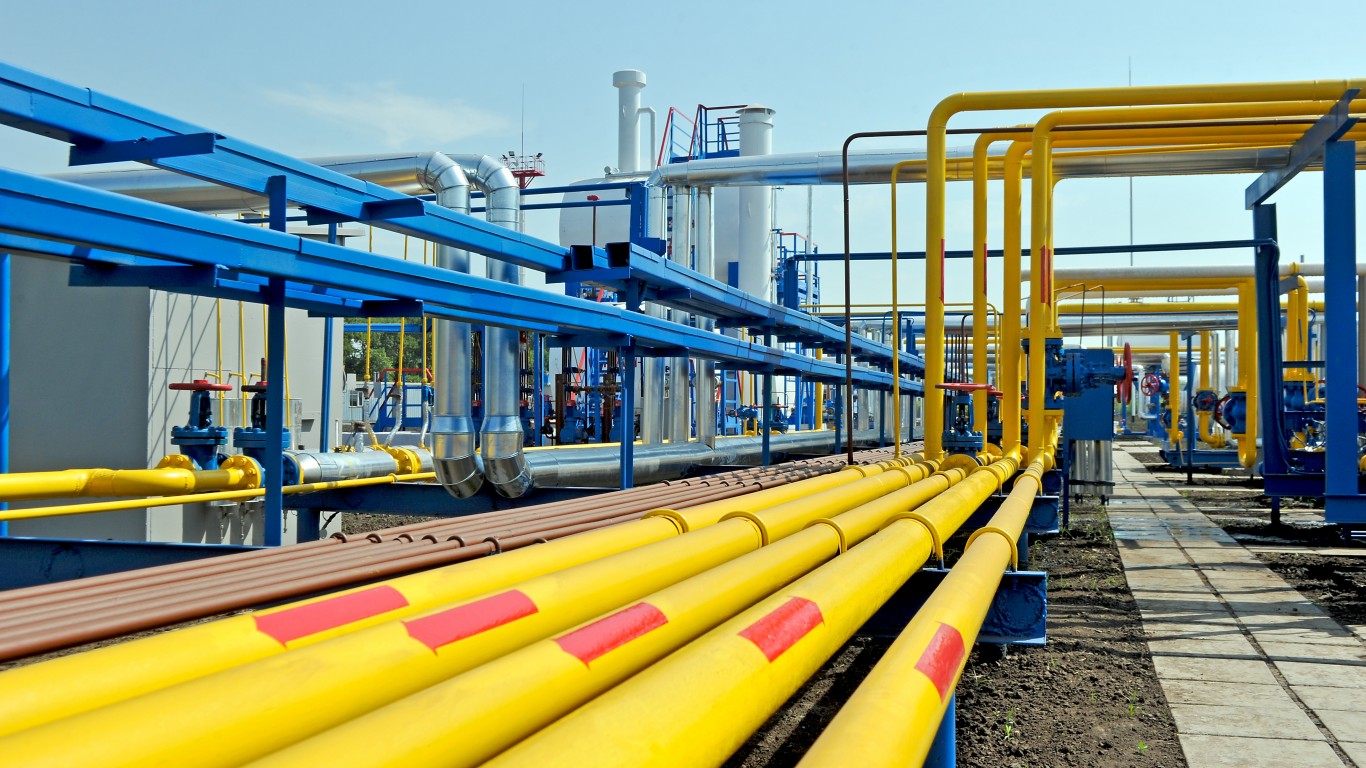
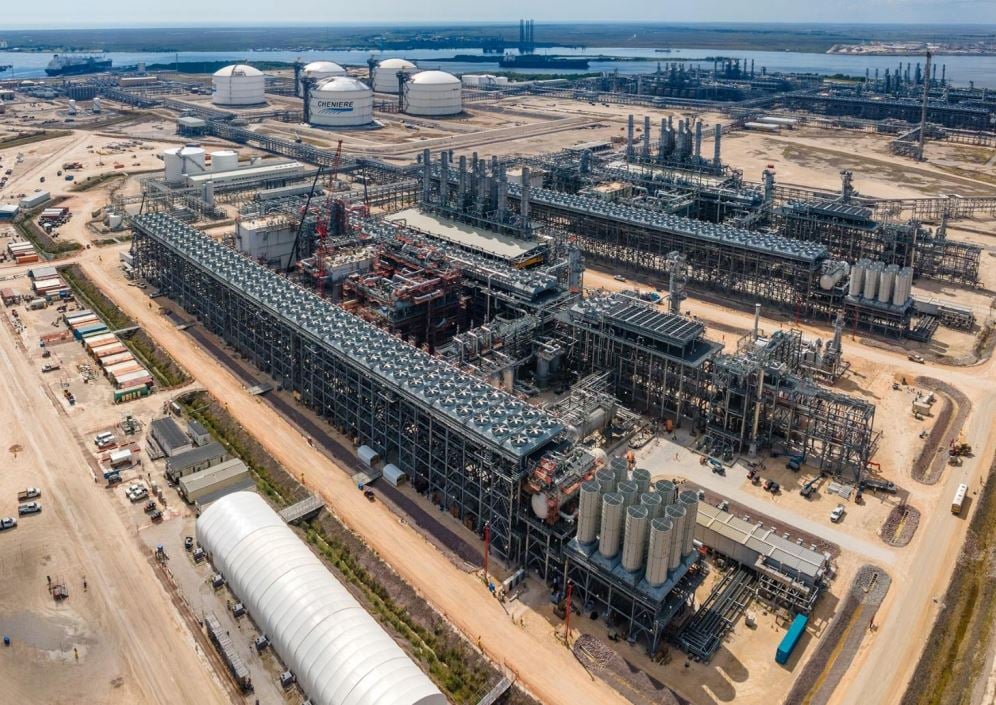
Williams sits at the center of this structural story. Transco, its flagship pipeline, is the largest natural gas pipeline system in the country. The company recently made a strategic investment in Woodside Energy’s Louisiana LNG project, adding $500 million to growth capex in Q3 2025, a direct bet on the LNG export boom Zamarin is describing.
Full year 2025 results were strong: record adjusted EBITDA of $7.75 billion, up 9% year-over-year, with operating cash flow of $5.9 billion, up 19%. The company guided 2026 adjusted EBITDA to a midpoint of $8.2 billion and raised its dividend for the 52nd consecutive year, to $2.10 annualized. The stock has gained nearly 23% year-to-date through mid-March 2026.
Williams operates as the infrastructure backbone for U.S. natural gas transport, with Transco serving as the largest natural gas pipeline system in the country. The export asymmetry Zamarin described reflects the structural position Williams occupies in the domestic natural gas market, and the company has posted 52 consecutive years of dividend growth alongside record adjusted EBITDA of $7.75 billion in 2025.
Contact [email protected] for any questions or corrections.