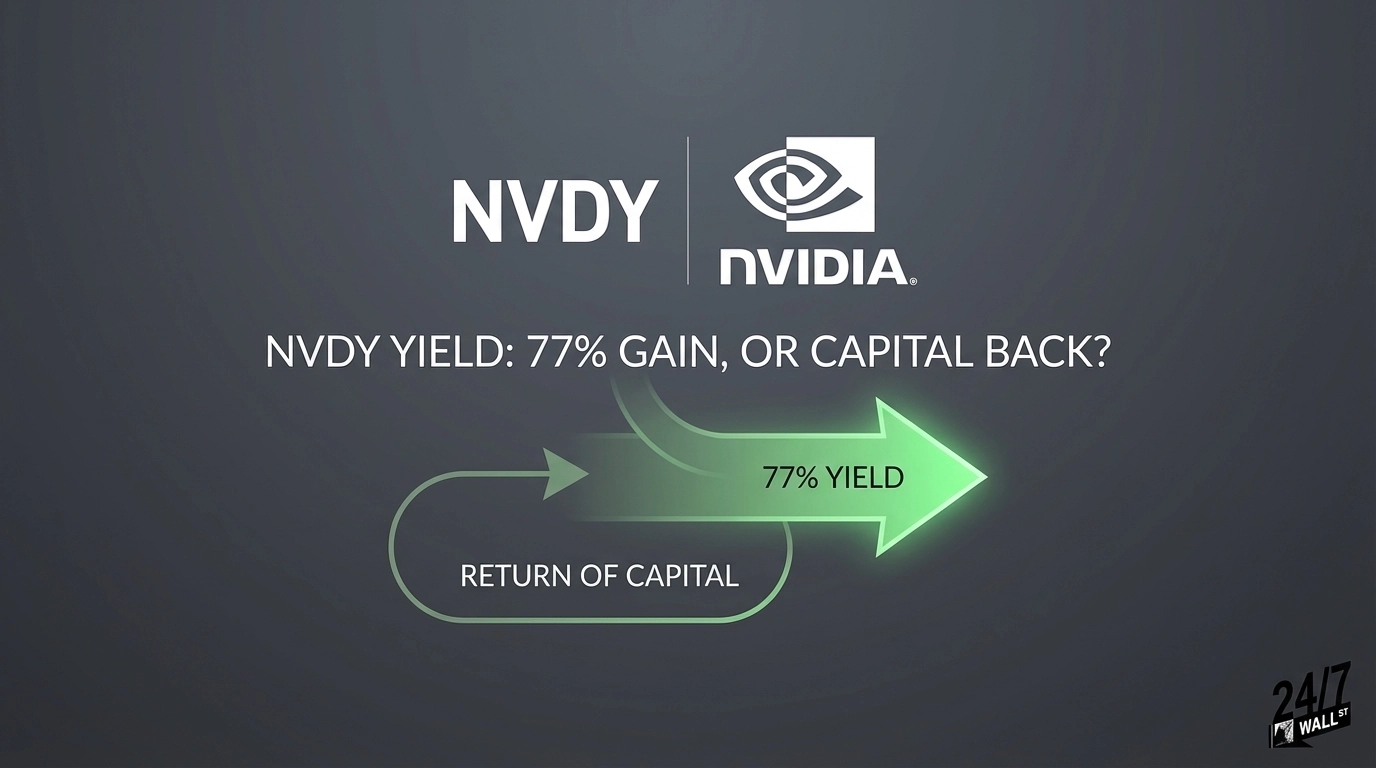
YieldMax NVDA Option Income Strategy ETF (NYSEARCA:NVDY) advertises a yield that has ranged from 38.73% to as high as 121.82% depending on when you look. Right now the figure circulating is roughly 77%. That number is real in a narrow sense. The distributions actually hit your account. But a significant portion of what you receive may be your own money coming back to you, not income generated by an underlying asset.
How the Strategy Works
NVDY runs a synthetic covered call strategy on Nvidia. The fund sells call options on Nvidia stock and distributes the premiums as income. When Nvidia rises sharply, those calls cap NVDY’s upside. When Nvidia falls, NVDY absorbs the decline nearly in full. The result is a structure that collects option premium but participates in most of the downside.
“While NVDY’s yield isn’t ‘fake,’ it comes with drawbacks such as a 1.27% operating expense ratio and potential share-price erosion due to its option-selling strategies, which limit upside and cause price declines with distributions,” wrote David Moadel of 24/7 Wall St. in February 2026.
Return of Capital vs. Return on Capital
This is the distinction that matters. A significant portion of NVDY’s distributions has been classified as return of capital rather than investment gains. When a fund returns capital, it is paying you back with your own investment. Your cost basis shrinks, your NAV erodes, and the “yield” figure becomes misleading as a measure of actual income generation.
Consider what the price history shows. NVDY launched on May 10, 2023 at $3.44 per share and trades at $13.52 as of March 13, 2026. That looks like appreciation, but Nvidia itself tells a different story. NVDA rose 524.58% from May 10, 2023 through March 13, 2026, climbing significantly over the same period. An investor who simply held Nvidia stock captured that full run. NVDY holders collected distributions but surrendered most of the capital appreciation that drove them.
The fund also experienced a 21% decline from August to December 2025, illustrating how quickly NAV can erode when Nvidia sells off.
Who This Actually Makes Sense For
Not everyone should dismiss NVDY. Retirees drawing down a portfolio sometimes prefer return-of-capital distributions because they can be tax-deferred until the cost basis reaches zero. If you need regular cash flow and have already decided on your Nvidia allocation, NVDY’s weekly distributions (the fund shifted from monthly to weekly payouts in 2025) provide a structured drawdown mechanism.
The fund carries a 1.27% operating expense ratio and $1.3 billion in net assets. It is a real product with a real strategy. The current yield falls within the range the fund has historically advertised. It is just not what most investors picture when they hear the word “yield.” Understanding the distinction between return of capital and return on investment is essential when evaluating any high-yield fund strategy.
Contact [email protected] for any questions or corrections.