The YieldMax NVDA Option Income Strategy ETF (NYSEARCA:NVDY) sells investors a specific trade: take NVIDIA (NASDAQ:NVDA | NVDA Price Prediction) price exposure, give up most of its upside, and collect weekly cash in return. NVDY is one of the largest single-stock covered call ETFs on the market, with about $1.37 billion in net assets. The fund’s appeal is straightforward income on the most-watched AI stock in the world. The question for any holder is whether the income is worth the cost of foregone gains, and the answer depends on how the underlying NVIDIA position behaves.
How the fund actually makes money
The fund uses a synthetic covered call strategy to generate its income. According to the May 2026 fact sheet, the portfolio is built on 11.5% in direct NVDA shares and 20.6% in U.S. Treasuries, while the rest of the fund is balanced through a mix of long and short NVDA call options with strikes ranging from $165 to $220. Those short calls pull in the premiums used to pay out your weekly cash. Just keep in mind that the synthetic long position means you take on the full brunt of any downside if NVIDIA shares happen to drop.
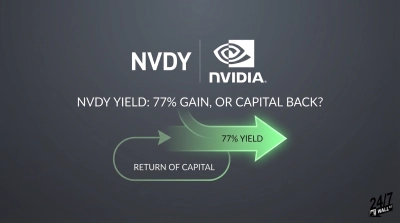
The expense ratio is 1.09%, which is high relative to broad covered call ETFs. Distributions arrive weekly. Recent weekly payouts have ranged from $0.0848 to $0.2072 per share, with the most recent ex-date June 25 at $0.1005. Recent 19a-1 notices show that most of those distributions are classified as a return of capital, meaning a portion of the “yield” is the investor’s own principal being returned.
The promise versus the payoff
The asymmetric structure is the entire story. If NVDA rallies 30%, NVDY captures roughly 12%-15% while short calls absorb the rest. If NVDA falls by 30%, NVDY drops by about 24%, with the premium offsetting only around 6 percentage points. Holders absorb most of the downside and surrender most of the upside.
The longer-term math shows the gap. Since NVDY’s May 2023 inception, the fund has returned 310% on a distribution-adjusted basis. NVIDIA over a similar window contributed to a five-year total return of 878%. The recent picture is tighter: NVDA is up 24% over the past year while NVDY returned 25%, and year-to-date the two are within a percentage point of each other. The trade pays off best when NVDA chops sideways and lags hardest when it sprints.
The fundamentals of NVIDIA make the opportunity cost feel very real. The company posted Q1 FY27 revenue of $81.6 billion, an 85% year-over-year increase, along with non-GAAP EPS of $1.87 and Q2 guidance of $91 billion. CEO Jensen Huang recently described this period as the infrastructure expansion in human history. Any covered call written against that kind of growth backdrop will inevitably hit its cap over and over again.
What holders actually take on
- Capped upside, full downside. The short calls limit gains in every strong NVDA month, while the synthetic long carries the loss in every weak one.
- NAV erosion through ROC. Return-of-capital classifications quietly reduce cost basis. In a taxable account without basis tracking, it creates a future tax bill rather than tax savings.
- Concentration risk. One stock, one strategy, a 2.2 beta underlying, and a 1.09% fee stack on top of each other.
Where it fits, and where it does not
This fund suits an investor who specifically wants a weekly cash flow tied to NVIDIA volatility and accepts that capital appreciation belongs to someone else. You might consider an 80/20 split as a common structure, allocating 80% to direct NVIDIA exposure for upside and 20% to the fund for income, while capping the total position at about 5% of your overall portfolio. Any investor who rotates a full position into this strategy to collect income has effectively sold the original thesis while simply keeping the name on their statement. Direct shares remain the simpler instrument if your goal for NVIDIA is capital appreciation.
Contact [email protected] for any questions or corrections.