A lot of income investors get tripped up on something basic: the difference between a dividend and a distribution. People use the terms interchangeably, but they are not the same thing.
A dividend is a payment made by a company to its shareholders, typically out of its profits. A distribution, on the other hand, is a payout from an investment fund like an ETF, and the underlying sources can vary quite a bit. Distributions can include dividends, ordinary income, short- or long-term capital gains, and even return of capital.
That distinction matters more than many investors realize. Plenty of ETFs today advertise high “yields,” but those payouts are often driven by options strategies or other income-generating techniques. In many cases, the underlying holdings produce very little in the way of traditional dividends. Instead, investors receive a blend of income types, some of which are less tax efficient and less sustainable over time.
If you want a true dividend strategy, the better way to evaluate it is by pulling up your Form 1099-DIV and checking how much of the distribution is classified as dividends, ideally qualified ones. That simple check tells you far more than the headline yield number ever will.
For investors who prefer a more traditional, plain-vanilla approach, those ETFs still exist. They tend to be lower cost, easier to understand, and far less reliant on complex strategies. The yield is usually lower, but total return still matters more than income alone. With that in mind, here are two dividend-focused ETFs that pay monthly rather than quarterly.
Buy the Entire U.S. Dividend Market
The first option is WisdomTree U.S. Total Dividend Fund (NYSEARCA:DTD). This ETF ranks among the most diversified dividend funds available. It holds U.S.-listed companies that pay regular cash dividends and meet basic liquidity and market capitalization requirements, casting a much wider net than most dividend-focused peers.
Once a year in December, the index is rebalanced and weighted by the total cash dividends paid by each company. That is an important distinction. The weighting is determined by total dollars of dividends paid, not by dividend yield. As a result, larger and more established dividend payers rise to the top of the portfolio naturally.
In practice, this produces a very broad portfolio. Think of it as the total U.S. equity market with non-dividend-paying companies removed. The fund holds roughly 830 securities, yet exposure is still somewhat top-heavy, with more than a quarter of assets concentrated in the top ten holdings.
That construction leads to a more balanced sector composition than what you see in the S&P 500. Financials and technology are the two largest sectors at approximately 18.75% and 18.46% respectively, followed by healthcare at roughly 11.5%, and both industrials and consumer defensive names near 9% each. Technology’s weight has grown meaningfully over recent years as major dividend payers in that sector have expanded their payouts.
Stripping out non-dividend payers also pulls valuations lower. The portfolio trades at a meaningful discount to the broader market. After a 0.28% expense ratio, DTD currently offers around a 2% 30-day SEC yield, a modest payout that reflects the broad scope of its holdings rather than a high-yield mandate.
High Dividends, Lower Volatility From the S&P 500
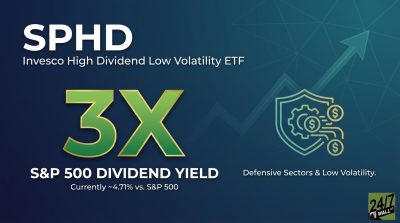
DTD is intentionally broad. It works well for investors who want to stay close to a total market approach while adding a modest income tilt. But if you are willing to accept more concentration in exchange for a higher yield, the Invesco S&P 500 High Dividend Low Volatility ETF (NYSEARCA:SPHD) takes a very different approach.
This ETF starts with the S&P 500, then screens for the 75 highest-yielding stocks and selects the 50 with the lowest trailing 12-month volatility from that group. Holdings are then weighted by dividend yield, with guardrails to prevent overconcentration. Each sector is limited to 10 companies and capped at 25% of the portfolio, and individual stocks are capped at 3%.
The result is a concentrated, defensively oriented portfolio. Real estate is the largest allocation at approximately 21.86%, followed by consumer staples at around 16.5%, and utilities at roughly 14%. That tilt toward rate-sensitive and cyclically insulated sectors shapes how the fund behaves across different market environments. Because of the high-yield screen, valuations are meaningfully lower than the broader market.
That defensive construction proved its value in early 2026. Through mid-March, SPHD was up approximately 3.7% while the broader S&P 500 fell about 3% over the same period, one of the widest divergences the fund has produced since early 2021. February 2026 also saw the fund post its highest monthly distribution on record at $0.20937 per share. SPHD has maintained uninterrupted monthly distributions since at least November 2012.
The trade-off is familiar. With only 50 holdings and heavy exposure to utilities and REITs, SPHD is rate-sensitive and tends to lag during growth-led market rallies driven by technology. Investors who prioritize income stability and lower volatility over capital appreciation are the natural audience here. After a 0.30% expense ratio, SPHD carries a 30-day SEC yield of 4.67% and a five-year monthly beta of 0.58 relative to the broader market.
Editor’s note: This article updates sector weightings for both DTD and SPHD to reflect current fund data, adds SPHD’s record February 2026 distribution of $0.20937 per share, and includes context on the fund’s outperformance of the S&P 500 through the market turbulence of early 2026.
Contact [email protected] for any questions or corrections.