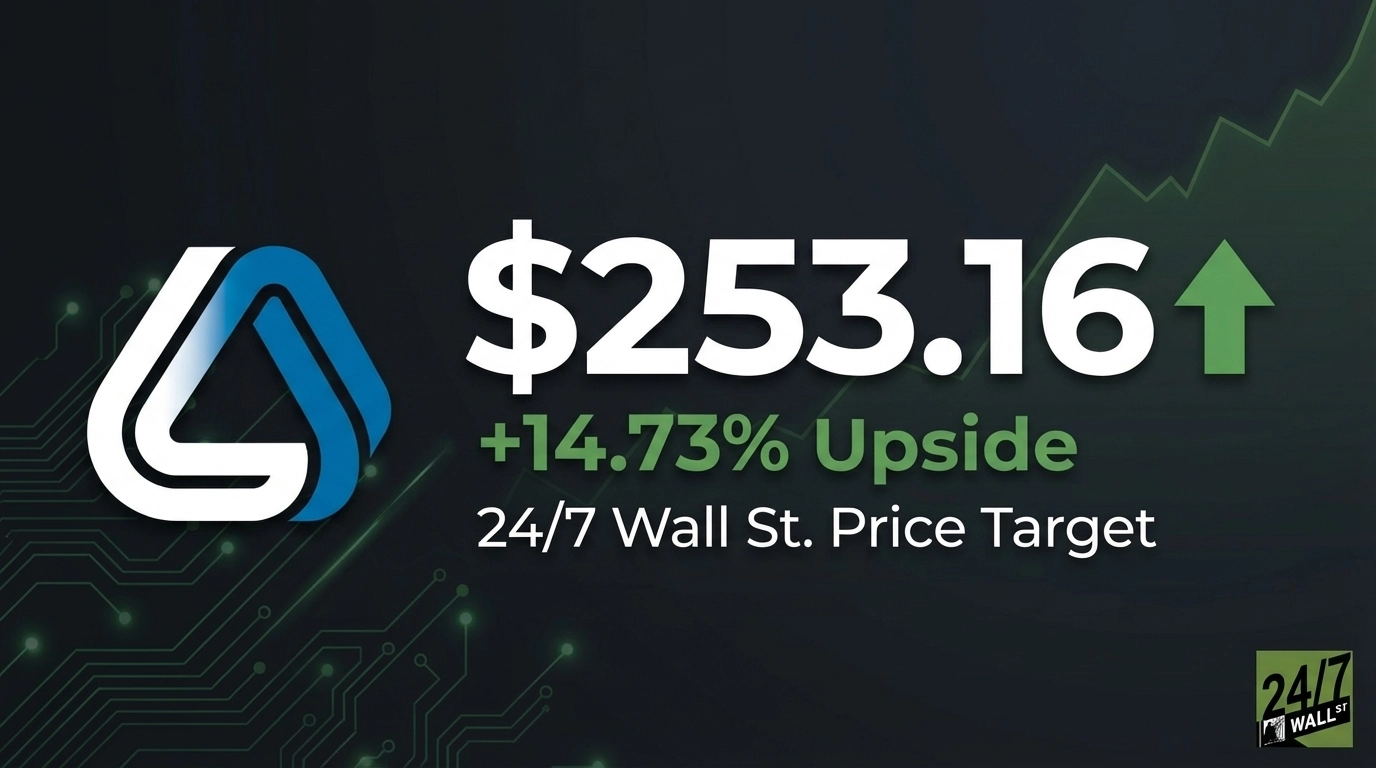
Lam Research (NASDAQ:LRCX | LRCX Price Prediction) trades at $220.65 as of April 7, 2026. The 24/7 Wall St. Price Target is $253.16, implying 14.73% upside over the next 12 months. The 24/7 Wall St. price target carries a 90% confidence level.
| Metric | Value |
|---|---|
| Current Price | $220.65 |
| 24/7 Wall St. Price Target | $253.16 |
| Upside | 14.73% |
| Recommendation | Bullish |
| Confidence Level | 90% |
Lam Research sits 14% below its 52-week high of $256.37 after the stock rose 276.15% from $58.66. At current prices, the 24/7 Wall St. price target implies 14.73% upside over the next 12 months.
A Year-Long Rally, Now Consolidating
The stock rose from $65.14 in April 2025 to a peak near 52-week high of $256.37, then pulled back to $220.65. Year-to-date, shares are up 29.05%, with the past week adding 10.36%. The January 28, 2026 earnings report showed revenue of $5.344 billion, a 22.14% year-over-year gain, with non-GAAP diluted EPS of $1.27, beating the $1.17 consensus estimate by 8.7%. Operating income expanded 35.71% year-over-year, and operating cash flow rose 99.48% year-over-year to $1.480 billion.
Inside the 24/7 Wall St. Price Target of $253.16
The 24/7 Wall St. Price Target uses a weighted blend of trailing P/E, forward P/E, and analyst consensus, then applies a proprietary factor adjustment.
| Component | Value | Weight |
|---|---|---|
| Trailing P/E-Based Price | $220.65 | — |
| Forward P/E-Based Price | $189.77 | — |
| Analyst Consensus Target | $274.90 | 30% |
| Weighted Base Price | $221.49 | — |
| Factor | Adjustment |
|---|---|
| Sector Momentum (Technology) | +15% |
| Analyst Consensus (75% bullish) | +4.5% |
| Earnings Growth (37% YoY) | +3% |
| Volatility (Beta 1.79) | -1.6% |
| Price Position (near 52-week high) | +1.5% |
| Social Sentiment | +1.1% |
| Mega-Cap Dampening | -50% reduction applied |
| Total Factor (247Factor) | 1.143x |
The 247Factor of 1.143 applied to the weighted base price of $221.49 produces the 24/7 Wall St. Price Target of $253.16. Mega-cap dampening prevents overstating momentum-driven upside; strong sector tailwinds and analyst consensus provide the lift.
Why Bulls See a Path to $274 and Beyond
The bull case rests on AI infrastructure spending driving multi-year demand for Lam’s deposition and etch equipment. CEO Tim Archer stated in the most recent earnings call: “With AI accelerating, we are ramping execution velocity across the company to support our customers’ growth and realize our vision for multi-year outperformance.” Systems revenue has climbed from $3.035 billion in Q3 FY2025 to $3.548 billion in Q1 FY2026, reflecting durable demand. The analyst consensus target of $274.90 is supported by 27 buy ratings and zero sell ratings. In the bull scenario, shares reach $274.80 by April 2027, a 24.54% return. Advanced packaging and 3D device complexity are structural tailwinds.
The Risks Worth Watching
The bear case centers on China revenue concentration. China represented 43% of revenue in Q1 FY2026 and 35% in Q2 FY2026. Any tightening of U.S. export controls could remove a material revenue stream with limited near-term replacement. The stock carries a beta of 1.79, meaning macro volatility hits it harder than the broader market. In the bear scenario, shares fall to $192.96 by April 2027, a -12.55% return. Gross margins have held between 49.0% and 50.6% across the past four quarters, and forward guidance of $5.70 billion in Q3 FY2026 revenue points to continued momentum even in a cautious macro environment.
What Retail Investors Are Saying
| Metric | Value |
|---|---|
| Average Sentiment Score | 65.5 |
| Average Activity Score | 19 |
| Interpretation | Moderately Bullish |
Reddit discussions in r/stocks during early March 2026 centered on semiconductor sector selloff opportunities, with Lam Research mentioned favorably. The most recent sentiment reading hit 78 (bullish), suggesting retail sentiment remains constructive on the pullback rather than viewing it as a trend reversal.
The Evidence Points One Direction
The 24/7 Wall St. Price Target of $253.16 reflects 22.14% revenue growth, 35.71% operating income expansion, and EPS beats in each of the past four quarters. According to earnings data, Lam Research has beaten EPS estimates in each of the past four quarters, with beats ranging from 3.28% to 9.92%. Return on equity sits at 65.6%, and the forward P/E of 32x is reasonable for a company growing earnings at 37% year-over-year. The bull case holds as long as AI capex spending continues driving deposition and etch intensity higher. The primary risk: U.S. export controls expanding to cover additional Lam product lines sold into China.
Lam Research Price Predictions: 2026-2030
| Year | 24/7 Wall St. Price Target |
|---|---|
| 2026 | $253.16 |
| 2027 | $266.21 |
| 2028 | $283.75 |
| 2029 | $307.52 |
| 2030 | $315.98 |
These projections assume Lam Research continues executing on its AI-infrastructure strategy and that China revenue remains accessible. A material escalation in export controls or a semiconductor capex downturn represents the primary downside risk.
Contact [email protected] for any questions or corrections.