The U.S. economy has not endured a genuine depression since the early 20th century under Presidents Herbert Hoover and Franklin D. Roosevelt, but the less severe recession has arrived four distinct times since 2000:
- 2001: The dot-com bubble crash
- 2007-2008: The subprime mortgage banking meltdown
- 2020: The Covid-19 pandemic
- 2022: A “technical” recession (two consecutive quarters of negative GDP growth)
During each of those downturns, the S&P 500 absorbed real damage. Defensive stocks, defined broadly as companies supplying indispensable goods and services regardless of the economic climate, tend to hold their ground and sometimes post modest gains when the broader market slides. That category covers utilities, food producers, personal care brands, and pharmaceuticals. Household names like Walmart, Procter & Gamble, and Con Edison sit inside the S&P 500 and helped cushion its worst stretches.
One unassuming ETF, however, has done more than just cushion the blow. Vanguard Utilities Index Fund ETF Shares (NYSEARCA:VPU) has soundly outperformed the S&P 500 in three of the recessions this century. Because VPU launched in January 2004, it missed the dot-com crash entirely, but its record across the downturns it has lived through is notable.
Vanguard Utilities Index Fund ETF Shares
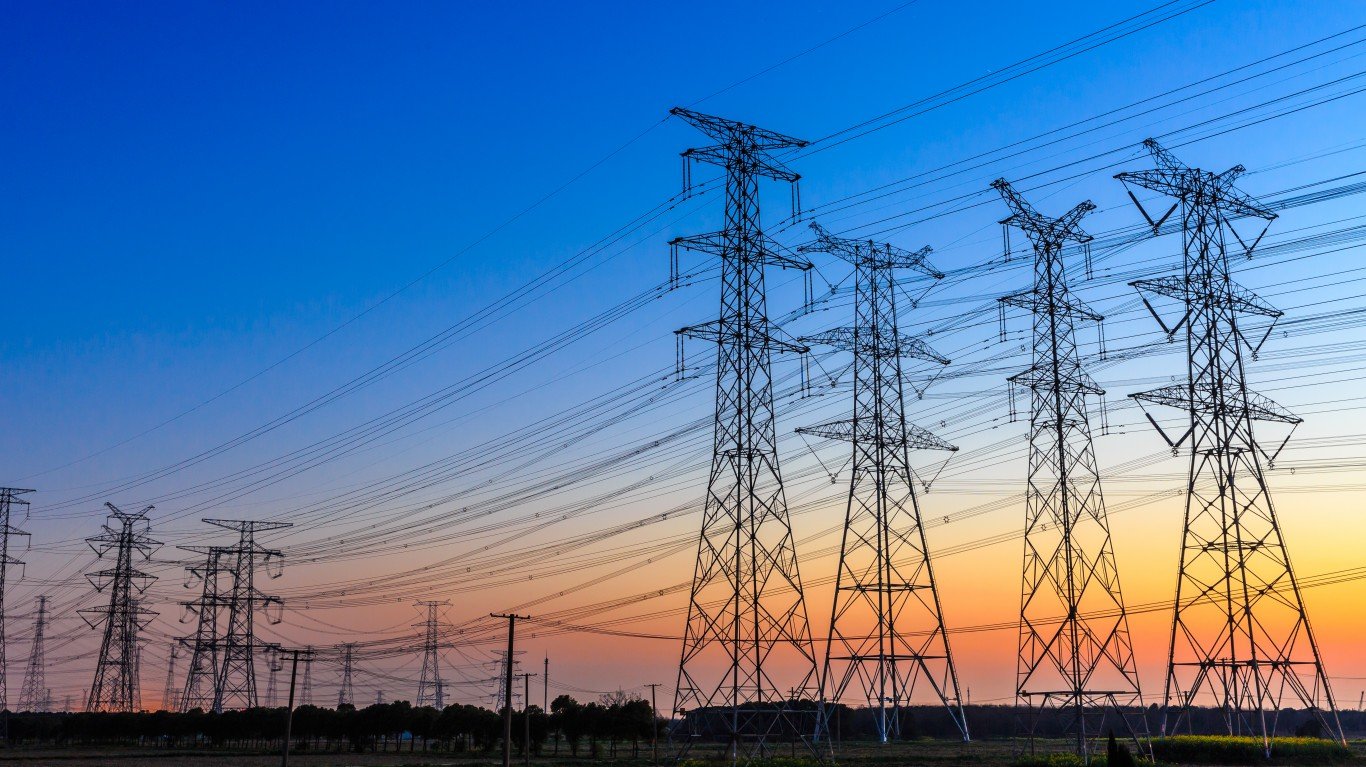
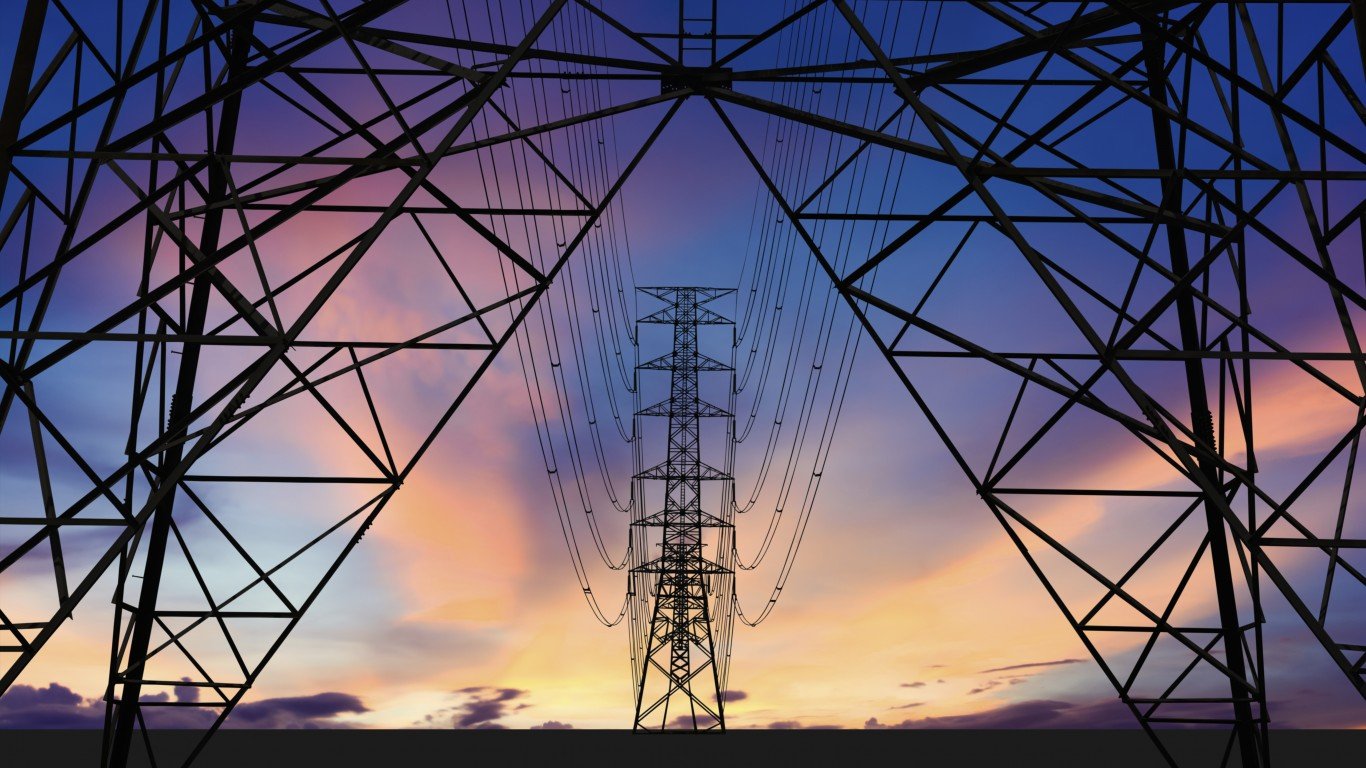
Due to their indispensibility, water, electric and gas utilities are staples of the defensive stocks sector.
Designed to track the MSCI US Investable Market Utilities 25/50 Index, VPU launched on January 26, 2004. It is passively managed and allocates roughly 99.2% of its portfolio to utilities stocks, with the remainder split between energy and industrials. Those utilities span the electric, water, gas, and nuclear industries. The fund currently holds 75 individual securities, with its five largest positions led by NextEra Energy, Southern Company, Duke Energy, Constellation Energy, and American Electric Power.
| Net Assets | $8.7 billion | Expense Ratio | 0.09% |
| Yield | 2.52% | Beta | 0.50 |
| Average Daily Vol. | 245,223 shares | YTD Return | 8.25% |
| 52-Week Range | $172.67–$206.10 | 1-Year Return | 13.31% |
| NAV | $192.31 | 5-Year Return | 10.11% |
| P/E Ratio | 21 | 10-Year Return | 10.12% |
Growth is a lower priority for utilities investors than consistency, reliability, and controlled volatility. Three qualities matter most to those who hold VPU:
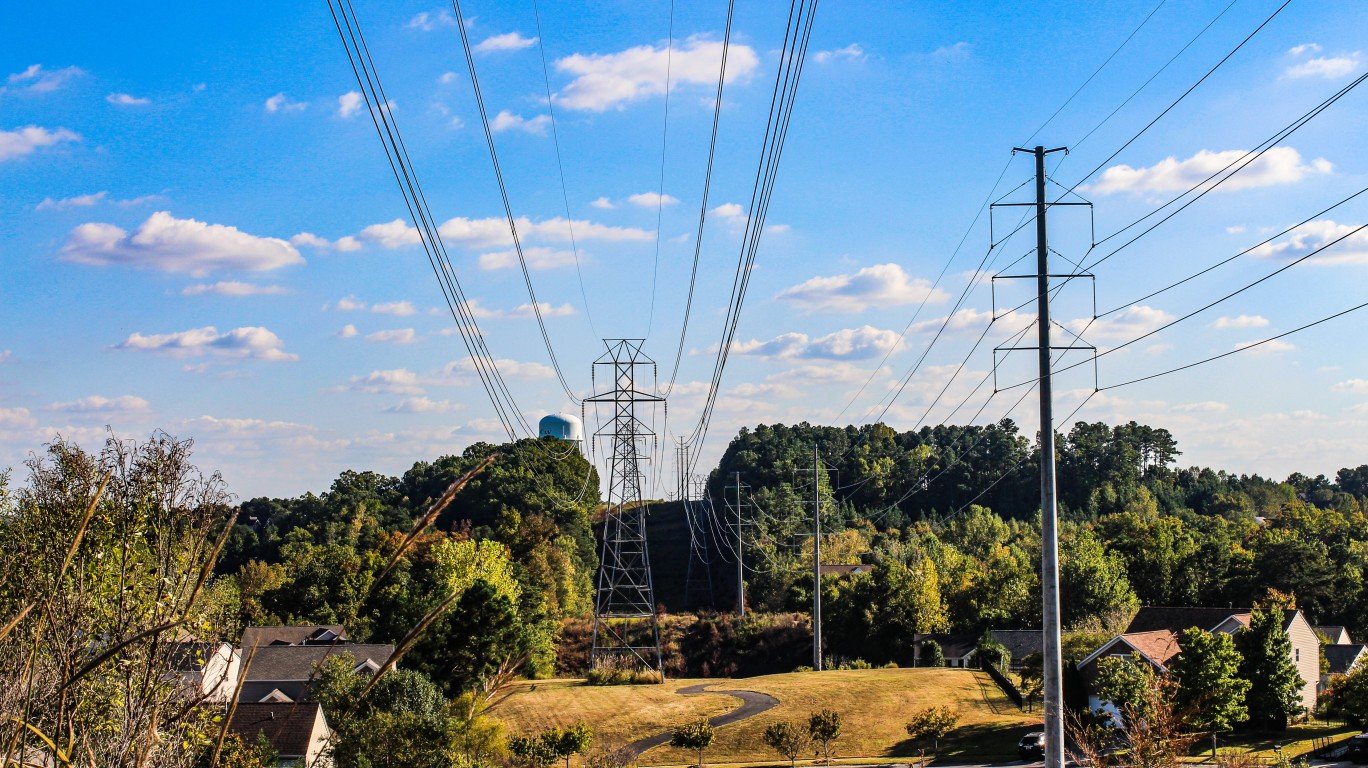
- Cash-Flow Stability: Utilities deliver essential services, so demand for water and electricity is effectively constant. The rapid build-out of AI data centers is layering an additional surge of demand on top of that baseline in many municipalities, a trend examined further below.
- Dividend Yield: VPU’s 2.52% dividend yield has remained broadly stable. Over the past five years, the quarterly payout per share has ranged from a low of $0.95 to a high of $1.33, with an annual dividend of $5.09 per share and an overall dividend growth rate of 0.67%.
- Minimal Competition: The vast majority of the utilities held in VPU operate as regulated monopolies in the municipalities they serve, meaning competitive pressure on their revenue base is minimal.
Beating the S&P 500 During Recessions

During recessions, VPU has outpaced the S&P 500 on multiple occasions since 2007.
VPU will never match the eye-catching annual gains of the Magnificent Seven tech giants that have powered the S&P 500’s bull runs. Its core appeal is something more durable: in each of the three recessions it has been alive to face, VPU has beaten the S&P 500 when the index fell hardest.
The 2007-2008 subprime mortgage crisis rocked virtually every asset class, but the S&P 500 absorbed a particularly sharp blow. The index managed a slim +3.53% in 2007 before collapsing to -38.49% in 2008. VPU returned +16.73% in 2007 and, while it also declined in 2008, its -27.94% loss was roughly 10 percentage points shallower than the S&P 500’s worst year of that cycle.
The Covid-19 pandemic period tells a different story. Going into the uncertainty of late 2019, investors rotated heavily into defensive sectors, lifting VPU to an exceptional +24.87% for the full year, compared to the S&P 500’s +28.88%. When the pandemic struck in early 2020, the S&P 500 fell as much as 35% in a single month during the first quarter, then recovered sharply once the severity of the outbreak came into clearer view and finished the year at +16.26%. VPU, by contrast, ended 2020 nearly flat at -0.76% as defensive-rotation money flowed back into growth stocks. Over that combined 2019-2020 stretch, utilities investors gave up some upside in the recovery year but avoided the worst of the Q1 drawdown.
In 2022, with the Federal Reserve tightening aggressively to fight inflation, the S&P 500 closed the year at -19.44%. VPU again demonstrated its defensive character, finishing in positive territory at +1.04%. The fund then carried that momentum forward, gaining +23.06% in 2024 and +16.47% in 2025, demonstrating that utility stocks can generate meaningful returns even during calmer economic periods.
The AI Data Center Tailwind
The utilities sector has acquired a new and powerful demand driver in the form of artificial intelligence infrastructure. According to the International Energy Agency’s April 2026 update on energy and AI, global electricity consumption from data centers grew roughly 17% in 2025 to approximately 485 terawatt-hours, with AI-focused facilities expanding even faster. The IEA projects that figure will nearly double again to around 950 TWh by 2030, representing close to 3% of total global electricity demand. The largest technology companies were a central force behind that growth: their collective capital expenditure exceeded $400 billion in 2025 and is expected to jump by another 75% in 2026, according to the IEA.
The U.S. picture is especially striking. American data centers consumed 183 terawatt-hours of electricity in 2024, already representing more than 4% of the country’s total electricity output, according to IEA estimates cited by Pew Research Center. By 2030, U.S. data center electricity consumption is projected to grow 133% to 426 TWh. Water demand is rising in parallel, with AI data centers consuming roughly 264 billion gallons of water in 2025, according to Mordor Intelligence. For utilities that supply power and water to the regions hosting these facilities, the economics are straightforwardly positive: steady, contracted demand at scale, layered on top of an already reliable residential and commercial base. That structural tailwind gives VPU’s holdings a growth component that traditional utility investors rarely had reason to expect.
Editor’s note: This article was updated to correct VPU’s exchange listing to NYSEARCA, refresh net assets to $8.7 billion and the YTD return to 8.25%, update the holdings count to 75 securities, add the fund’s five largest positions, and incorporate the IEA’s April 2026 figures showing global data center electricity reached approximately 485 TWh in 2025 and tech-company capital expenditure exceeded $400 billion that year.
Contact [email protected] for any questions or corrections.