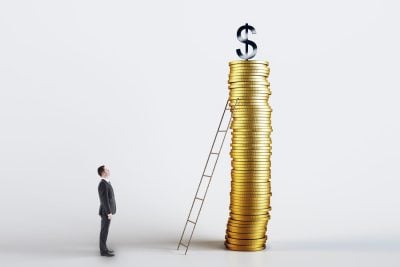
If you put $10,000 into Direxion Daily Gold Miners Index Bull 2X Shares (NYSEARCA:NUGT) at Friday’s open on June 5, 2026, you walked out of the close with about $8,300. The fund opened at $158.82 and finished the day at $131.39, a one-session loss of 17.27%, and it happened on a day when half the financial internet was telling you gold is a safe haven. The unleveraged cousin, VanEck Gold Miners ETF (NYSEARCA:GDX), fell 8.75% from $86.40 to $78.84 the same day. Gold bullion itself dropped 3.27%. Three different numbers, one chain reaction, and a textbook illustration of what 2x daily leverage does when the underlying takes a real hit.
The Arithmetic Of A 2x Fund Sitting On Top Of Operating Leverage
NUGT promises 2x the daily return of the NYSE Arca Gold Miners Index, which is the same benchmark GDX tracks at 1x. So when GDX prints -8.75%, the mechanical expectation for NUGT is somewhere in the neighborhood of -17% to -18%, and -17.27% lands right in that pocket. The fund did exactly what the prospectus says it does.
Underneath GDX is a second layer of leverage that has nothing to do with derivatives. Gold miners are operationally levered to the gold price because their costs (labor, diesel, equipment, royalties) are largely fixed in the short run while their revenue moves directly with bullion. A 3.27% drop in gold running through a mining company’s income statement shows up as something closer to two or three times that, depending on the miner’s all-in sustaining cost. Stack a 2x ETF wrapper on top of that, and you have a product where a low-single-digit move in the metal becomes a high-double-digit move in the fund. Friday was the clean version of that math, with bullion down 3%-ish, miners down roughly 9%, and the leveraged miners fund down 17%.
Why Gold Fell On A Day That Looked Built For Gold
The catalyst was the May nonfarm payrolls print. The headline came in at 172,000 jobs versus a consensus of about 80,000, more than double expectations, which the BLS reported as a preliminary total payroll level of 159,001 thousand. A hot jobs report at this point in the cycle does one specific thing to the rates market. It pulls forward the probability that the Fed’s next move is a hike rather than a cut, and that repricing flows straight into the short end of the curve. The 2-year Treasury yield surged to 4.16%, a 16-month high, and the 10-year settled at 4.47%, near the upper end of its 12-month distribution at the 93.2 percentile rank.
Gold has one structural problem when real yields jump like that. It does not pay you anything to hold it. Every basis point that a Treasury offers is a basis point of opportunity cost for an ounce of bullion sitting in a vault. The relationship between real yields and gold is the core valuation equation for the metal, and Friday flipped the sign on it.
The dollar piled on. The DXY jumped 0.65%, which makes dollar-denominated bullion more expensive for every buyer outside the United States, suppressing global demand at exactly the moment American buyers were being offered a more attractive risk-free yield. Silver, which trades like a higher-beta gold proxy, fell 7.17%, confirming the move was about the whole precious metals complex repricing against rates, not a one-off in gold.
The Wider Damage And The Decay Problem
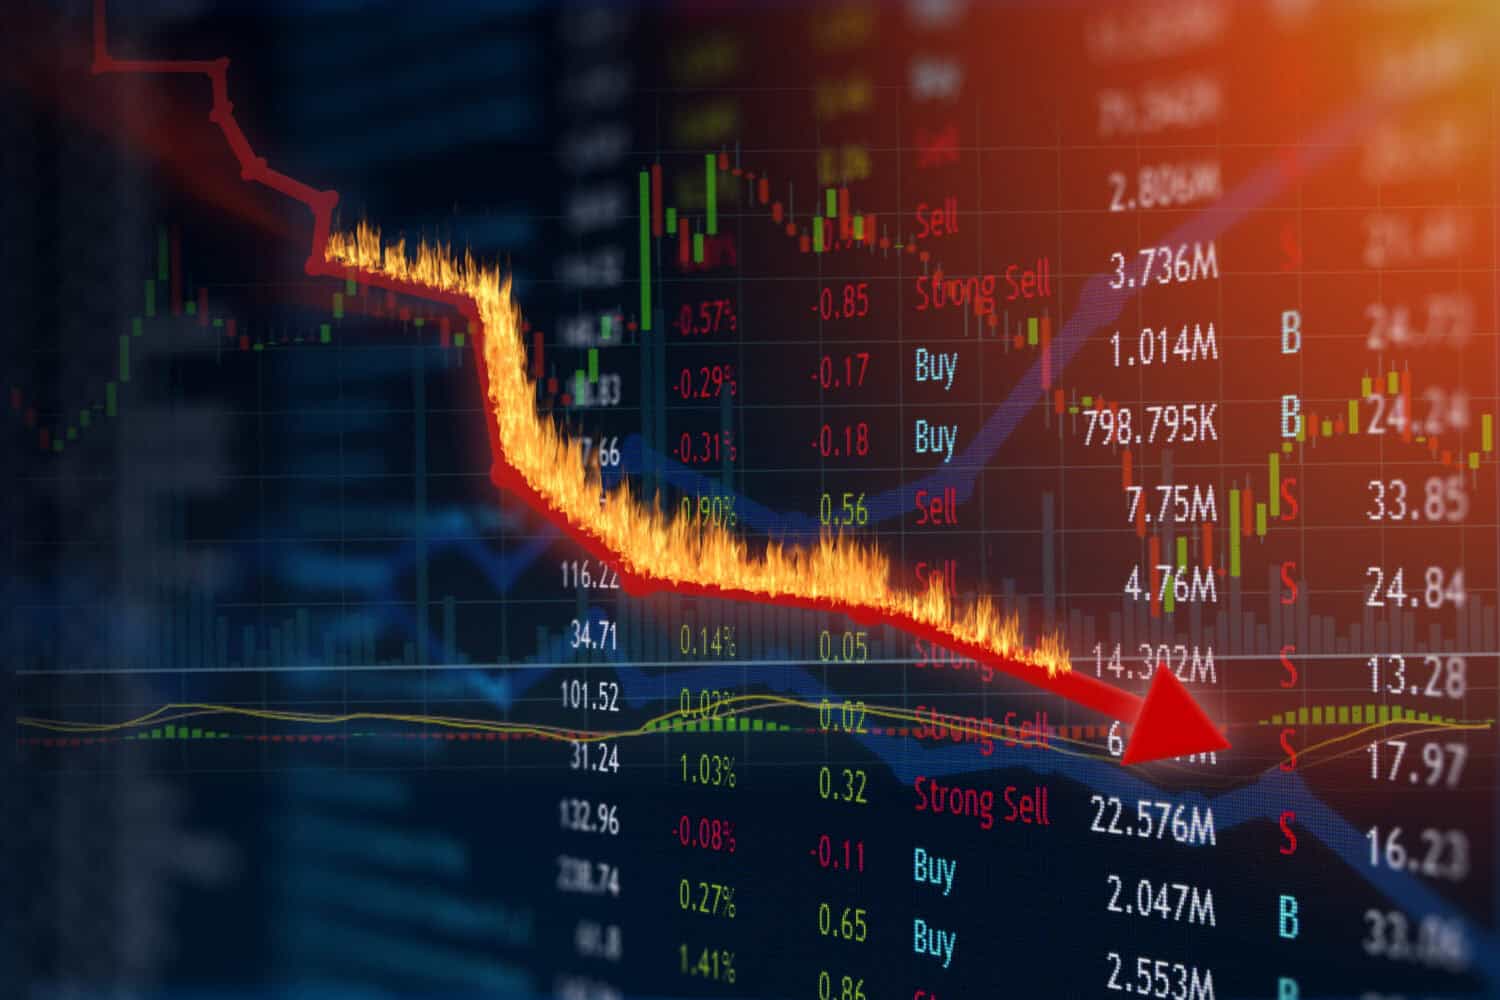
Friday was not an isolated event. NUGT is down 23% over the past week, 29% over the past month, and 28% year to date from a January 2026 start price of $183.50. GDX, the unleveraged version, is down only 8% year to date. That gap between -8% and -28% on the same underlying index is the volatility decay story that gets pasted onto every leveraged ETF disclaimer, and it is real. Daily resetting compounds against you whenever the path is choppy, and the path in gold miners over the last several weeks has been choppy.
The 10-year window makes the point even more starkly. NUGT is down 64% over 10 years, while GDX over the same window is up 246%. Same index, same direction, opposite outcomes. That is what a 2x daily product does to a holder who treats it like a long-term position rather than a short-duration trading vehicle.
What Would Have To Change For This To Reverse
The mechanism that crushed NUGT on Friday was a single data point pushing the front end of the curve higher, and that mechanism reverses on a single data point going the other way. Three specific things are worth watching.
- Fed commentary on the rate path. Goldman Sachs Asset Management’s 2026 outlook still anchored on the Fed cutting twice in 2026, given its stance on labor market weakness. Friday’s print does not kill that view, but it puts the burden of proof back on the doves. Listen for whether FOMC members start using the word "patience" again, or whether the next dot plot drifts hawkish.
- The World Gold Council’s monthly central bank purchase report. The structural bid under gold for the last 18 months has come from sovereign buyers, not Western ETF flows. If those purchases hold up through a higher-for-longer rate environment, the floor under bullion stays firmer than the rates math alone would suggest.
- Geopolitical tail risk, specifically US-Iran. Gold’s safe-haven bid is event-driven and episodic. Friday it was overwhelmed by the rates story. An escalation could flip that priority back inside a single session.
The honest read is that NUGT is doing exactly what it was designed to do, and the people holding it through this week are getting a real-time lesson in the difference between 2x daily exposure and 2x cumulative exposure. The setup that produced Friday’s 17.27% loss is a hot labor market colliding with a rates curve that had already priced in cuts. Until the labor data softens or a real risk-off catalyst arrives, the same mechanism stays loaded. Watch the 2-year yield. If it rolls back under 4%, the gold trade has room to breathe. If it pushes through the 4.67% mid-May 10-year peak on the long end, NUGT holders will get another day that looks like Friday.
Contact [email protected] for any questions or corrections.