If You’d Invested $10,000 In Exxon Mobil When The Iran Conflict Started, Here’s How Much You’d Have Now
The Iran conflict was supposed to be a gift for oil majors, yet Exxon Mobil did the opposite of what decades of war-trade instinct predicted. Here is what actually happened to investors who made the obvious bet.

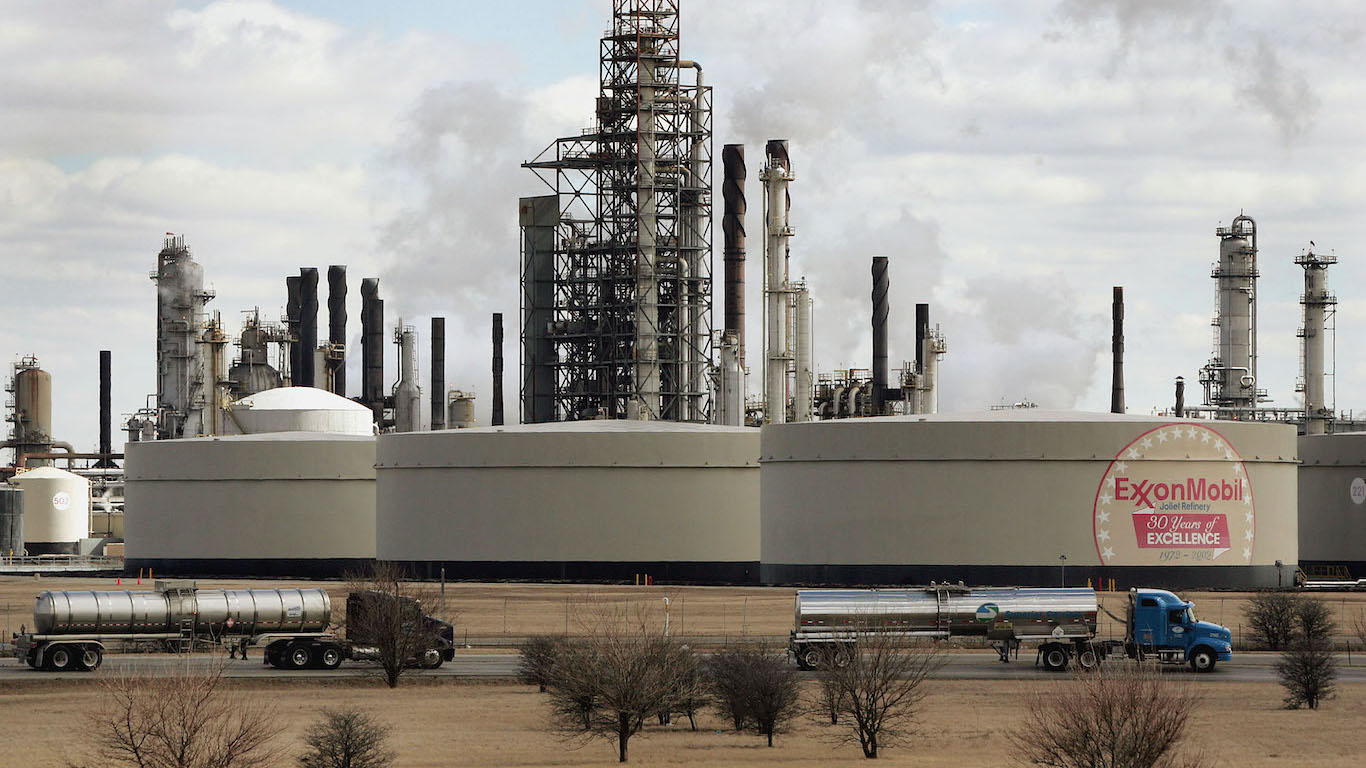
When the “War Equals Oil Spike” Playbook Broke
The reflex trade when a Middle East conflict flares up is simple: buy oil majors, watch them rip. Exxon Mobil (NYSE:XOM | XOM Price Prediction) was supposed to be the textbook beneficiary when the Iran conflict began on February 28, 2026. It did not work out that way.
The company itself had never looked stronger going in. Under CEO Darren Woods, Exxon leaned hard into advantaged barrels: Permian, Guyana, and LNG made up 59% of 2025 production, Guyana crossed 900,000 gross barrels/day, and the Permian hit a record 1.8M boed in Q4 2025. Q1 2026 adjusted EPS of $1.16 beat the $1.01 estimate, even as $706M in physical shipment losses tied to the Middle East hit results. Golden Pass LNG shipped its first export cargo in April 2026. Fundamentals were fine, yet the stock lagged.
A $10,000 Bet That Went Underwater
Because February 28, 2026 was a Saturday, the first tradeable session was March 2, 2026. Here is what $10,000 in XOM at that open would look like today, alongside the longer horizons every investor should see.
Since the Iran Conflict Began (March 2, 2026 to July 10, 2026)
- Initial Investment: $10,000
- XOM Start Price: $153.22
- XOM End Price: $138.88
- Total Return: -9.36% (a loss)
- S&P 500 (same window): positive, extending 2026 YTD gains of 10.71%
1-Year Return
- XOM: +24.67%
- S&P 500: +20.63%
5-Year Return
- XOM: +172.65%
- S&P 500: +73.34%
10-Year Return
- XOM: +125.88%
- S&P 500: +251.22%
The conflict-window loss defied the usual reflex. I will not pretend to know exactly why oil equities faded on war headlines this time. Broader energy names moved with it, which suggests a sector-wide “sell the news” episode rather than something XOM specific. WTI did spike, reaching $102.13/barrel in May 2026 before easing to $84.81 in June, yet the stock did not follow. XOM has bounced 1.31% in the week ending July 10, 2026, but remains underwater over the full conflict window.
I’d Buy It Here, With One Caveat
Exxon looks compelling for investors seeking a durable dividend compounder with real cost discipline: 43 straight years of dividend growth, a 2.94% yield, $15.60B in structural cost savings since 2019, and a $20B buyback plan for 2026. The forward P/E of 13 and analyst target of $167.38 suggest room to run.
XOM looks less compelling for investors who need it to beat the market. The 10-year 125.88% return trailed the S&P badly, and geopolitical shocks clearly do not translate to reliable upside anymore. If crude rolls back toward the $57.97 lows of December 2025, earnings power compresses fast.
At this level, XOM earns its slot for income and downside protection. I’d put $1,000 into Exxon today if I want a defensive energy anchor. Investors seeking growth may find better options elsewhere.
Contact [email protected] for any questions or corrections.
I've spent more than 15 years inside enterprise software, working alongside the finance, sales operations, and HR leaders who run the revenue engines at some of the largest tech companies in the country.
My day job is helping enterprise executives make smarter decisions about retention, compensation, and growth. These are the same operational levers that show up in every earnings report investors actually read. That perspective shapes my writing for 24/7 Wall St.
The headline numbers are easy. The interesting stuff is underneath: how companies make money, what executives are worried about, and what any of it means for the person checking their 401(k) on a Sunday afternoon. I write about personal finance and business as someone who has spent her career inside the rooms where these decisions get made.