Wall Street Is Betting P&G’s Dividend Growth Ends. The Cash Flow Suggests That’s Not Happening
Procter & Gamble just logged its 70th consecutive dividend increase, yet Wall Street has turned skeptical, pointing to tariff costs, margin compression, and guidance at the lower end of its range. The cash flow statement is telling a completely different…

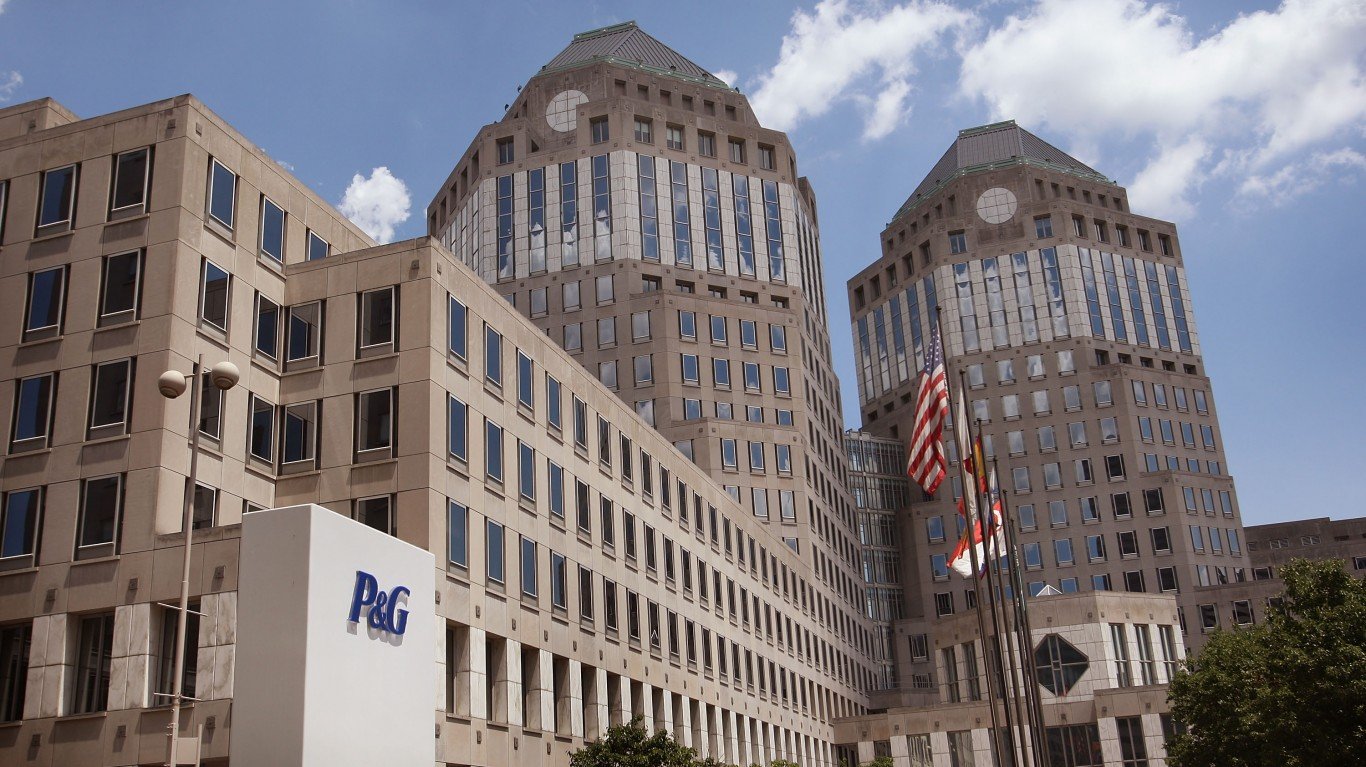
When Procter & Gamble (NYSE:PG | PG Price Prediction) cut its 70th consecutive annual dividend increase check to shareholders this past May, it sent out $1.08 per share. The market shrugged. With shares down around 5% over the past year and the stock changing hands at $145.79, sentiment around this Dividend King has soured on tariff fears and a guidance bias toward the lower end of the range. The cash flow statement tells a different story.
The Payment That Wall Street Underestimated
P&G announced the most recent quarterly dividend at a 3% increase, marking the 136th consecutive year P&G has paid a dividend since incorporation in 1890. The forward annualized payout sits at $4.227 per share, translating to a current yield of 3%. That yield doesn’t scream opportunity, but the durability behind it does.
Here’s the disconnect. P&G beat Q3 FY2026 earnings on both lines: core EPS of $1.59 against $1.5552 expected (+2%) and net sales of $21.235 billion versus $20.517 billion expected (+4%). Yet management signaled FY2026 results toward the lower end of the $6.83 to $7.09 core EPS range, citing ~$400 million in after-tax tariff costs, ~$150 million in commodity headwinds, and ~$250 million from higher interest expense and tax rate. Investors heard “headwinds” and stopped listening.
Reading the Cash Flow Statement
The dividend skepticism collapses against the actual numbers. In Q3 FY2026, P&G generated operating cash flow of $4.045 billion, up 9% year over year, and free cash flow of $3.026 billion, up 6%. Cash and equivalents on the balance sheet swelled to $12.306 billion, a 35% jump year over year.
Step back to the full-year view and the cushion gets wider. FY2025 delivered $17.818 billion in operating cash flow against $9.872 billion in dividends paid, a coverage ratio of 1.80x. Free cash flow of $14.045 billion covered the dividend with $4 billion to spare, and the company still funded $6.5 billion in share repurchases. Management guides FY2026 adjusted free cash flow productivity to 85% to 90%, with about $10 billion expected in dividend payouts and ~$5 billion in buybacks.
The Dividend Growth Track Record
The historical record is what separates this dividend from speculative income plays. The Alpha Vantage payment history walks all the way back:
| Year | Q1 Dividend | Subsequent Quarters |
|---|---|---|
| 2026 | $1.0568 | $1.0885 |
| 2025 | $1.0065 | $1.0568 |
| 2024 | $0.9407 | $1.0065 |
| 2021 | $0.7907 | $0.8698 |
| 2016 | $0.6629 | $0.6695 |
| 2009 | $0.40 | $0.44 |
| 1999 | $0.285 | $0.32 |
P&G raised its dividend through the 2008-2009 Financial Crisis and through the 2020 COVID-19 pandemic. The annual payout growth rate has averaged +6.0% in FY2025, +3.5% in FY2024 and +2.6% in FY2023. The current 3% increase falls right inside that recent range.

What the Bears Are Missing
Wall Street’s hesitation is logical on the surface. Core gross margin compressed 100 basis points in Q3, currency-neutral core EPS was flat year over year, and the geopolitical math is ugly. CFO Andre Schulten quantified the Brent crude exposure plainly: at roughly $100 a barrel, the annual cost impact climbs to ~$1.3 billion before tax (~$1 billion after tax) compared with pre-conflict oil in the mid-60s. Analyst skepticism centers on whether P&G can price through this without ceding share.
The growth side keeps answering that question. Organic sales rose more than 3% in Q3 with all 10 product categories and all 7 regions growing organic sales. Beauty led with 11% revenue growth. SK-II grew 18% globally with China up 13%, and Greater China Baby Care expanded 19%. Schulten’s framing on pricing strategy was direct: “I don’t think we’ve lost pricing power. Pricing power has to be earned, and the way to earn it is to combine pricing with a truly delightful experience for the consumer.”

The Dividend Scorecard
Stack the metrics that matter for dividend sustainability:
- Yield: 3%, modest but reliable
- Consecutive annual increases: 70 years
- Cash flow coverage: 1.80x operating cash flow in FY2025
- FCF payout ratio: 70% of free cash flow in FY2025
- YoY dividend growth: +6% in FY2025
- FY2026 capital return commitment: ~$15 billion combined dividends and buybacks
This earns a solid B+ on the scorecard. The yield is modest and the payout ratio against free cash flow has crept higher as buybacks compete for capital, yet the cash generation engine and the 70-year history make a dividend cut a remote scenario. Coverage at 1.80x leaves room for the FY2026 cost headwinds to land hard and the dividend still gets paid.
What to Watch Next

The forward signal sits on Brent crude and tariff resolution. The current FY2026 guidance assumes commodity prices and FX rates hold at current levels, and the CFO flagged that almost all of the increased Middle East-related costs are expected in Q4 FY2026. If oil normalizes, the lower-end guidance bias flips toward the upper end and the cash flow cushion gets even thicker. If oil holds elevated into FY2027, productivity offsets and selective innovation pricing have to do more work. Schulten was explicit: “The one thing we will not compromise on is the investment in the parts of the business that are showing momentum.”
Wall Street’s analyst tally lands at five Strong Buy ratings, nine Buy ratings, 10 Hold ratings and zero Sell ratings alongside a $163.52 average target. Retail investors on the dividend-focused side of Reddit have stayed bullish, with sentiment readings of 72 in early June and 70 in late May. The crowd that focuses on dividends has read the same cash flow statement and reached the same conclusion: the streak isn’t ending here.
Contact [email protected] for any questions or corrections.
Joel South covers large-cap stocks, dividend investing, and major market trends, with a focus on earnings analysis, valuation, and turning complex data into actionable insights for investors.
He brings more than 15 years of experience as an investor and financial journalist, including 12 years at The Motley Fool, where he served as an investment analyst, Bureau Chief, and later led the Fool.com investing news desk. He has also co-hosted an investing podcast and appeared across TV and radio discussing market trends.