




At $259.20, Nebius Group (NASDAQ:NBIS | NBIS Price Prediction) trades above Street consensus. The case for patience strengthened when the stock gapped +34.14% in a single session on the Q2 earnings report. Chasing a vertical spike into a name that has already tripled year to date rarely rewards latecomers.
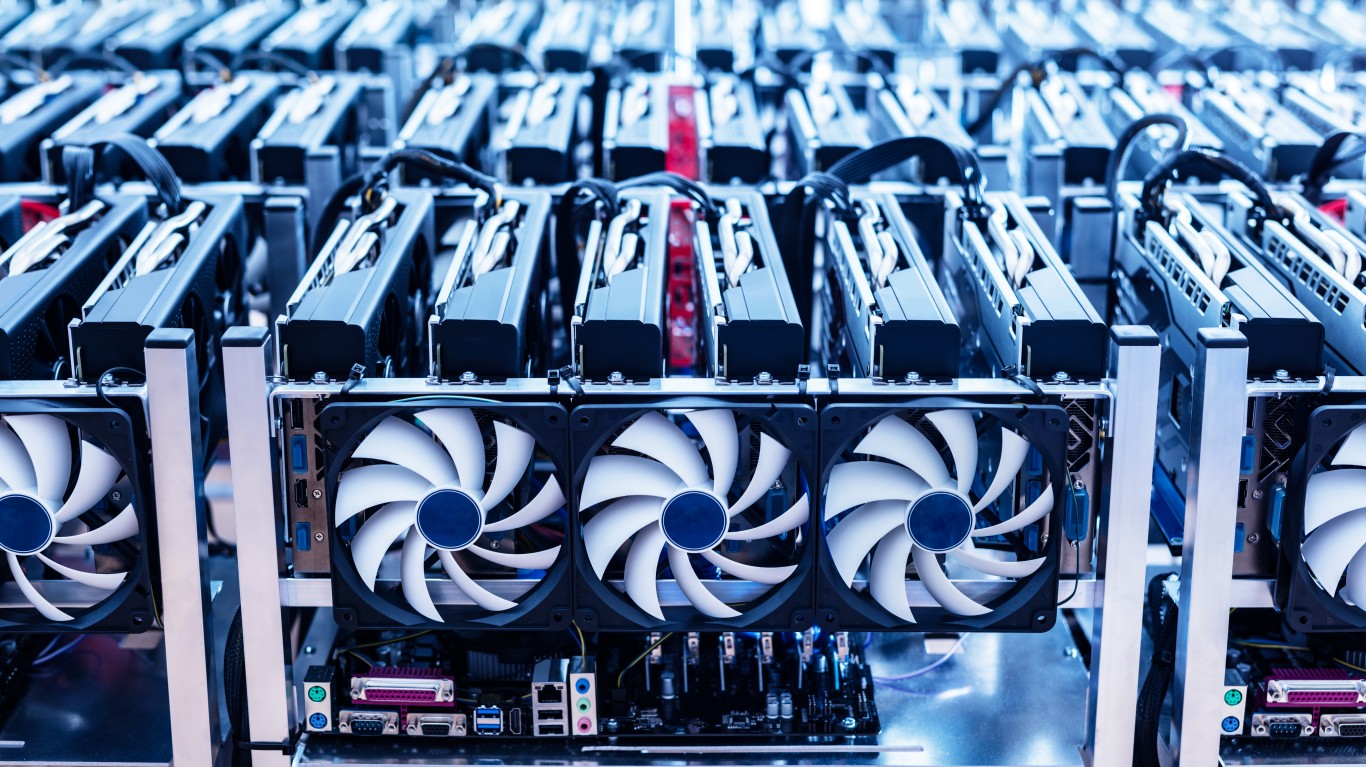
Nebius runs an AI cloud business renting GPU capacity to hyperscalers and enterprises. The Nebius AI Cloud segment generated $574.90 million of Q2 revenue and posted 514% YoY growth. The company also holds TripleTen (edtech), Avride (autonomous delivery), Toloka, and a strategic stake in ClickHouse.
The stock moved from roughly $83.71 at year-end 2025 to $259.20 on hyperscaler contracts, an NVIDIA equity investment, and a Q2 beat that vaporized short positioning. That trajectory makes the entry question difficult.
Why the Bulls See Room to Run
Growth is the entire story, and it is real. Q2 revenue landed at $582.30 million, up 454% YoY, with adjusted EBITDA in the cloud segment swinging to $285.70 million from $9.50 million a year earlier. Cost of revenue compressed to 23% of sales, showing operating leverage is arriving.
The backlog is the key stat. Remaining performance obligations sit at $37.49 billion, anchored by a second $27 billion Meta agreement and a Microsoft deal valued between $17.40 billion and $19.40 billion. Management reaffirmed $3.00 billion to $3.40 billion in 2026 revenue and an ARR exit run-rate of $7 billion to $9 billion, with contracted power raised to above 4 GW.
Why the Bears Are Sharpening Knives
Nebius is deeply unprofitable on GAAP, with a Q2 net loss of $190.40 million and interest expense exploding to $119.10 million from $4.80 million a year prior. Capex hit $8.13 billion in the first half alone.
Financing risk stands out. Convertible debt carries a fair value of $20.80 billion against an $8.50 billion carrying value, plus $12.10 billion in uncommenced lease obligations and $5.30 billion in energy commitments. Three customers account for 59% of revenue, and Meta is building competing capacity. At a P/S of 55.88, the market has priced in flawless execution.
Why Waiting Beats Chasing
History says post-beat euphoria fades. After the Q1 2026 beat, Nebius rallied then fell -7.45% the following week before recovering +25.47% over thirty days. Buyers who waited for the pullback captured the trend without eating the peak.
Reddit sentiment peaked at 88 on August 7 and 8, before the surge, then dipped to 72 on August 12 despite the 34% move. That divergence, plus a rising put/call ratio into 2.73 for December expiry, suggests professionals are hedging.
What the Numbers Show
Nebius trades at $259.20 against an analyst consensus target of $250.75. That implies the stock is trading roughly $8 above Street consensus. Coverage runs 17 analysts deep:
- Strong Buy: 1
- Buy: 10
- Hold: 5
- Strong Sell: 1
Year to date, Nebius is up 209.66% versus 13.28% for the S&P 500. Over one year, the stock gained 244.09% against 20.20% for the index. Trailing P/E stands at 71, forward P/E at 68.
The Verdict: Let the Chart Come to You
At $259.20, Nebius trades at a premium to fair-value estimates. The business is executing, though the entry point looks stretched. Consensus target sits below current price, the stock is 18.36% above where it traded a week ago, and the last gap-up on a beat gave back -7.45% within seven trading days. A dollar-cost-averaging entry over several weeks, or patience toward the 50-day moving average near $221.93, offers better risk/reward than chasing.
Watch Q3 for ARR progress toward the $7 billion to $9 billion exit target, cash burn against the $8.04 billion cash pile, and signals that customer concentration eases below the current 59% top-three share. A pullback into the low $200s with RPO conversion on track would materially improve the risk/reward. A dilutive raise or Meta insourcing headline would meaningfully weaken the thesis.
Nebius is a high-growth business trading at a stretched price. The market rarely punishes patience in a name growing revenue 454% a year.
Contact [email protected] for any questions or corrections.












 Top Gaining Stocks
 Top Losing Stocks