





Wall Street’s $1.5 Trillion Trade Reaches Regular Brokerage Accounts
Private credit has grown into an asset class that now rivals high-yield bonds, with direct lending, middle market loans, and collateralized loan structures moving trillions of dollars outside the traditional banking system. For years, that trade lived inside interval funds, institutional partnerships, and business development company private placements. Three exchange-traded funds now put versions of the same exposure on an ordinary brokerage screen: VanEck BDC Income ETF (NYSEARCA:BIZD), Putnam BDC Income ETF (NYSEARCA:PBDC), and BondBloxx Private Credit CLO ETF (NASDAQ:PCMM).
Distributions on the two equity-side BDC funds run near 11%, while the CLO fund pays a lower single-digit yield in exchange for a senior position in the capital structure. The Fed Funds target rate sits near 4% and the 10-year Treasury near 5%, keeping floating-rate private loans priced above most public credit alternatives.
BIZD: The Benchmark BDC Ticker
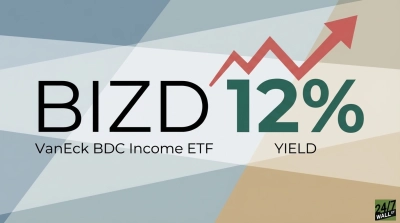
The portfolio concentrates in Ares Capital at 14.32%, Blue Owl Capital at 5.79%, and Main Street Capital at 5.45%. One manager, Ares, drives a large share of the daily move. The distribution yield runs at 11.8% on trailing dividends of $1.52 per share.
The gross expense ratio looks high on paper because acquired fund fees from the underlying BDCs pass through under SEC disclosure rules, which inflates the reported number even though the operating fee paid to VanEck is a fraction of that figure. Recent results have been mixed: year-to-date is roughly flat, one-year total return is down about 6%, and the ten-year return sits above 112% cumulative. The Q2 2026 distribution of $0.2391 came in below the $0.4818 payment from Q1, so the headline yield reflects a variable payout rather than a fixed coupon.
PBDC: Active Selection Inside the Same Universe
The top ten positions represent about 71.7% of assets, with Ares Capital at 11.91%, Blue Owl Technology Finance at 10.22%, and Blue Owl Capital at 7.67%. Combined Blue Owl exposure tilts the book toward that platform’s software and technology lending. The net expense ratio is 0.13% on the current fact sheet, materially different from the gross number, which includes underlying fund fees.
Distributions have been quarterly, with 2026 payments of $0.696 in July and $0.71273 in April, producing a headline yield near 10.8% at recent prices around $28. The one-year total return is down roughly 5%, while the five-year cumulative return sits above 66%. The tradeoff is manager risk: active BDC selection only wins if the picks outperform the index across a full credit cycle.
PCMM: Private Credit Without the BDC Equity
The fund launched on Nasdaq on December 2, 2024, and carries a 0.68% expense ratio with roughly $199.59 million in assets. Distributions are monthly and steady, with the August 2026 payment at $0.25592 and the July 2026 payment at $0.25549. Shares trade near $50 within a tight 52-week range of $48.86 to $51.09.
The return mechanism differs from that of the two BDC funds. CLO tranches sit senior to equity in a structured deal, so yields are lower, but price volatility is flatter. YTD is up about 3%, and the one-year return is up about 4%, reflecting that lower risk profile. Complexity is the trade-off. Retail investors get less transparency into individual borrowers, and tranche performance depends on default rates in the underlying private loan pool.
Matching the Fund to the Investor
Income maximizers seeking the largest distribution and the deepest secondary market liquidity find BIZD the natural home. It carries the highest headline yield on the list, the longest track record, and the broadest BDC representation, at the cost of quarterly distribution swings and full exposure to BDC equity volatility.
For investors who want the BDC equity trade with active selection and a cleaner expense profile, this fund is a good fit. It works for readers who believe a manager’s skill can add value in a sector where BDC results vary by credit book quality, sponsor relationships, and origination discipline.
The buyer who wants private credit exposure without owning the lenders is addressed by the other fund. Debt-side CLO tranches produce a distribution nearer 6% but sit higher in the capital structure than BDC equity, which changes how the position behaves in a downturn. Monthly rather than quarterly payments also fit income investors who plan cash flow month to month.
Contact [email protected] for any questions or corrections.












 Top Gaining Stocks
 Top Losing Stocks