Silver Has Now Lost Nearly Half Its Value. Here’s What Broke the Metals Trade
Silver just recorded one of its worst stretches in decades, and the forces behind the selloff are still building pressure. Understanding what broke the metals trade could be the difference between catching a bounce and holding through another leg down.

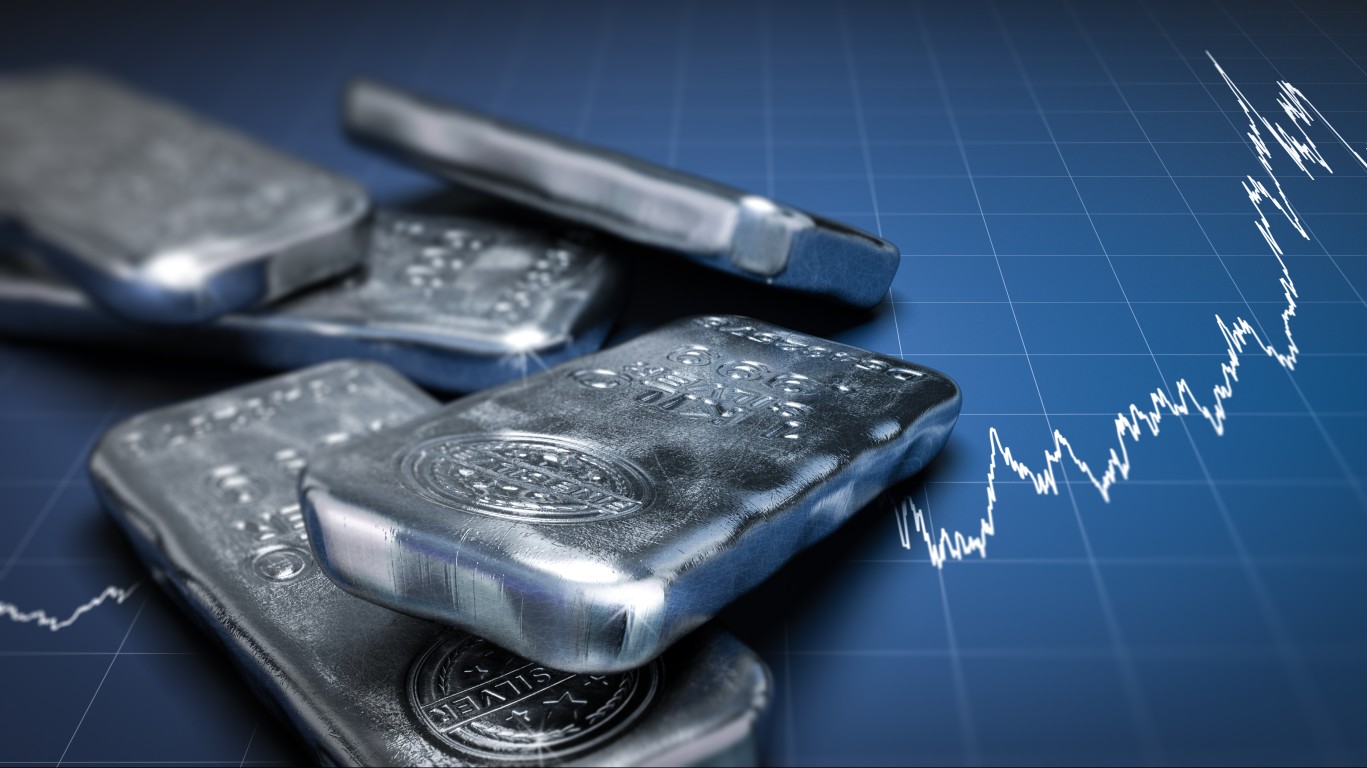
iShares Silver Trust (NYSEARCA:SLV) closed at $54.95 on Monday, down 5.49% from a prior close of $58.14. That leaves the fund 49.97% below its 52-week high of $109.83.
Nearly half the value is gone. Yet anyone who bought SLV a year ago still holds a 31.27% gain, and the five-year return stands at 175.44%.
The drawdown shows how fast silver fell, while the one-year gain shows how far it ran first. The year-to-date loss of 14.7% sits between them because silver set its record weeks after the year began.
SLV holds physical silver bullion and manages $32.1 billion in assets. It has no operating business and no cash flow to cushion a drawdown, so the fund tracks the metal price minus a 0.50% expense ratio, which puts every question back on silver: what broke the trade, and whether those forces are fading.
Silver’s Unwind Began With a Record Crash in January
Silver hit an all-time high of $121.67 an ounce on Jan. 29.
The next day it dropped 30% during one session, its worst day since 1980.
Monday extended the unwind that began then. December silver futures settled at $61.72, down 4.76%, at its lowest level since Aug. 7.
Spot silver traded at about $61.02 an ounce. Monday was the latest leg of a correction that started in January.
Oil, the Fed and a 19-Year Yield High Broke the Metals Trade
Oil rose after US and Iran talks stalled over the Strait of Hormuz, with WTI crude reaching $107.02 a barrel before falling to $96.41.
Higher oil revived inflation fears, so traders lifted the odds of an October Fed hike to about 68% to 70%.
The Fed had already raised rates on Sept. 16, leaving the target range at 3.75%-4.00%. Markets now price in about 94% odds of another hike by December.
The 10-year Treasury yield reached a 19-year high, most recently 5.17%, and the dollar strengthened. Silver pays no income, so both moves hit it directly.
USAGOLD called the selloff “a purely macro, paper-market repricing.” A calm VIX of 14.21 supports that read.
Why Silver Fell Harder Than Gold
SLV fell 5.49% on Monday, while SPDR Gold Shares (NYSEARCA:GLD) dropped 3.94%. The same macro shock produced a bigger move in silver.
Silver trades in a smaller, thinner market than gold, so selling pushes its price further. It also carries industrial demand on top of its monetary role.
That industrial leg is cyclical. A rate path aimed at slowing the economy dampens factory demand, and higher yields hurt the monetary case.
Gold miners fell too, with VanEck Gold Miners ETF (NYSEARCA:GDX) down 5.36% at $87.89. That marks this as a repricing across the whole precious metals complex.
BMO Turned Cautious on Months but Constructive on Years
BMO cut its fourth-quarter silver forecast to $67.40 an ounce from $71.40. At the same time, it raised its long-term forecast to $47 from $36.
The bank expects rates to pressure silver in the near term, yet it sees higher long-run prices than before.
Compare each number with spot at about $61.02. The fourth-quarter call sits above today’s price, but even the raised long-term forecast sits well below it.
For a buyer today, that implies room for a year-end bounce within a longer downtrend, although bank forecasts shift with every Fed meeting.
Should You Buy or Sell SLV ETF
The evidence leans bearish on SLV at these levels.
What would reverse this trade is a shift in rate expectations, and with December hike odds near 94%, that shift hasn’t arrived yet.
The bullish thesis deserves respect. BMO’s $67.40 fourth-quarter target sits above spot, and a milder inflation reading could quickly pull hike odds down.
But SLV has no cash flow to fall back on, and its 0.50% fee drains a holding that pays nothing. A 30% single-day drop this year is reason enough to keep any silver position small.
If you still want precious metals exposure while rates rise, GLD held up better on Monday. Holders sitting on a 31.27% one-year gain retain a cushion even after the drawdown.
Contact [email protected] for any questions or corrections.
Omor Ibne Ehsan is a writer at 24/7 Wall St. He is a self-taught investor with a focus on growth, cyclical, and dividend equities that have strong fundamentals, value, and long-term potential. He also has an interest in high-risk, high-reward investments such as penny stocks.