5 Hidden Dividend Stocks With Payout Records That Put Bigger Names to Shame
Two of these obscure dividend stocks have raised their payouts for 56 straight years, longer than most household names, yet they trade at a fraction of the attention. The other three throw off yields above 5% with coverage numbers that…

This post may contain links from our sponsors and affiliates, and Flywheel Publishing may receive compensation for actions taken through them.

Most income investors crowd into the same few mega-cap dividend names. That leaves smaller payers with long records trading in relative quiet. A Rapid City utility, a Portland gas distributor, a Richmond tobacco merchant, a lower-middle-market lender and a Kansas City landlord for ski resorts and attractions rarely lead the financial news. Yet two of them, Black Hills (NYSE:BKH | BKH Price Prediction) and Universal (NYSE:UVV), have each raised their dividends for 56 consecutive years. Each section below checks dividend safety first, then turns the live yield into annual income on a fixed stake.
Black Hills
At $76.29, Black Hills’ annualized forward dividend of $2.812 works out to a 3.69% yield. A $50,000 position pays about $1,842.97 a year.
Dividend safety: The payout comes to 70.83% of trailing EPS of $3.97. Against the midpoint of 2026 adjusted EPS guidance ($4.25 to $4.45), it drops to 64.64%, which is comfortable for a regulated utility. In 2025, operating cash flow reached $673.4 million against $197.9 million in dividends. Capital spending of $819.8 million was higher than operating cash flow, so outside capital funds part of the grid build-out, as it does at most utilities. The record backs up management’s streak claim. The quarterly payout rose from $0.26 in 1999 to $0.703 today, with a step-up every year in between.
Bull case: Black Hills has a data center pipeline of more than 3 GW in Wyoming, and management is targeting the upper half of 4% to 6% long-term EPS growth. Q2 adjusted EPS of $0.54 beat the $0.41 estimate, and the stock trades at a forward P/E of 15. Investors have noticed: shares are up 28.31% over the past year.
Risk: A pending merger with another regional utility still needs Montana regulatory approval. That leaves deal terms and timing open.
Northwest Natural
Northwest Natural (NYSE:NWN) pays $1.97 a year. At $48.13, that is a 4.09% yield, and $50,000 generates roughly $2,046.54 annually.
Dividend safety: The dividend uses 65.45% of trailing EPS of $3.01. Management now expects the upper half of its $2.95 to $3.15 guidance range. Cash flow is tighter. Operating cash flow of $269.1 million in 2025 fell short of $466.9 million in capital spending, and financing inflows of $532.9 million made up the difference. The dividend record goes back to 1999. It shows small annual increases every year from 2019 through 2025, from $0.475 to $0.4925 a quarter. Expect slow growth on a steady base.
Bull case: SiEnergy’s customer growth in Texas and a newly effective $20.1 million Washington rate increase support earnings. The MX3 gas storage project raises the long-term EPS growth target to 5% to 7%. With a beta of 0.392 and a forward P/E of 14, this is a low-volatility income holding.
Risk: The balance sheet is thinner than a year ago. Cash fell from $102.6 million to $24.2 million, and the equity ratio slipped to 37.3%.
Universal
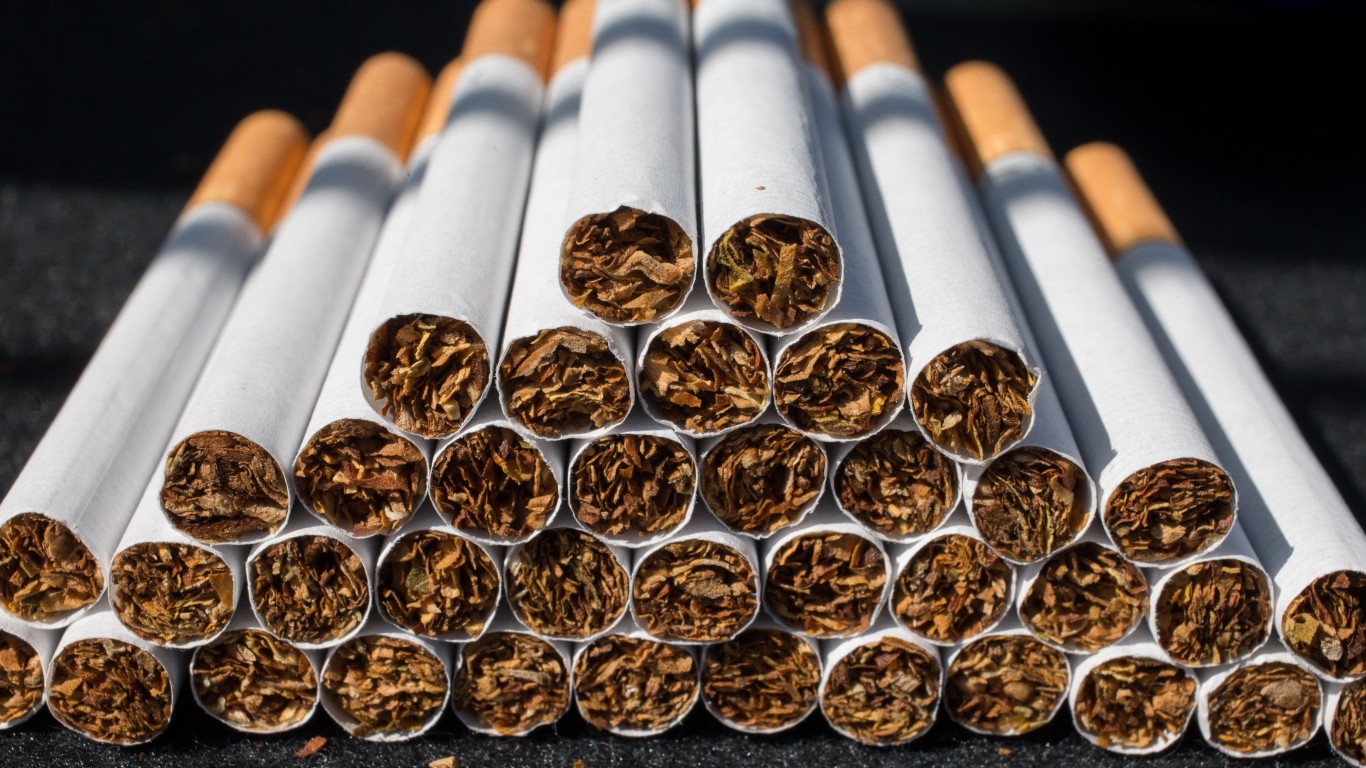
Universal is the ultra-high-yield name here. Its $3.32 annualized dividend yields 7.83% at $42.40. A $50,000 stake would pay about $3,915.09 a year.
Dividend safety: Coverage on earnings is stretched. Fiscal 2026 EPS of $2.64 covered only part of the dividend, a payout of 125.76%, and trailing EPS has fallen to $0.76. Cash flow tells a better story. Fiscal 2026 operating cash flow of $129.1 million, minus $48.8 million of capex, left $80.3 million, nearly matching the $81.3 million paid in dividends. Large swings in inventory make quarterly cash flow volatile. The stock trades at 0.779 times book value of $55.69 per share. The company calls its latest raise the 56th consecutive year of increases, and the record agrees: the quarterly payout climbed every year from $0.30 in 1999 to $0.83.
Bull case: The forward P/E of 12 sits far below the trailing 57, which means the market expects earnings to recover. Management expects tobacco shipments to land in the back half of fiscal 2027. Shares are down 17.08% over the past year, which pushed the yield up.
Risk: Flue-cured and burley tobacco are oversupplied, and uncommitted inventory stands at 27%, above the company’s target. That pressures margins. Tobacco operating income fell 90% in the latest quarter.
Main Street Capital
Main Street Capital (NYSE:MAIN) pays $0.265 a month. At $54.18, that is a high-yield 5.87% on regular payments alone. On $50,000, regular dividends come to roughly $2,934.66 a year. Including supplementals, the trailing 12-month total of $4.33 lifts that figure to about $3,995.94.
Dividend safety: Q2 adjusted EPS of $1.04 beat the $0.96 estimate and was well above the current quarter’s regular payments of $0.795. Operating cash flow of $347.4 million in 2025 covered $339.3 million in dividends. Credit quality looks clean: non-accruals are 1.1% at fair value, and aggregate liquidity totals $1.15 billion. The company has raised its regular monthly dividend 12 times since Q4 2021. It has also paid 20 consecutive quarterly supplemental dividends, and its distribution record runs back to 2007.
Bull case: NAV per share rose to $33.92 from $33.46, and annualized ROE reached 18.9%. Over 10 years, the share price is up 238.41%. Income arrives monthly, which suits retirees budgeting around a regular check (we rounded up seven more payers on the same 30-day schedule in a free report here).
Risk: Falling benchmark rates squeeze income on floating-rate loans. That could slow future raises or shrink the supplementals. The stock also trades at 1.542 times book, a premium that leaves little cushion if income falls.
EPR Properties
EPR Properties (NYSE:EPR) pays $0.31 a month, or $3.72 a year. At $54.54, that is an ultra-high-yield 6.82%. A $50,000 position would pay about $3,410.34 a year.
Dividend safety: Q2 AFFO of $1.43 per share easily covered quarterly dividends of $0.93. The annual dividend equals 67.76% of the midpoint of raised 2026 FFOAA guidance ($5.41 to $5.57). Operating cash flow of $421.0 million in 2025 covered $290.7 million in dividends. The portfolio is 99% leased or operated, with a 2.0x coverage ratio. Leverage is rising: debt-to-total-assets reached 54%, up from 50%, and net debt is 5.3x Adjusted EBITDAre. The track record also has a break. Payments stopped after April 2020 and resumed in July 2021. Since then the payout has climbed from $0.25, including a 5.1% raise this year.
Bull case: Q2 FFOAA per share grew 12.7%, and the company put $440.8 million to work at an initial cash yield of about 8.5%. Those deals add rent from attractions to a portfolio that is shrinking its theatre exposure.
Risk: Tenant concentration. EPR’s two largest tenants each produced 13.1% of Q2 revenue, so trouble at either one would hit cash flow quickly.
What These Five Payers Share
The two utilities pay below 5%, with modest payout ratios and decades of annual raises behind them. Main Street and EPR pay monthly and cover their dividends with earnings and AFFO. Universal pays the most, but it also asks the most of an investor’s patience while the tobacco cycle is in the process of working itself out. Together they show the most income going to investors who check coverage before they look at the yield.
Contact [email protected] for any questions or corrections.
Chris Lange is a financial and geopolitical writer with more than a decade of experience covering a myriad of topics. He has published thousands of articles for 24/7 Wall St., with past coverage focused heavily on stocks, IPOs, healthcare, defense, global affairs, and technology.
His work has been quoted, or referenced by a number of outlets including Business Insider, USA Today, Yahoo Finance, MSN, The Motley Fool, and many other publications. A graduate of Southwestern University, he studied business with a focus on investments and has previous experience in banking and startups.
When not reading or writing the news, he is following his passion for Lacrosse, playing chess, or building solar projects with his dad.