3 Dividend Aristocrats With the Highest Yields That Cash Flow Still Covers
Not every Dividend Aristocrat funds its payout with real cash, and the gap between a long streak and a safe one can cost income investors dearly. Three names on the roster clear both hurdles, but their yields, coverage ratios, and…

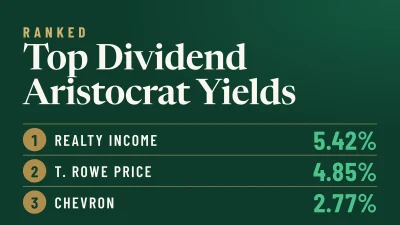
A Dividend Aristocrat is an S&P 500 company that has raised its dividend for at least 25 consecutive years. That streak screens out companies that cut when business turns ugly, but it says nothing about whether next year’s raise is funded. This list holds every name to a second test: the payout has to be covered by cash the business actually gets. Realty Income (NYSE:O), T. Rowe Price (NASDAQ:TROW | TROW Price Prediction) and Chevron (NYSE:CVX) all sit on the Dividend Aristocrats roster, and all three pass the cash test. Realty Income leads the group with a 5.42% yield, high-yield territory supported by a cash cushion that is still widening.
Realty Income: Monthly Checks With AFFO to Spare
Realty Income yields 5.42% at a share price of $56.91, and it pays monthly. The latest monthly dividend is $0.2715 per share, for an annualized forward rate of $3.258. For a retiree matching income to monthly bills, that schedule is hard to beat.
Dividend safety. REITs are judged on adjusted funds from operations (AFFO), and Realty Income raised its full-year AFFO guidance to $4.44 to $4.45 per share. At the midpoint of that range, the forward dividend uses about 73% of AFFO, which leaves money for reinvestment after the checks go out. Second-quarter AFFO came in at $1.09 per share, up 3.8% year over year. The rent behind those checks looks firm: portfolio occupancy is 98.8% and the rent recapture rate on re-leased properties is 102.7%, so expiring leases are being renewed at higher rents. On the balance sheet, net debt runs 5.4x annualized pro forma adjusted EBITDAre, and the company holds a Fitch "A" long-term rating with a stable outlook. Its revolving credit facility was increased to $5.5 billion.
Track record. Realty Income’s second-quarter raise was its 115th consecutive quarterly dividend increase, and the company had declared 670 consecutive monthly dividends as of its first-quarter release. The monthly rate has moved from $0.264 at the start of last year to $0.2715 now.
Bull case. Realty Income is moving beyond retail into industrial property and data centers, including a $6 billion hyperscale data center joint venture. Second-quarter revenue rose 9.7% to $1.55 billion. Income investors get a growing monthly check from a landlord whose rent roll keeps increased.
Risk. Tenant credit is the soft spot. Only 34.3% of annualized base rent comes from investment-grade clients, which means 65.7% depends on weaker-rated tenants. A consumer slowdown would test that group first.
T. Rowe Price: A Cash-Rich Balance Sheet Behind a High-Yield Payout
T. Rowe Price yields 4.85% at a share price of $102.32. The quarterly dividend is $1.30 per share, up from $1.27 last year, for a forward annual rate of $5.20.
Dividend safety. The forward dividend uses about 53% of trailing diluted earnings of $9.88 per share. Cash coverage is in good shape too. Through the first three quarters of this year, dividends absorbed roughly 55% of free cash flow (operating cash flow minus capital spending). Last year was tighter, with dividends using about 77% of free cash flow, but still covered. The balance sheet is the real backstop. T. Rowe Price holds $3.77 billion in cash and equivalents against $418.6 million of debt-related obligations, all of it capital leases, and reports no long-term debt. Another $5.54 billion sits in long-term investments.
Track record. Its regular quarterly dividend has grown from $0.10 in 1999 to $1.30 today, with a higher regular rate in every year since 2017, when it stood at $0.57. Special dividends have also been paid on top of the regular rate, including $3 in 2021.
Bull case. The latest quarter was strong. Adjusted EPS of $2.86 beat the $2.65 consensus by 7.94%, and operating income rose 10.21% to $769.8 million. Average assets under management climbed 9.5% to $1.887 trillion, while multi-asset revenue grew 9.2% and alternatives revenue grew 9.4%. The shares trade at about 11 times trailing earnings and 10 times forward earnings, a modest multiple for a business with this much cash.
Risk. Clients keep pulling money out. Net outflows reached $28.3 billion in the third quarter, $25.6 billion of it from equity strategies, and the effective fee rate slid to 37.8 basis points from 39.1. If market increases stop covering for those outflows, the earnings behind future raises will get squeezed.
Chevron: Free Cash Flow Covers the Dividend With Room to Spare
Chevron has the lowest yield of the three at 2.77%, partly because the stock has risen 57.37% over the past year to $232.48. The quarterly dividend is $1.78 per share, for a forward annual rate of $7.12. In exchange for the lower yield, investors get the widest coverage on this list.
Dividend safety. Third-quarter free cash flow came to $12.003 billion, up 156.86% from a year earlier, while dividends that quarter cost $3.482 billion, or about 29% of free cash flow. Across the first three quarters of the year, dividends used roughly 37% of free cash flow. Even last year, when oil prices were lower, they used about 77%. On earnings, the forward dividend works out to about 52% of trailing EPS of $13.62. Its balance sheet is conservative, with debt-to-equity of 0.219, net debt at 0.94 times EBITDA and interest coverage of 13.70 times. Chevron cut total debt by a record $8.4 billion in the second quarter and another $3.5 billion in the third.
Track record. Its quarterly rate has gone from $1.08 in 2017 to $1.78 now, with a higher rate in every year of that period, including $1.63 in 2024 and $1.71 in 2025.
Bull case. Adjusted EPS of $5.28 in the third quarter beat the $4.83 consensus by 9.41%, Chevron’s seventh straight beat. The company reached its $3 billion structural cost-cutting target six months early, is now aiming for up to $4 billion by the end of 2026, and has got $1.5 billion in annual run-rate synergies from the Hess deal. That gives Chevron room to raise the dividend, buy back stock and pay down debt, all at once.
Risk. Coverage moves with oil prices. Brent averaged $97 per barrel in the third quarter, compared with $69 a year earlier, and a return to lower prices would reduce the surplus that makes this payout look so comfortable today.
Cash Coverage Separates These Aristocrats From the Pack
Realty Income offers the highest yield and a monthly check that its AFFO guidance well covers. T. Rowe Price combines a high-yield payout with more cash than debt on its balance sheet. Chevron pays the lowest yield of the three but turns only a fraction of its free cash flow into dividends. Each has a raise streak supported by current cash generation, and that coverage is what makes the next increase likely.
Contact [email protected] for any questions or corrections.
Lee Jackson has covered Wall Street analysts' equity and debt research and equity strategy daily for 24/7 Wall St. since 2012. His broad, diverse career, including a stint as creative services director at an NBC affiliate in Austin, Texas, gives him unique insight into the financial industry.
Lee Jackson's journey in the financial industry spans more than 30 years, including nearly two decades as an institutional equity salesperson at Bear Stearns, Lehman Brothers, and Morgan Stanley. His career spanned pivotal sell-side Wall Street events, from the dot-com rise and bubble to the Long-Term Capital Management debacle, 9/11, and the Great Recession of 2008. This reflects his resilience and adaptability amid market volatility.
Lee Jackson’s practical financial industry experience, gained through a career at some of the biggest banks and brokerage firms, is complemented by a lifetime of writing across various platforms. This unique combination allows him to shed light on the intricacies of Wall Street in a way only someone with deep insider experience and knowledge can. Moreover, his extensive network across Wall Street continues to provide direct access for him and 24/7 Wall St., a privilege few firms enjoy.
Since 2012, Jackson’s work for 24/7 Wall St. has been featured in Barron’s, Yahoo Finance, MarketWatch, Business Insider, TradingView, Real Money, The Street, Seeking Alpha, Benzinga, and other media outlets. He attended the prestigious Cranbrook Schools in Bloomfield Hills, Michigan, and has a degree in broadcasting from the Specs Howard School of Media Arts.