Wall Street Just Set a Record That Could Signal Trouble for the Stock Market
Investors stampeded into downside protection in a single session, shattering a record set during last spring's turmoil. The scramble exposes how quickly AI-fueled confidence cracked, and history suggests this kind of panic can mean two very different things.

This post may contain links from our sponsors and affiliates, and Flywheel Publishing may receive compensation for actions taken through them.

Wall Street set a record on Thursday that points to real stress in the stock market. Put volume at Cboe reached 11.23 million contracts on November 5, exceeding the previous record of 10.22 million set on April 4, 2025. That is an increase of approximately 10%. The record came during a selloff that wiped out the post-midterm rally and sent the market’s fear index close to its spring highs. It matters now because it shows how fast confidence in the AI-driven bull market turned into a scramble for protection.
Record Put Volume Caps a Year of Heavy Hedging
A put option gives its buyer the right to sell a stock or index at a set price before a set date. Investors buy puts to profit from declines or, more often, to protect their portfolios against them, and a spike in put volume shows that many investors are trying to lock in downside protection at the same time.
Thursday’s reading continues a longer trend. The 20-day average of put volume has rose to roughly 7 million contracts, compared with approximately 4 million in 2022. That is a 75% increase in average daily activity. Eight of the 10 highest daily put-volume readings reportedly occurred this year, so the rise in hedging goes well beyond one volatile session. Bloomberg reported that options volumes overall hit record levels during the post-election selloff.
AI Fears and Midterm Fallout Triggered Thursday’s Collapse
The November 5 selloff explains much of the panic. The NASDAQ Composite plunged 5.5%, the S&P 500 fell 4.4%, and the NASDAQ 100 lost approximately $2.5 trillion in market value. Investors were growing more worried about AI valuations, rising financing costs and possible new limits on data-center construction following the midterm elections.
Positioning made the reversal sharper. Goldman Sachs (NYSE:GS | GS Price Prediction) reported. Investors had reduced their downside hedges during Wednesday’s post-election rally, only to rush back into protection as stocks collapsed Thursday. Dropping hedges one day and racing to rebuy them the next helped push put volume to a record.
Doubts about AI had been building for months. The hosts joined a 24/7 Wall St. podcast in September. They noted that “AI infrastructure, the companies building the actual chips and selling into data centers, have been out of favor.”
Fear Gauge Jumps to Its Highest Level Since Late March
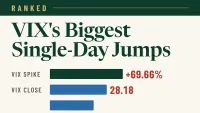
The CBOE Volatility Index (VIX) uses S&P 500 options prices to measure expected volatility over the next 30 days. It closed at 28.18 on November 5, up from 16.61 a day earlier. That 69.7% one-day jump put the index in the 98.4 percentile of levels over the past year, far above its 18.055 average for that period. Higher closes in that window came only during the March turmoil, when the VIX peaked at 31.05 on March 27.
A levels between 20 and 30 signals elevated uncertainty. Thursday’s close sat just below the above 30 high-fear threshold. Higher volatility increases the price of options protection, so investors paid steeper premiums for puts at the same moment demand hit a record.
Options Hedging Can Accelerate a Decline
Heavy buying of short-dated puts can make a selloff worse, and market makers who sell those puts usually hedge by shorting stock or futures. As prices fall, they have to sell more to stay balanced, and that feedback loop can push indexes lower than fundamentals alone would justify. Reuters also reported that volatility-sensitive strategies were expected to sell approximately $47 billion in equities near Thursday’s close. That added automatic, rules-based selling on top of investors’ own decisions to sell.
Put-Heavy Positioning Stretches Into Late November
Options data shows demand for hedges remains high. The SPDR S&P 500 ETF Trust (NYSEARCA:SPY) has a full-chain put/call ratio of 1.19, meaning puts outnumber calls across its options chain. Puts are most concentrated in late-November expirations, with a ratio of 4.44 for November 27 and 3.28 for November 20. The Invesco QQQ Trust (NASDAQ:QQQ) has a full-chain ratio of 1.21, with levels of 1.51 for both the November 20 and November 30 expirations.
The picture is mixed. Some near-term SPY expirations lean toward calls, including a ratio of 0.19 for November 17. A ratio above 1 can reflect protective hedging, spread trades or outright bearish positions, and the data points to strong demand for protection, while the reason behind each trade is unknown.
Stocks Steadied Friday as Bonds Rallied
Friday brought some relief. SPY closed at $735.36, up 0.32% on the session, while QQQ rose 1.4% to $656.10. Both still ended the week lower: SPY fell 2.7% and QQQ dropped 4.98%. Over the past month, the tech-heavy fund has fallen 13.41%, compared with a 5.39% decline for SPY. Year to date, SPY is up 7.83% and QQQ is up 6.8%.
Treasuries worked as a safe haven. The 10-year yield slipped to 4.84% on November 5 from 4.9% a day earlier, well below its 5.31% high on October 5. Lower long-term yields usually support growth-stock valuations, but AI stocks fell anyway. The gap between 10-year and 2-year yields narrowed to 0.35% on November 6 from 0.51% on October 7. The curve is still positive, but its flattening signals growing economic uncertainty.
Record Puts Have Often Marked Turning Points
Record put volume has a mixed history as a crash signal. Investors use puts as portfolio insurance and as parts of spread trades, and bullish traders sell them to collect income. Extreme demand for protection sometimes lines up with market bottoms, because once investors are fully hedged, fewer of them are left who might be forced to sell. The VIX also tends to fall back toward normal: it spikes quickly and declines slowly.
Riding an AI-driven run is fine. The exit must be planned, which is the whole point of our free bubble survivor’s handbook: you can grab it here.
Key Signals for the Week Ahead
- VIX direction: A drop back toward its 18.055 one-year average would suggest Thursday was a short burst of panic. A close above 30 would put the index in high-fear territory.
- Late-November expirations: The put-heavy SPY contracts expiring November 20 and November 27 show where hedging demand is concentrated.
- AI policy signals: Any post-midterm action on data-center construction rules could resume the selloff or calm it.
- Treasury yields: Further declines from 4.84% could ease financing-cost concerns for companies spending heavily to build AI infrastructure.
Record put buying shows how quickly confidence has slipped. Investors in the AI-driven bull market are paying up for protection amid concerns about AI spending and valuations. The question now is whether this is a short burst of panic or the start of a longer move away from risk.
Contact [email protected] for any questions or corrections.
After two decades of patrolling the dark corners of suburbia as a police officer, Rich Duprey hung up his badge and gun to begin writing full time about stocks and investing. For the past 20 years, he’s been cruising the markets looking for companies to lock up as long-term holdings in a portfolio while writing extensively on the broad sectors of consumer goods, technology, and industrials. Because his experience isn’t from the typical financial analyst track, Rich is able to break down complex topics into understandable and useful action points for the average investor. His writings have appeared on The Motley Fool, InvestorPlace, Yahoo! Finance, Money Morning, and, of course, 24/7 Wall St. He has been featured in both U.S. and international publications, including MarketWatch, Financial Times, Forbes, Fast Company, and USA Today.