Wall Street’s Fear Gauge Just Had Its Third-Biggest Jump Since 1990
Markets opened calm on Thursday, then an election result sent fear surging past nearly every spike on record, even the pandemic crash. History says stocks often rebound from moments like this, but one warning sign suggests the real damage may…

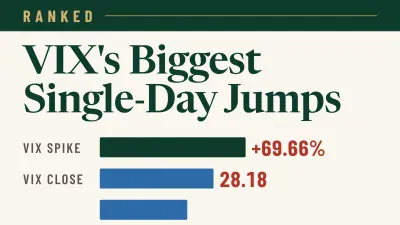
At the open on Thursday, November 5, 2026, Wall Street’s fear gauge sat near its calmest level in weeks. By the close, the Cboe Volatility Index (VIX) stood at 28.18, up from 16.61 the day before.
That rise of 11.57 points, or 69.66%, ranks as the VIX’s third-biggest one-day percentage increase since 1990, measured close to close. During the session, the index ran from a low of 16.70 to a high of 28.36.
The trigger was the election result. Democrats won both chambers of Congress in the Tuesday, November 3 midterms, and investors priced in the risk that the new Congress could slow the AI data-center build-out behind the market’s leaders.
The S&P 500 fell 334.89 points, about 4.36%, to 7,353.73. The Dow dropped 1,833.06 points to 51,523.06, the Nasdaq Composite lost 1,421.52 points to 24,315.00, and the Nasdaq-100 fell 6.4%. Those losses erased Wednesday’s post-midterm rally. What remains unclear is whether a spike this sharp marks a turning point or the start of a longer slide.
What a VIX Reading of 28 Signals
The VIX is an index calculated from S&P 500 options prices, and it reflects how much volatility options traders expect over the coming month. You cannot buy it directly.
From October 7 through November 4, the VIX ran from 14.84 to 21.15. Thursday’s jump moved it out of the normal range and into the 20 to 30 band that signals higher uncertainty.
The calm start explains much of the jump’s size. The policy shock landed on AI and chip stocks, the group that had led the market higher, at a moment when the market was priced for quiet.
The third-place ranking compares closing levels. Measured intraday, the session’s high was an eight-month high, and the jump was the largest in more than 18 months.
Why the Pandemic Never Made This List
Only two sessions since 1990 beat Thursday’s move: about 116% on February 5, 2018, and about 74% on December 18, 2024.
The 2020 pandemic sell-off days do not rank in the top ten, because the VIX never rose more than 50% in a single session that year. Instead, it rose 40% or more on four days within three weeks as fear built over many sessions.
Professionals rushed to buy protection.
Nearly 800,000 VIX call options traded by midday, about 3.5 times the 30-day average. Those calls gain value if volatility keeps rising, so large investors were paying to hedge against further losses. Hedges bought in a rush are often sold once the news settles, and that selling can pull the VIX down almost as quickly as it rose.
What History Says About S&P 500 Returns After VIX Spikes
History has favored the index after spikes like this. The S&P 500 was higher a month later after nine of the past 10 days when the VIX rose 50% or more. Whether the bar was a 40%, 50% or 60% jump, the index was typically higher a month later by roughly two to four times its usual one-month gain.
That study looks only at past episodes, and it guarantees nothing. Adam Turnquist of LPL Financial (NASDAQ:LPLA | LPLA Price Prediction) said volatility had not yet reached the capitulation or contrarian extremes that usually mark market bottoms. Capitulation is the point where sellers give up in large numbers.
If the new Congress limits data-center permitting or power access, AI earnings estimates could fall, and lower stock prices would then reflect real damage to earnings.
Investors researching the S&P 500 may consider the historical rebound pattern against the risk to AI earnings, and the broad index carries less concentration in the AI leaders that fell hardest. A VIX close below 20 by December 4, 2026 would show the historical pattern holding, while a close above 30 would mean fear has further to run.
Contact [email protected] for any questions or corrections.
Omor Ibne Ehsan is a writer at 24/7 Wall St. He is a self-taught investor with a focus on growth, cyclical, and dividend equities that have strong fundamentals, value, and long-term potential. He also has an interest in high-risk, high-reward investments such as penny stocks.