JPMorgan Values Bitcoin at $266,000 Against Gold. Why It’s Trading Below $81,000?
JPMorgan's analysts put a staggering price tag on Bitcoin that dwarfs every other bank's forecast, yet the coin keeps trading at a fraction of that figure. Understanding why reveals something uncomfortable about how valuation models actually work.

This post may contain links from our sponsors and affiliates, and Flywheel Publishing may receive compensation for actions taken through them.

As of September 18, 2026, Bitcoin (CRYPTO:BTC) is trading at $80,950, while JPMorgan’s internal model estimates its value at $266,000. Many readers might see these two figures together and assume one is a typo, but both are valid in their own contexts.
The market price reflects what buyers and sellers agree on, while the bank’s figure suggests what Bitcoin could be worth if it captured a similar share of the store-of-value market as gold, adjusted for Bitcoin’s higher volatility. So which number deserves more attention, and what could bridge the gap between them?
How JPMorgan Arrived at $266,000

This figure is not a new prediction. Nikolaos Panigirtzoglou’s team first published it in February 2026 and has reiterated it in subsequent notes. The method used compares Bitcoin with gold on a volatility-adjusted basis.
JPMorgan estimates that private-sector gold holdings total about $8 trillion, excluding central bank reserves. They then calculate what Bitcoin’s market capitalization would need to be to match that exposure, finding a value close to $5.3 trillion, which translates to about $266,000 per coin.
The difference between $5.3 trillion and $8 trillion reflects the volatility adjustment. Since Bitcoin is inherently more volatile than gold, a smaller investment in Bitcoin can carry the same risk as a larger investment in gold. Thus, an investor aiming to protect against currency debasement requires fewer dollars in Bitcoin to achieve equivalent exposure.
Two aspects of this framework need clarification. First, it is a relative valuation, meaning the figure only makes sense relative to an asset that also fluctuates, and a decline in gold prices would similarly reduce Bitcoin’s fair value. JPMorgan has also never specified a timeline for this estimate, a detail often overlooked by those who share the model. The model prices the asset, not the year.
Bitcoin’s Volatility Against Gold Hits a Record Low
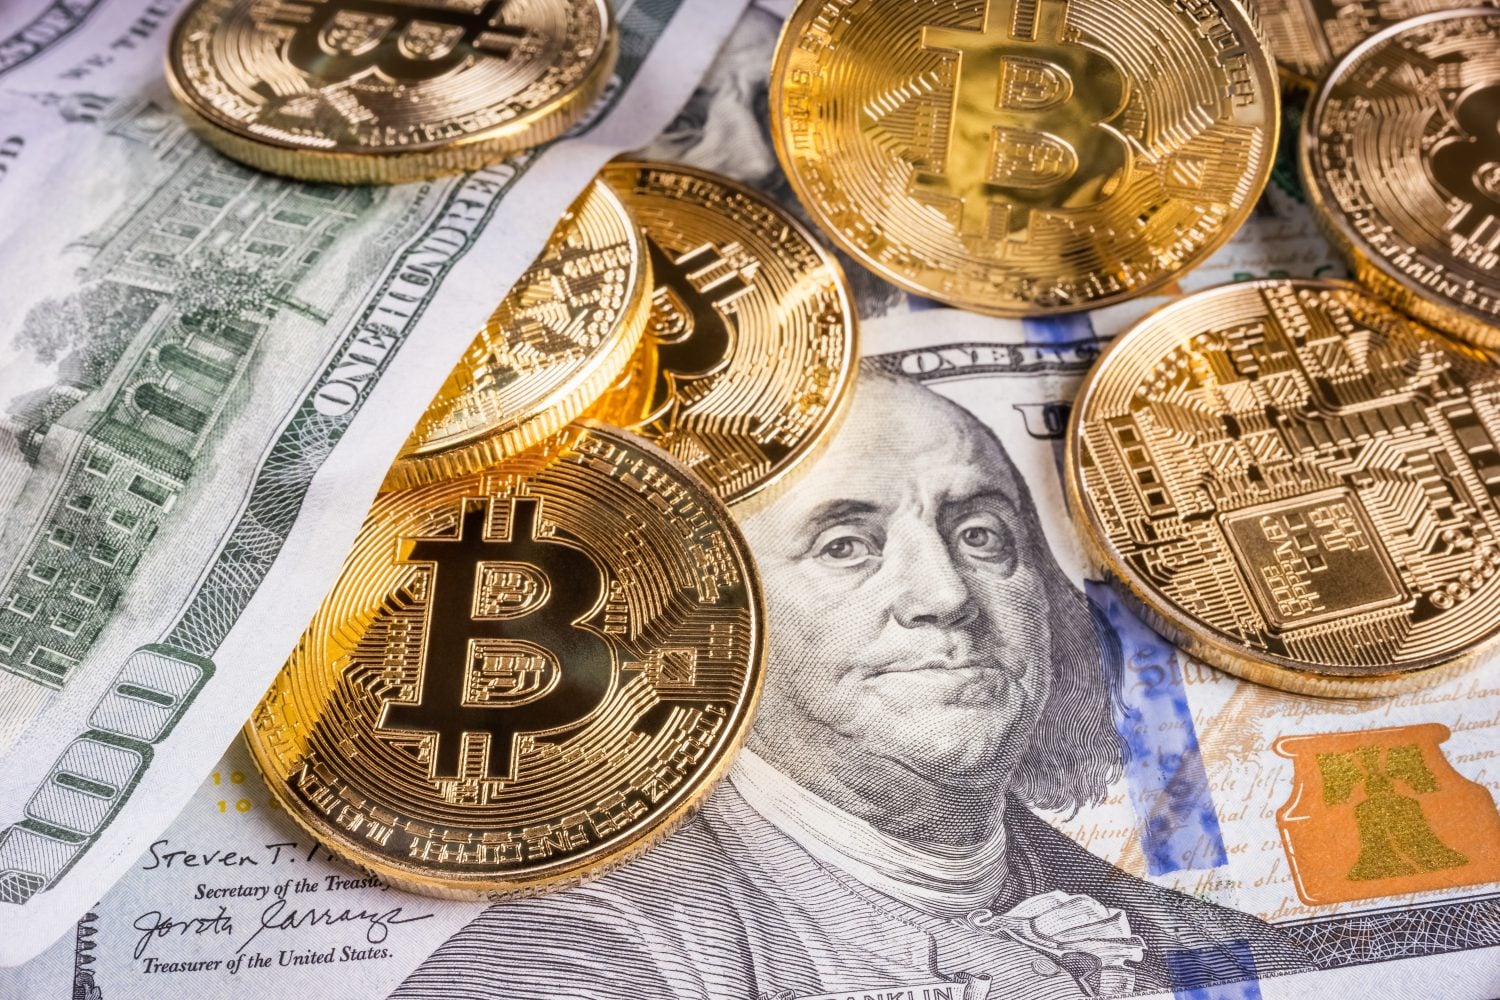
In September, the focus shifted from the valuation target to the volatility ratio. JPMorgan reported that Bitcoin’s volatility relative to gold has reached a record low, improving Bitcoin’s risk-adjusted appeal without any change in Bitcoin’s price.
This shift resulted from two developments. Gold appreciated more than 30% through late 2025, increasing its market capitalization to $28.3 trillion, while gold’s volatility rose as it climbed. In contrast, Bitcoin was trading near $58,000 in late June and has since recovered about 40%.
“The significant outperformance of gold compared to Bitcoin since last October, along with the sharp increase in gold’s volatility, has made Bitcoin appear more attractive in the long term,” the analysts noted. Thus, the argument for Bitcoin strengthened because the comparison asset became less favorable, although this is not as robust a reason for investment as the headline figure suggests.
Comparing $266,000 Against Other Bank Targets
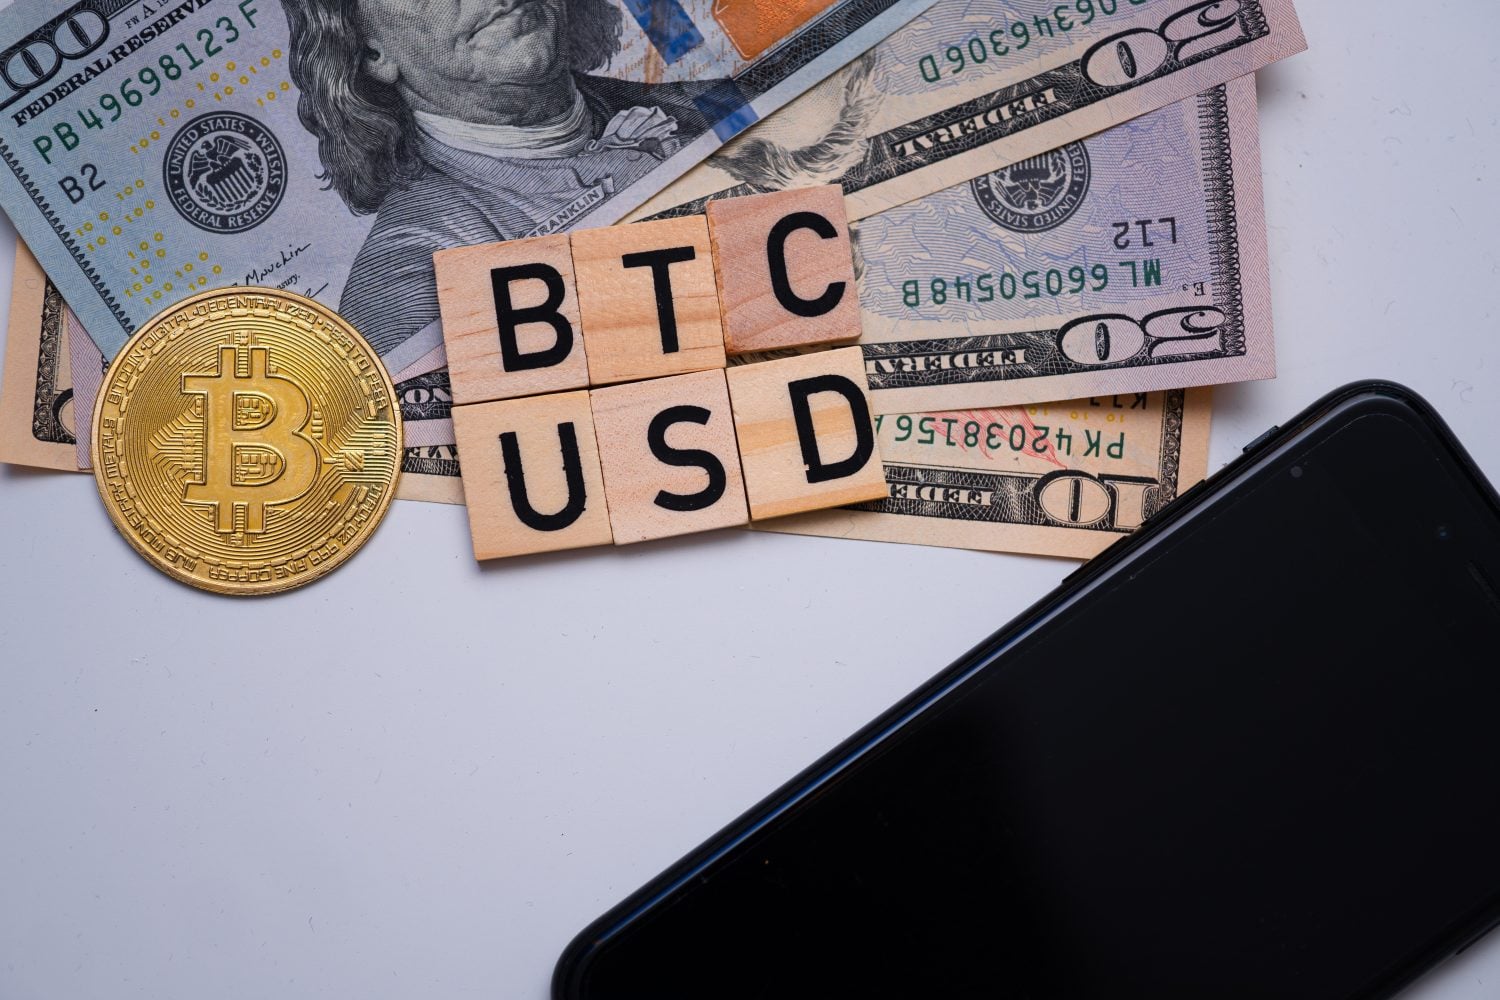
For Bitcoin to reach JPMorgan’s target of $266,000 from its current price of $80,950, it would need to increase by approximately 229%, or about three and a quarter times. Other banks provide different targets, as shown here.
| Bank | Target | Change from $80,950 | Timeframe |
|---|---|---|---|
| Citi (bear case) | $53,000 | 34.5% lower | 12 months |
| Citi (base case) | $82,000 | 1.3% higher | 12 months |
| Standard Chartered | $100,000 | 23.5% higher | Year-end 2026 |
| Bernstein | $150,000 | 85.3% higher | Mid-2027 |
| JPMorgan | $266,000 | 228.6% higher | None stated |
The right column explains the variances in targets. The other banks provide timelines for their estimates, whereas JPMorgan’s analysis is based on the relationship between two assets and lacks a specified date, resulting in a target that far exceeds the others.
Why the Market Overlooked $266,000 for Seven Months

Every valuation model must navigate the distinction between an asset’s worth and its market price. A model can accurately predict a destination while providing little guidance on how to get there.
JPMorgan’s framework does not consider the three critical factors buyers prioritize, namely time, interest rates, and capital flows. It fails to specify when Bitcoin could attain that value, does not account for the opportunity cost of holding a non-yielding asset while 10-year Treasury yields are at 4.94% and 30-year yields at 5.29%, and overlooks the weekly fluctuations in Bitcoin ETF inflows and outflows.
This became evident from February to September. Bitcoin never approached the $266,000 mark, dropped to around $58,000 in late June, and rose to $80,950 by September 18, while JPMorgan’s estimate remained static. The valuation persisted through a 33% drop and a subsequent 40% recovery without moving, indicating it was not tracking Bitcoin’s price.
The nearest significant price point on the chart is $82,283, the intraday high Bitcoin reached on September 3, 2026, which stands 1.6% above its current trading price. Bitcoin has struggled to surpass this mark throughout the month, and until it does, discussions around six-figure valuations will remain purely theoretical.
Is $266,000 a Target or a Thought Experiment?
Panigirtzoglou clarified that the $266,000 figure is unrealistic in the near term and should be seen as a long-term benchmark. He advises readers not to base trading decisions solely on this number, especially since JPMorgan has not provided a specific timeline for it over the past seven months.
This figure represents the market share Bitcoin has yet to capture. While gold’s private-sector pool is valued at nearly $8 trillion, Bitcoin’s market capitalization is around $1.6 trillion, and the gap between these amounts is central to the argument.
Investors who treat this figure as a target may face uncertainty, as they could see significant price fluctuations, such as the 33% drop from $87,000 to $58,000, which JPMorgan’s model did not account for.
Contact [email protected] for any questions or corrections.
Sam Daodu is a crypto analyst who's spent nearly a decade making blockchain understandable—no easy task when most whitepapers read like fever dreams. He writes for 24/7 Wall St., covering Bitcoin, altcoins, and crypto market analysis for investors. Before crypto, he was a tech writer (back when explaining "the cloud" was peak innovation). Since 2018, he's written for CoinTelegraph, Yahoo Finance, The Block, Cryptonews, Zypto, Rain, and more—basically anywhere people want crypto news without the headache. Sam runs MacLabs Marketing, a content agency for crypto brands tired of sounding like AI wrote their website. He also publishes free crypto education on his site for Web3 enthusiasts who think "gas fees" is a typo. When he's not writing or staring at charts, Sam's either: - Watching anime (currently convinced One Piece has better tokenomics than most altcoins) - At the gym sculpting himself into a Greek god - Listening to the music your mum warned you only bad boys listen to Connect: LinkedIn | Email | MacLabs Marketing