Bitcoin Fell in Every Past Midterm Year and Rallied the Year After. Which Pattern Wins This Time?
Bitcoin has crashed over 50% in every midterm election year on record, then bounced back hard the year after. But 2026 is breaking the mold in ways that could upend everything investors think they know about this cycle.

This post may contain links from our sponsors and affiliates, and Flywheel Publishing may receive compensation for actions taken through them.

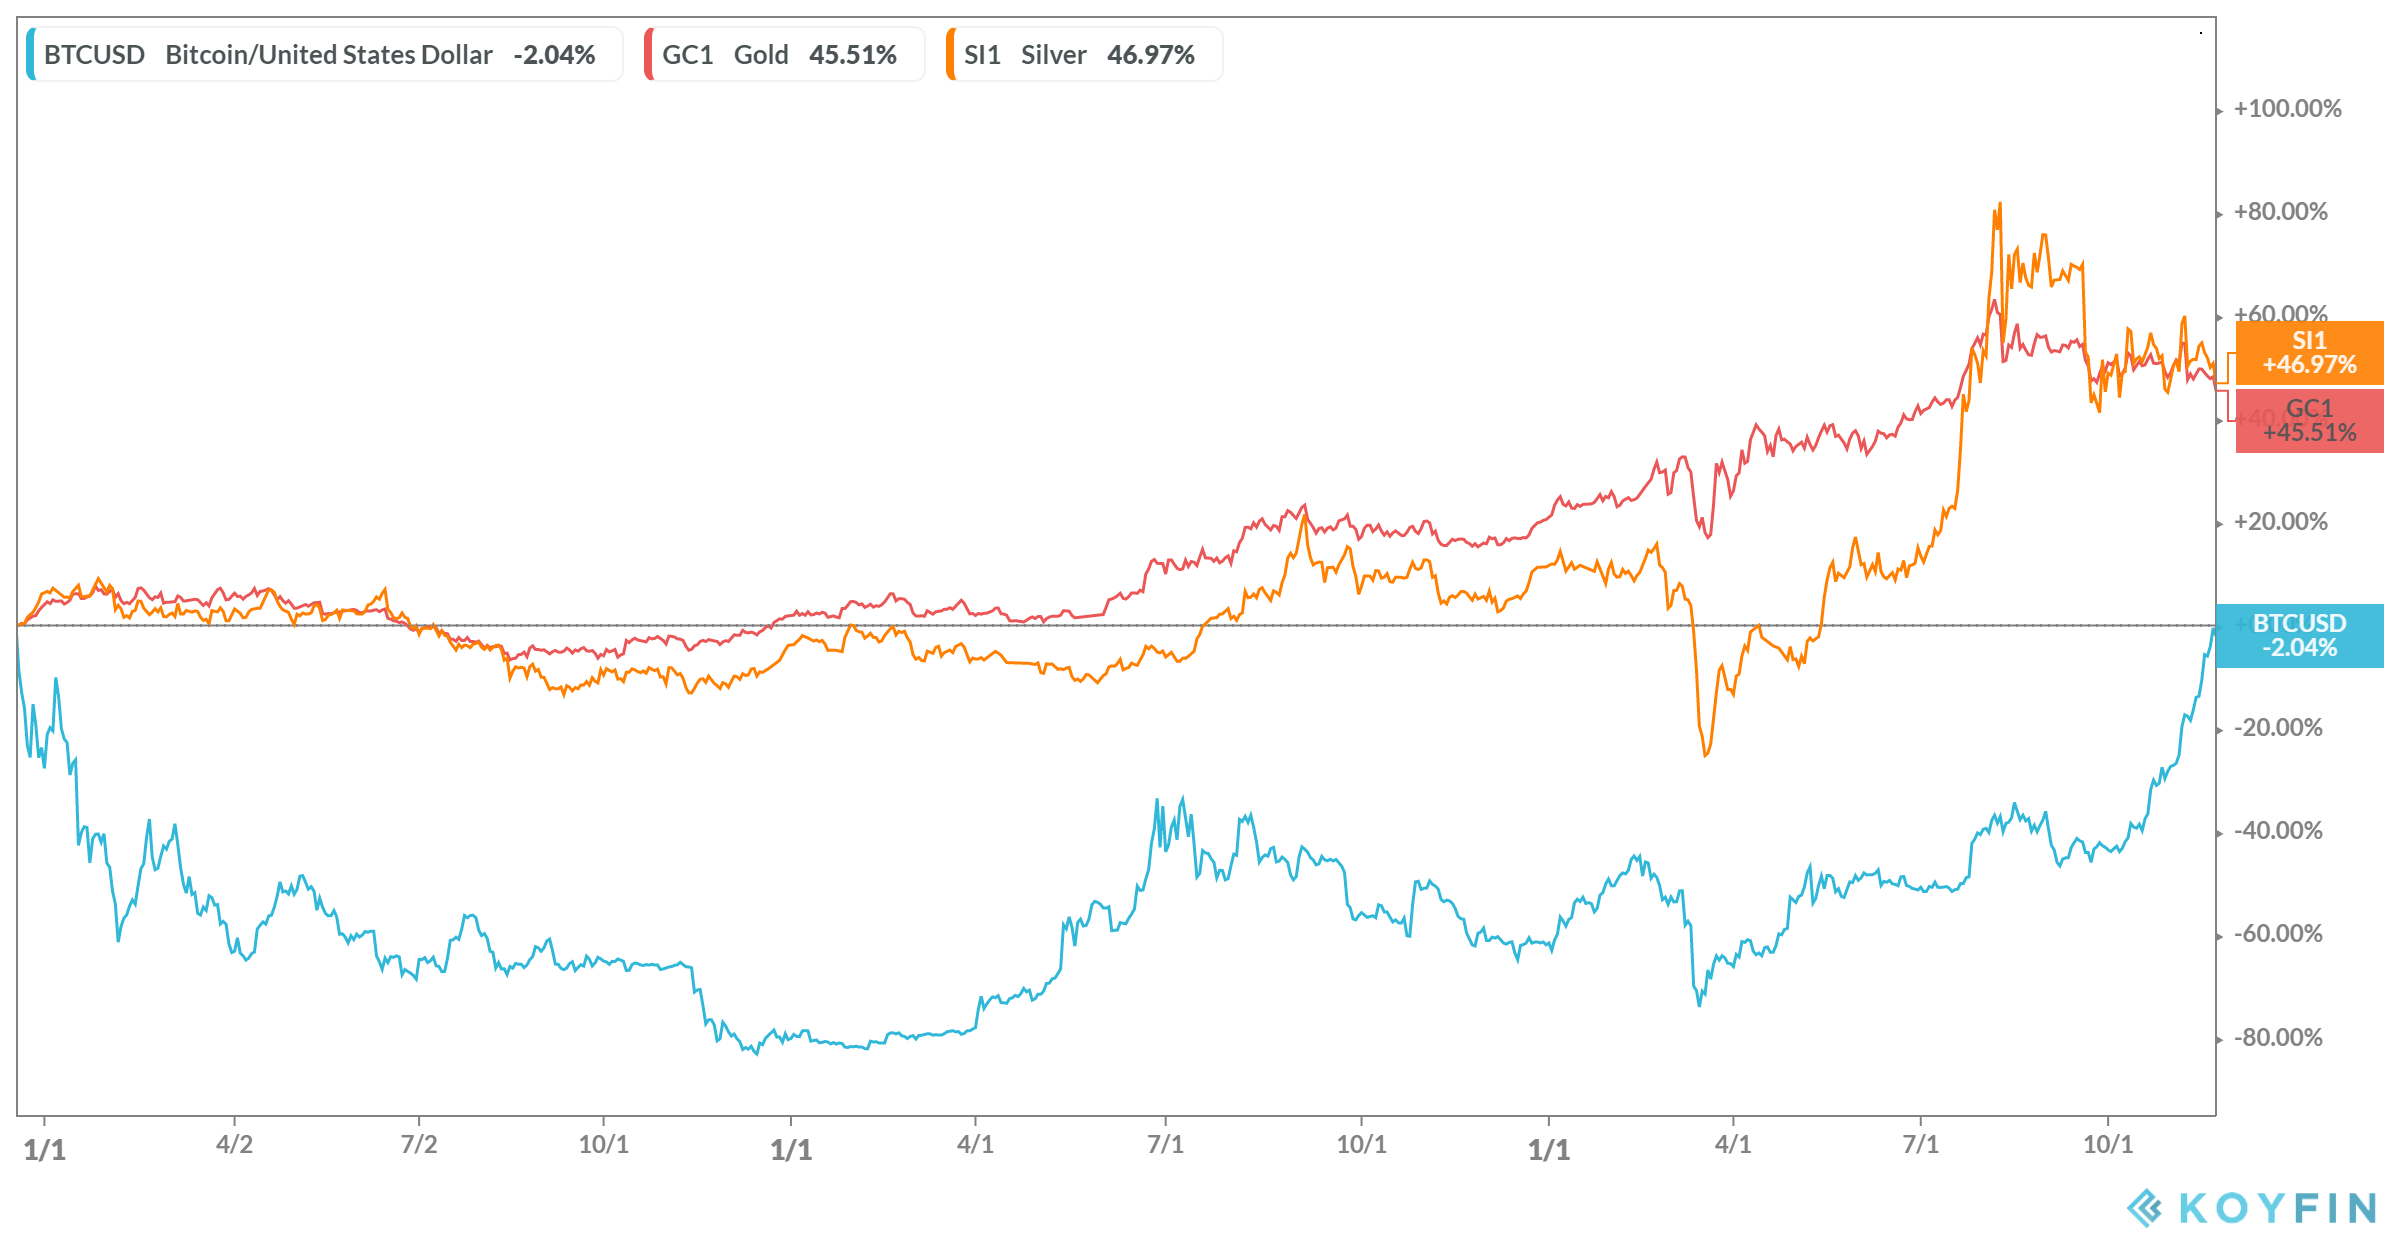
Bitcoin (CRYPTO: BTC) has witnessed sharp declines during each of the last three U.S. midterm election years: it dropped 56% in 2014, 73% in 2018, and 64% in 2022, according to Binance Research. However, following each of these downturns, Bitcoin rallied, gaining an average of 54% in the year that followed.
As we approach the elections on November 3, 2026, this historical trend is resurfacing. As of October 5, Bitcoin is priced at $86,189, about 32% below its previous high of $126,080. This raises the question: Will we see the familiar midterm slump, or could a rally be on the horizon this time?
Bitcoin Fell in 2014, 2018 and 2022, Then Rallied the Year After

Binance Research calculated the losses from these past midterm years as full calendar-year declines. Each of these years saw Bitcoin lose more than half of its value, with the steepest decline occurring in 2018, when it almost lost three-quarters of its price.
In contrast, traditional stock markets showcase a more stable trend. The S&P 500 has averaged a 19% gain in the 12 months after midterm elections and hasn’t posted a losing year following midterms since 1939, according to Binance Research.
It’s important to remember that Bitcoin’s midterm track record is limited, covering only three elections. In the 2010 midterms, Bitcoin was still in its infancy, rising from fractions of a cent to about 30 cents.
The Bitcoin Midterm Pattern Lines Up With Its Four-Year Cycle

Timing plays a significant role in understanding these patterns. Bitcoin has traditionally operated on a boom-and-bust cycle of approximately four years, closely related to its halving events—periods when the new supply of Bitcoin is cut in half. Coincidentally, U.S. midterm elections occur every four years, meaning each midterm has aligned with the downturn that follows a Bitcoin cycle peak.
This overlap suggests that the midterm narrative might actually reflect the broader four-year cycle rather than an independent trend. With only three past instances, it’s hard to tell whether this correlation is coincidence or a genuine predictive pattern.
Bitcoin’s 2026 Drop Is Far Milder Than Past Midterm Years

Interestingly, Bitcoin has not followed the typical midterm script for 2026. So far, Bitcoin is down only about 3% this year, in stark contrast to the larger declines of 56% to 73% during previous midterm years. Much of the 30% drop over the past year occurred in late 2025, after hitting a high of $126,080 in October.
This year’s milder decline reflects new market dynamics. Unlike in previous midterms, the advent of U.S. spot Bitcoin ETFs, which let investors hold Bitcoin like shares, has introduced a new class of buyers.
These funds currently hold about $109 billion in Bitcoin and saw inflows of about $2.4 billion in a single week in late September. Pension funds and financial advisers purchasing through these ETFs may respond to market shifts differently than the individual traders who dominated earlier cycles.
Which Bitcoin Midterm Pattern Wins This Time?
Right now, neither the midterm slump nor the post-midterm rally seems like a strong indicator for 2026. With Bitcoin only down about 3% this year, the historical slump hasn’t materialized yet, and the average rally rests on a record that’s too small to fully trust.
Investors should avoid reacting blindly to historical patterns and instead consider current market trends, such as ETF flows and Federal Reserve policies influencing Bitcoin in 2026.
The upcoming fourth quarter will be a crucial test. If Bitcoin falls enough to end 2026 down 50% or more, we might see a delayed repeat of the midterm slump. Conversely, if Bitcoin can hold around the October level as we approach the elections—and then rise above $126,080 in 2027—a post-midterm rally could emerge. However, this would still be based on a limited historical record.
Contact [email protected] for any questions or corrections.
Sam Daodu is a crypto analyst who's spent nearly a decade making blockchain understandable—no easy task when most whitepapers read like fever dreams. He writes for 24/7 Wall St., covering Bitcoin, altcoins, and crypto market analysis for investors. Before crypto, he was a tech writer (back when explaining "the cloud" was peak innovation). Since 2018, he's written for CoinTelegraph, Yahoo Finance, The Block, Cryptonews, Zypto, Rain, and more—basically anywhere people want crypto news without the headache. Sam runs MacLabs Marketing, a content agency for crypto brands tired of sounding like AI wrote their website. He also publishes free crypto education on his site for Web3 enthusiasts who think "gas fees" is a typo. When he's not writing or staring at charts, Sam's either: - Watching anime (currently convinced One Piece has better tokenomics than most altcoins) - At the gym sculpting himself into a Greek god - Listening to the music your mum warned you only bad boys listen to Connect: LinkedIn | Email | MacLabs Marketing