Bitcoin and Gold Have Never Been the Two Worst Major Assets in the Same Year Until 2026. Why Are Both Store-of-Value Assets Falling?

This post may contain links from our sponsors and affiliates, and Flywheel Publishing may receive compensation for actions taken through them.

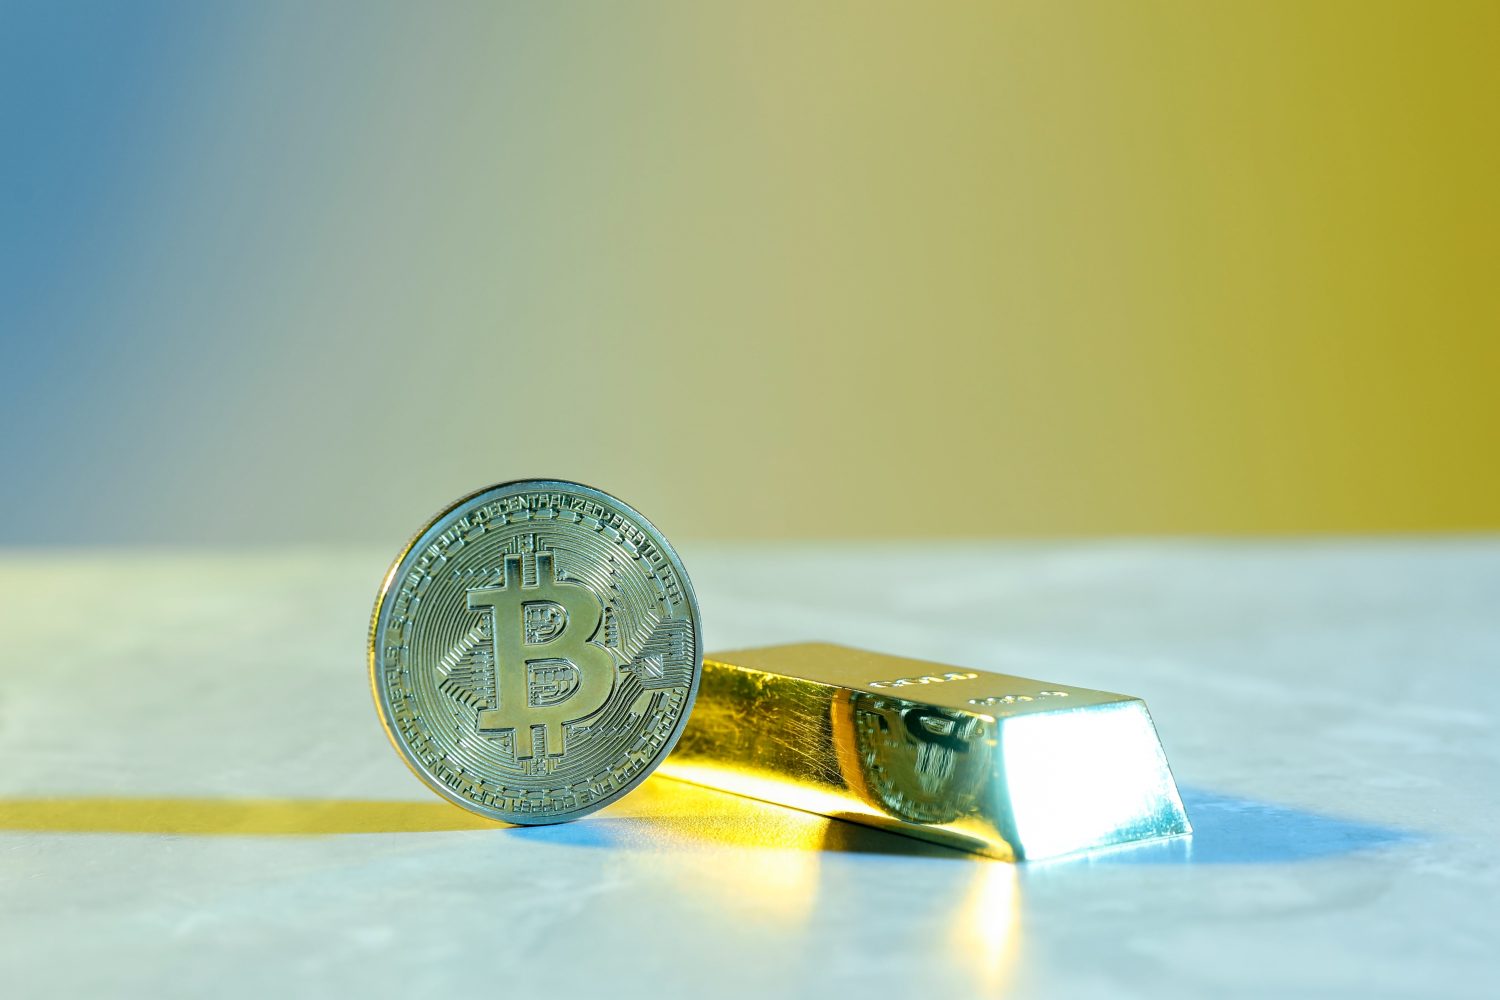
Bitcoin and gold are the two worst-performing major assets of 2026. Market analyst Charlie Bilello wrote on X on November 7, 2026, “Bitcoin (-13%) and Gold (-6%) are the two worst-performing major assets so far in 2026. This is something we haven’t seen before in any calendar year.”
Bitcoin (CRYPTO: BTC) trades at $75,034, down 1.2% over the past 24 hours and 14.3% this year. It closed at $74,740 on November 8, its weakest close in 30 days, and trades 40.5% below its all-time high of $126,080 from October 6, 2025. That contrasts sharply with September, when Bitcoin outperformed both stocks and gold.
Investors typically buy both Bitcoin and gold as stores of value, assets meant to preserve purchasing power during inflation or currency weakness. So why are both losing ground while the S&P 500 is up?
Higher Yields, a Strong Dollar and AI Stocks Pulled Money From Both
The 10-year Treasury yield hit a 12-month high of 5.31% on October 5 and was still 4.84% on November 5, which keeps pressure on assets that pay no interest, like Bitcoin and gold. A higher risk-free yield means investors give up more potential income by holding them.
Additionally, the dollar has strengthened significantly. The Invesco DB US Dollar Index Bullish Fund, which tracks the dollar against major currencies, rose 7.8% this year through November 6. Since both Bitcoin and gold are priced in dollars, a stronger dollar makes them more expensive for foreign buyers, which tends to reduce demand.
Meanwhile, AI stocks have attracted speculative money. Earlier this year, Bilello pointed out that 20 stocks in the S&P 500 had doubled in value, 19 of them related to AI, and on November 7 he called that run a speculative mania.
Investor Jordi Visser said on the Pomp Podcast on November 7 that Bitcoin’s volatility has stayed around 30 for most of the year, while AI stocks have run much higher. So traders seeking big price moves have favored chip stocks, even as Bitcoin started trading like a tech stock again.
Bitcoin Lost Its ETF Buyers While Gold Unwound a Historic Run
Spot Bitcoin ETFs have turned into net sellers. From November 2 to November 6, the U.S. funds, which hold Bitcoin for stock-market investors, saw $1.28 billion in net outflows. When investors redeem their shares, the funds sell Bitcoin, putting direct selling pressure on the market.
That’s a notable shift from 2022, when Federal Reserve rate hikes hurt Bitcoin but gold held firm, sparking the debate over which asset is the better inflation hedge. Bitcoin had no U.S. spot ETFs then, and in 2026 those funds gave large holders a quick exit.
Gold started 2026 after a remarkable rally, rising from $2,626 at the beginning of 2025 to $4,320 at the end of that year before peaking at $5,518 on January 28. However, gold traded at $4,056 on November 8, 26.5% below its peak, so much of its 2026 loss looks like profit-taking after the spike.
Bitcoin Broke Its Short-Term Averages but Still Holds the 200-Day

Bitcoin trades 5.3% below its 20-day average of $79,005 and 8.2% below its 50-day average of $81,760, so its short-term trend points down. However, it still holds 2.5% above its 200-day average of $73,177, a long-term trend line that buyers commonly defend.
Other cryptocurrencies have fared even worse. Ethereum (CRYPTO: ETH) dropped 4.6% over 24 hours to $2,134, just below its 200-day average of $2,155, while Solana (CRYPTO: SOL) slid 2.8% to $87. Smaller coins tend to be more volatile and are often hit harder than Bitcoin when investors pull back. Bilello’s ranking covers broad asset classes and leaves them out, so the table below adds them.
| Asset | 2026 Return | Through |
|---|---|---|
| Bitcoin | -14.3% | November 9 |
| Ethereum | -28.2% | November 9 |
| Solana | -30.4% | November 9 |
| Gold (SPDR Gold Shares, NYSEARCA: GLD) | -6% | November 6 |
| S&P 500 (SPDR S&P 500 ETF Trust, NYSEARCA: SPY) | +7.8% | November 6 |
| Nasdaq 100 | +6.8% | November 6 |
| Oil (United States Oil Fund) | +114.6% | November 6 |
| U.S. dollar | +7.8% | November 6 |
Over a longer stretch, Bitcoin is up 10,587% over the last decade, compared to 313% for the S&P 500 and 199% for gold, which is why long-run comparisons with the S&P 500 still favor Bitcoin.
Gold has started to recover, with SPDR Gold Shares rising 1.3% early on November 9 and 6.1% over the week. Tokenized gold, crypto tokens backed by physical gold like Tether Gold and PAX Gold, ranked among the top weekly gainers in the crypto market, while Bitcoin has yet to join the recovery.
Why Are Bitcoin and Gold Both Falling in 2026?
Bitcoin and gold are both falling in 2026 because investors preferred the dollar, high bond yields, and AI stocks, while gold is unwinding a historic spike and Bitcoin is losing its ETF buyers. Visser argued on November 7 that falling oil prices and lower inflation expectations have Bitcoin near a corrective low at its 200-day average, but that view needs fresh buying that hasn’t arrived yet.
Bitcoin likely needs ETF buyers back to stay above its 200-day average of $73,177, because fund outflows are the clearest source of selling this month. A daily close below that level, while weekly ETF flows stay negative, could deepen Bitcoin’s 14.3% year-to-date loss. A close back above the 20-day average of $79,005, with ETF inflows returning, would suggest the sellers have run out of momentum.
Contact [email protected] for any questions or corrections.
Sam Daodu is a crypto analyst and the editor of 24/7 Wall St.'s Crypto Desk, where he covers Bitcoin, XRP, Ethereum, Solana and the altcoins investors search for most. His work focuses on price levels, spot ETF flows, on-chain data and the regulatory decisions that move crypto markets, written so a first-time buyer and a seasoned trader can both use it.
Sam has written about crypto professionally since 2019 and has published more than 2,000 articles. Before joining 24/7 Wall St., he wrote for crypto media outlets and Web3 companies and ghostwrote for crypto founders and token launches. His analysis is syndicated on Yahoo Finance, MSN and AOL and has been cited by other crypto news sites. He also founded MacLabs Marketing, a content and personal branding agency for crypto founders and executives.
When he isn't reading charts, Sam is usually at the gym or watching One Piece, a series he maintains has better tokenomics than most altcoins.