Your Advisor Collects 1% Every Year Whether You Make Money or Not. These 3 ETFs Fire the Middleman and Pay You Instead
A quiet 1% fee compounds into a six-figure retirement leak most investors never notice, and three low-cost ETFs are built to plug it. The question is whether firing your advisor actually costs you more than keeping one.

This post may contain links from our sponsors and affiliates, and Flywheel Publishing may receive compensation for actions taken through them.

Your advisor sends you a quarterly report, takes you to lunch once a year, and quietly deducts 1% of your portfolio regardless of how the market performs. On a $500,000 account, that is $5,000 a year. As your portfolio grows, so does the dollar amount of the fee.
For investors looking for a cheaper alternative, the Vanguard Total Stock Market ETF (NYSEARCA:VTI), Pacer US Cash Cows 100 ETF (CBOE:COWZ), and VanEck Morningstar Wide Moat ETF (CBOE:MOAT) provide broad market exposure, a free-cash-flow strategy, and exposure to companies with durable competitive advantages. Together, they offer a relatively simple way to build a diversified equity portfolio without paying an ongoing 1% advisory fee.
The Real Cost of a 1% AUM Fee
The FINRA National Financial Capability Study found that 20% of investors do not think they pay fees of any kind, while another 18% do not know how much they pay. That matters because a 1% assets-under-management fee can look insignificant when viewed one year at a time.
The long-term cost is much larger. Over 30 years, the drag can eat six figures out of a mid-sized retirement account. Low-cost ETFs set a much lower baseline. As financial commentator Clark Howard has noted, “ETFs charging around 0.03% annually make the cost of owning a diversified portfolio extremely small.” An advisor charging substantially more needs to provide enough additional value through financial planning, tax strategy, behavioral coaching, or other services to justify the difference.
VTI: The Entire US Market for Pocket Change
VTI is the logical core of the portfolio. One investment provides exposure to thousands of US stocks across large-, mid-, and small-cap companies. Its expense ratio is just 0.03%, or roughly $3 annually for every $10,000 invested.
The performance has also been strong. VTI is up 13.83% year to date, 21.91% over the past year, and 240.62% over the past 10 years. It pays quarterly dividends, with trailing 12-month distributions totaling $3.8999 per share. Its second-quarter 2026 distribution was $1.0437, up from $0.9982 the previous quarter.
VTI does not attempt to identify which sector, company, or investing style will outperform next. It simply gives you exposure to nearly the entire US stock market at a very low cost. For many long-term investors, that is enough to serve as the foundation of a portfolio.
COWZ: Get Paid Like an Owner
COWZ takes a more selective approach. The fund screens the Russell 1000 for 100 companies with high free cash flow yields. Free cash flow is the cash remaining after a company covers its operating expenses and capital expenditures. It can then be used for dividends, share repurchases, acquisitions, or debt reduction.
QUALCOMM is the fund’s largest holding at 2.67%, followed by ConocoPhillips at 2.17% and CVS Health at 2.16%. Other holdings include Pfizer, Bristol Myers Squibb, AT&T, and Verizon. The result is a portfolio tilted toward established companies generating substantial cash relative to their valuations.
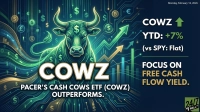
COWZ holds roughly $18.2 billion in net assets and has trailing 12-month distributions of $1.238425 per share. The ETF is up 16.94% year to date and 28.55% over the past year. Its roughly 0.49% expense ratio is considerably higher than VTI’s, but investors are paying for a rules-based free-cash-flow strategy rather than simple market-cap-weighted exposure.
MOAT: Buy the Businesses Competitors Cannot Touch
MOAT owns roughly 40 to 50 US companies that Morningstar determines have a wide economic moat, meaning a durable competitive advantage expected to persist for at least 20 years. The strategy also considers valuation, seeking companies trading below Morningstar’s estimate of fair value.
Those competitive advantages can come from several sources, including strong brands, network effects, patents, cost advantages, and high switching costs. Instead of requiring investors to identify those characteristics company by company, MOAT packages the strategy into a single ETF.
MOAT is up 9.14% year to date, 19.17% over the past year, and 269.19% over the past 10 years. Its most recent annual distribution was $1.4038 per share on December 22, 2025, up from $1.2675 the previous year. The fund charges an expense ratio of roughly 0.46%.
The trade-off is concentration. MOAT owns far fewer companies than VTI and relies on Morningstar’s methodology for identifying both competitive advantages and attractive valuations. That creates more potential to outperform the broader market, but also more potential to lag it.
The Trade-Off You Should Hear
There is more to financial advice than selecting investments. A good advisor can help with taxes, retirement withdrawals, estate planning, and keeping you from making costly decisions during market declines. Those services can justify paying for professional advice.
But if you are paying 1% primarily for portfolio management, these three ETFs show how cheaply much of that work can be replicated. Investors who still want professional guidance can also consider an hourly or flat-fee planner rather than paying a percentage of their portfolio every year.
Contact [email protected] for any questions or corrections.
Ryne Mauck is an investment writer covering exchange-traded funds, retirement planning, and portfolio strategy. Through his work at 24/7 Wall St. and other investment platforms, including Seeking Alpha, he aims to provide clear, research-driven insights that help investors make more informed decisions while maintaining a long-term approach to investing.
Ryne holds a B.Sc. in Finance and an M.A. in Political Science. He is a formerly registered Municipal Advisor Representative and has passed the Series 50, Series 63, and Series 65 exams. His articles are not intended to be, nor should they be interpreted as, financial advice.