The Diversification You Think You Bought: How VGT’s Top 3 Holdings Put a $250,000 Position at Risk
VGT holds hundreds of technology stocks, but the number of holdings tells a very different story than where your money actually ends up. Before putting a quarter million dollars into this fund, there is a concentration question most investors never…

This post may contain links from our sponsors and affiliates, and Flywheel Publishing may receive compensation for actions taken through them.

Buy the Vanguard Information Technology Index Fund ETF (NYSEARCA:VGT) and you get exposure to hundreds of technology stocks in a single fund. With a low expense ratio and a long track record, VGT looks like a straightforward way to own the technology sector. However, the diversification is not as broad as the number of holdings suggests. A significant portion of your investment ultimately depends on just three companies.
What You’re Actually Paying
The headline fee is small. VGT’s expense ratio is 0.09%, or roughly $9 per year for every $10,000 invested. On a $250,000 position, that works out to about $225 annually. Even compounded over 20 years against a hypothetical zero-fee alternative, the difference is relatively modest.
The bigger consideration is concentration. VGT tracks a market-cap-weighted technology index, which means the largest technology companies receive the largest allocations. After years of mega-cap tech outperformance, that has left a substantial portion of the portfolio concentrated in a handful of stocks.
The Part the Factsheet Doesn’t Highlight
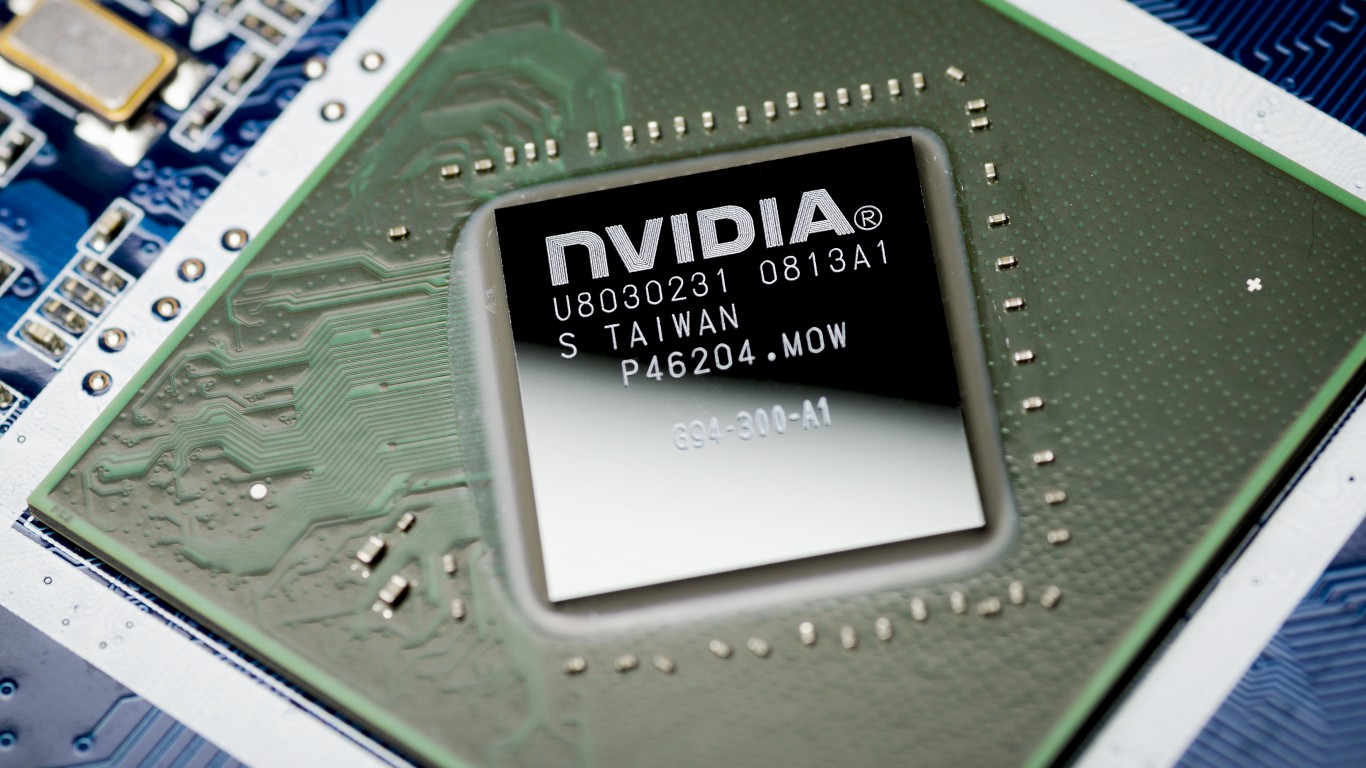
VGT tracks a market-cap-weighted MSCI tech benchmark. Its closest peer, the Fidelity MSCI Information Technology ETF (NYSEARCA:FTEC), shows just how concentrated this segment of the market has become. In its most recent NPORT filing, NVIDIA accounts for 17.97% of assets, Apple represents 14.36%, and Microsoft accounts for another 9.53%. Together, those three companies represent 42.36% of the portfolio. VGT’s construction leaves it similarly concentrated in the same names (NVIDIA at 16.10%, Apple at 14.33%, and Microsoft at 8.28%).
Applied to a $250,000 investment, roughly $100,000 could effectively depend on just three companies. NVIDIA alone carries a $5.27 trillion market capitalization and a beta of 2.215, meaning the stock has historically been considerably more volatile than the broader market. Microsoft, meanwhile, trades at roughly 28 times trailing earnings while continuing to spend heavily on AI infrastructure.
That creates another layer of concentration. NVIDIA supplies the chips powering much of the AI buildout, while Microsoft is one of the largest buyers of that infrastructure. A meaningful slowdown in AI capital spending could therefore pressure multiple major VGT holdings at the same time.
There is also the portfolio overlap to consider. If you already own an S&P 500 or total-market index fund, you already have substantial exposure to NVIDIA, Apple, and Microsoft. Adding VGT does not necessarily provide more diversification. Instead, it increases your allocation to many of the same mega-cap technology companies you already own.
The Cheaper Mirror
Two comparable alternatives cover similar ground:
- FTEC from Fidelity has an expense ratio near 0.08% and holds 300+ positions against the same MSCI tech family. Top-3 concentration is essentially identical, and the fee runs a hair below VGT’s 0.09%.
- The iShares US Tech ETF (NYSEARCA:IYW) tracks US tech under a different index (Russell 1000 Technology RIC 22.5/45 Capped Index). NVIDIA, Apple, and Alphabet make up 44.03% of that fund. Different label, same mega-cap problem.
The trade-off is straightforward. Cheaper mirrors do not fix the concentration. To actually diversify, you need a broader index (a total-market fund) or an equal-weight tech product, which gives you a different exposure profile rather than a cheaper version of the same one.
What This Means for You
None of this takes away from VGT’s long-term performance. The fund is up 27.83% year to date, while its 10-year total return sits at 795.33%. However, much of that performance has been driven by the same mega-cap technology stocks that now dominate the portfolio. NVIDIA alone has gained 996.42% over five years, while Microsoft is up 81.16%.
That concentration has worked extremely well while mega-cap technology stocks have led the market. The risk is assuming that owning hundreds of stocks automatically means your money is evenly diversified across them. Before putting $250,000 into VGT, the more useful question is how much additional exposure you actually want to NVIDIA, Apple, and Microsoft, especially if you already own them through an S&P 500 or total-market fund.
Contact [email protected] for any questions or corrections.
Ryne Mauck is an investment writer covering exchange-traded funds, retirement planning, and portfolio strategy. Through his work at 24/7 Wall St. and other investment platforms, including Seeking Alpha, he aims to provide clear, research-driven insights that help investors make more informed decisions while maintaining a long-term approach to investing.
Ryne holds a B.Sc. in Finance and an M.A. in Political Science. He is a formerly registered Municipal Advisor Representative and has passed the Series 50, Series 63, and Series 65 exams. His articles are not intended to be, nor should they be interpreted as, financial advice.