How Much of Your Portfolio Should Actually Be in FTXL
Most retirement investors already hold a concentrated chip bet without knowing it, and adding FTXL can quietly double down on the same handful of names. Getting the sizing right separates a smart tilt from a sector gamble that distorts your…

This post may contain links from our sponsors and affiliates, and Flywheel Publishing may receive compensation for actions taken through them.

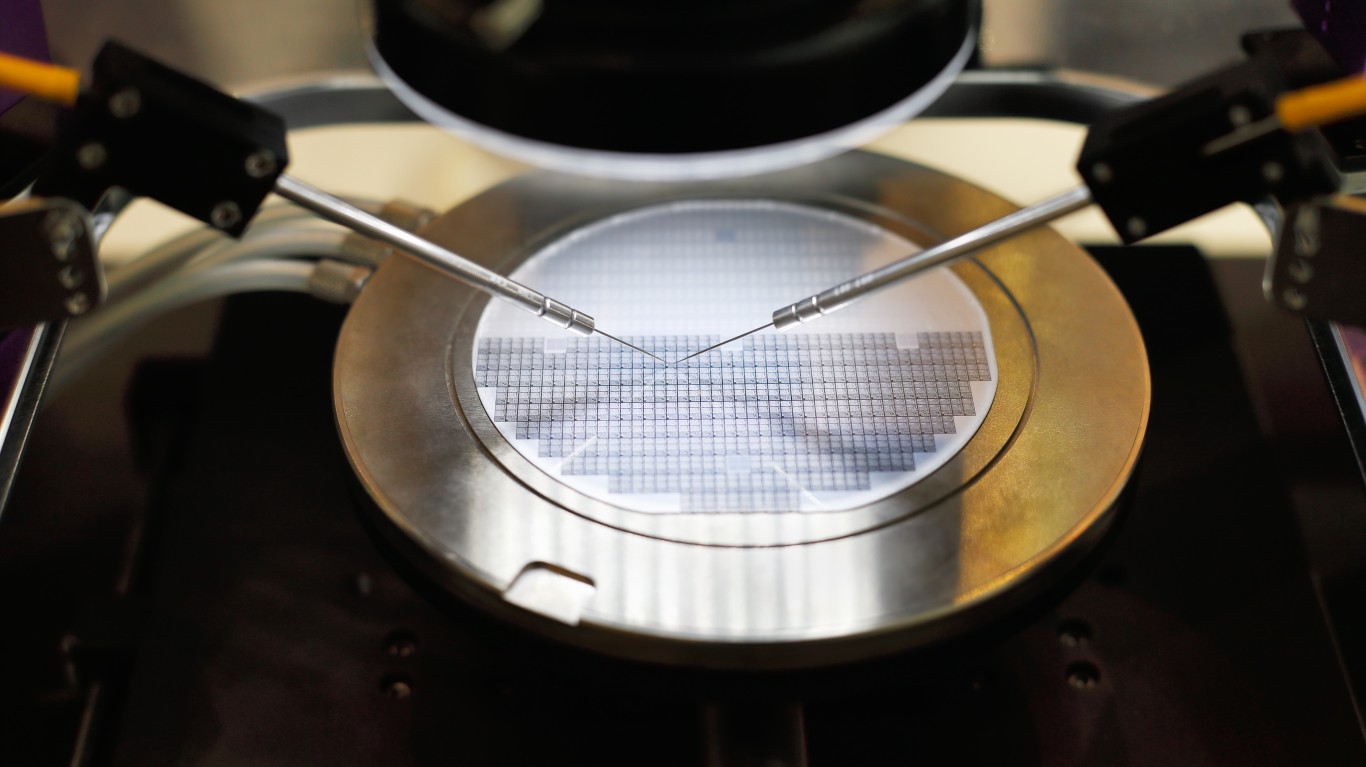
Semiconductor exposure is the most concentrated bet most retirement investors already own without realizing it, because chipmakers dominate the top of both the S&P 500 and Nasdaq-100. That reality is what makes sizing the First Trust Nasdaq Semiconductor ETF (NASDAQ:FTXL) a genuine portfolio decision rather than a simple allocation. FTXL is designed for investors who want to tilt further into chips using a factor-screened basket, but the fund’s 134% one-year run and 76% year-to-date move mean the sizing question matters far more than the buy decision.
What FTXL Is Actually Built to Do
FTXL tracks the Nasdaq US Smart Semiconductor Index, a rules-based basket that applies AlphaDEX-style growth, value, and volatility screens on top of the Nasdaq semiconductor universe. The screens push weight toward names the factor model favors rather than pure market cap. In practice you still end up with a roster led by the megacaps: NVIDIA, Broadcom, and Intel each near 8%, followed by QUALCOMM, Micron, and Marvell. The fund holds about $1.48 billion in net assets across roughly 30 chip names, spanning designers, foundry customers, and equipment makers like Applied Materials, KLA, and Lam Research.
The return engine is straightforward: capital appreciation from a cyclical, capex-driven industry. Dividends are incidental. You are buying the AI infrastructure buildout, memory pricing, and equipment orders, wrapped in a factor screen that periodically rebalances toward the names scoring best on growth and value.
Does It Actually Beat the Obvious Alternative
The real test is FTXL against iShares Semiconductor ETF (NASDAQ:SOXX), the default chip ETF most investors reach for. Over one year, FTXL returned 134% versus SOXX at 115%. Over ten years, SOXX’s 1,497% outpaces FTXL’s 1,099%. Translation: the AlphaDEX screens have added value in the current AI cycle but historically lagged a plain market-cap approach.
Both trounce the broader indexes. SPY returned 249% over ten years, while QQQ returned 506% over the same window. That premium is what you are paying for with chip concentration, and it comes with volatility to match. Investors who want AI exposure without piling further into the same six chip names can look at the power, cooling, and networking suppliers we profiled in a free report on seven non-chipmaker AI infrastructure plays.
Overlap Problem Retirees Keep Missing
Anyone holding an S&P 500 or Nasdaq-100 index fund already owns meaningful positions in NVIDIA, Broadcom, and QUALCOMM. Adding FTXL on top layers a second bet on the same names. Three tradeoffs deserve real weight:
- Single-industry drawdown risk. Semiconductors cycle harder than the broad market. A 30% to 40% peak-to-trough drawdown is a normal event in this sector, and FTXL’s factor screens do not soften that.
- Tax location matters. Because chip names pay small dividends and generate most returns through appreciation, FTXL is reasonably tax-efficient in a taxable account, though the sector’s rebalancing turnover argues for holding it in an IRA when possible.
- Concentration in a handful of tickers. The top six holdings account for roughly 44% of assets. This is a semiconductor bet with a heavy megacap tilt.
Sizing Framework for a Retirement Portfolio
For a retirement-focused investor already holding broad index funds, a 3% to 5% FTXL sleeve is enough to meaningfully tilt toward chips without doubling your exposure to NVIDIA and Broadcom. Investors with a longer runway and higher risk tolerance can justify 7% to 10%, but going beyond that starts to distort the risk profile of a diversified portfolio given the sector’s drawdown history. Anyone under five years from drawing on the portfolio should probably cap the position at 3% or use SOXX instead for its longer track record and lower factor-model risk. FTXL earns a place as a satellite holding, and it belongs in an IRA before a taxable account when the choice exists.
Contact [email protected] for any questions or corrections.
Austin Smith is a financial publisher with over two decades of experience as an investor, analyst, and advisor. He covers stocks, ETFs, Artificial intelligence and personal finance for 24/7 Wall St. Previously, he spent over a decade at The Motley Fool as a senior editor for Fool.com, portfolio advisor for Millionacres, and launched The Ascent to help reader take control of their personal finances.
His work has been featured on Fool.com, NPR, CNBC, USA Today, Yahoo Finance, MSN, AOL, Marketwatch, and many other publications. He is as an advisor to private companies, and co-hosts The AI Investor Podcast with Eric Bleeker.
When not looking for investment opportunities, he can be found skiing, running, or playing soccer with his children. Learn more about Austin's investment approach here.