VTI’s 0.03% Fee Hides the Real Cost: 3,600 Stocks and Still a Third of Your Money in Ten Companies
VTI's rock-bottom fee gets all the attention, but there's a second cost buried in the fund's structure that most investors never think to check before they buy.


You bought Vanguard Total Stock Market ETF (NYSEARCA:VTI) because the 0.03% fee promised the entire US market for pennies. The advertised fee is real. So is the part Vanguard’s homepage buries: 33.22% of every dollar in the fund currently sits inside just ten companies, and those ten are already the largest, most crowded trades in the US market.
Real Dollar Cost of the Cheap Fee
At a 0.03% expense ratio, VTI collects roughly $3 a year on every $10,000 invested. Held for 20 years against a 0.75% actively managed peer, that fee gap alone could save you thousands in compounded drag. On raw sticker cost alone, VTI wins decisively.
That is the story the sponsor wants front and center. The mechanical cost of ownership is genuinely low. What the factsheet does not put in bold is the second cost baked into how the underlying index gets built.
Where a Third of Your Money Actually Sits
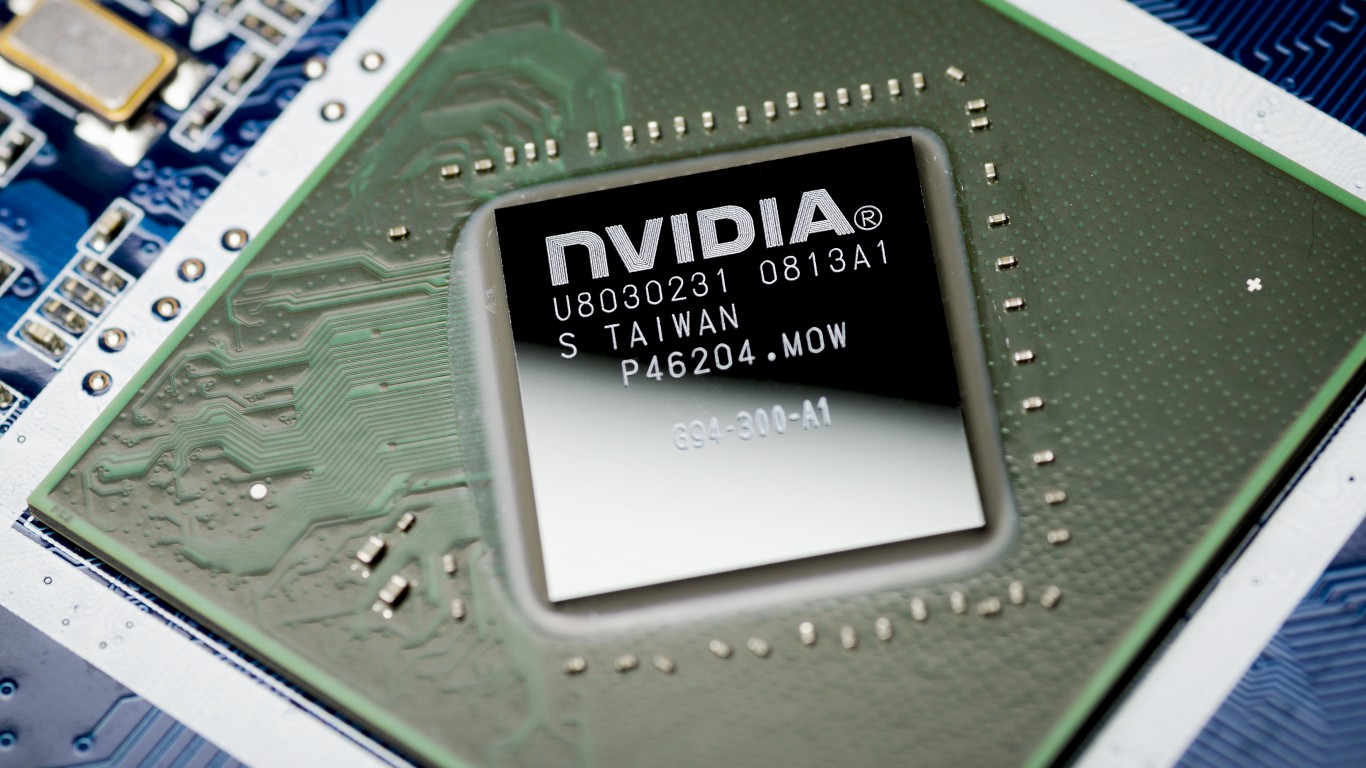
VTI holds more than 3,500 stocks, a number that sounds like diversification by any reasonable definition. Under the hood, though, it runs on market-cap weighting. The top ten holdings currently absorb 33.22% of assets, and NVIDIA alone occupies roughly 6.4% of the fund. That leaves roughly two-thirds of your money spread across about 3,490 remaining companies, most of them carrying weights measured in basis points.
The performance profile shows the tilt. VTI is up 18.51% over the past year and 12.47% year to date through August 24, 2026, with a ten-year total return of 238.06%. Those are solid return numbers. But they also read largely as a story about mega-cap tech. If AI-linked names correct, your “total market” position corrects with them. The 3,000-plus small and mid-caps in the long tail carry too little weight to cushion the fall.
Tax Drag and the Distribution Signal
Concentration bleeds into the payout. VTI’s trailing twelve-month distribution is $3.8999 per share, tracking a forward annualized rate of $4.1748. On a price near $377.60, that is a thin yield. Mega-cap tech pays little income, so the “total market” distribution you receive is dictated by the same ten names driving the concentration risk. Investors leaning on VTI for retirement cash flow are effectively income-starved by that top-heavy weighting.
Cheaper Mirrors of the Same Market
Near-identical exposure exists in similar or lower-cost funds. iShares Core S&P Total U.S. Stock Market ETF (NYSEARCA:ITOT) and Schwab U.S. Broad Market ETF (NYSEARCA:SCHB) each track total-market benchmarks at expense ratios in the 0.03% neighborhood, with heavily overlapping holdings.
Fidelity ZERO Total Market Index Fund (NASDAQ:FZROX) charges 0% for Fidelity brokerage clients, with the trade-off that it cannot be transferred to another broker in kind.
If your real concern is the top-ten weight rather than the sticker fee, Invesco S&P 500 Equal Weight ETF (NYSEARCA:RSP) gives every constituent roughly the same slice, breaking the mega-cap grip. Expect a higher fee, a different sector mix, and periods of underperformance when large caps lead. That is the trade-off for lower concentration.
What This Means for You
The question worth asking before your next contribution is simple. Are you buying the total US market, or are you buying whichever ten mega caps currently sit on top of it? Right now, roughly a third of every dollar in VTI goes to the same ten names, and the fee you saved is small change compared with the concentration you may not have realized you owned. Riding a top-heavy market is fine if you have thought through the exit, and we put both halves of that question in a free handbook here: The Bubble Survivor’s Handbook.
Contact [email protected] for any questions or corrections.
Ryne Mauck is an investment writer covering exchange-traded funds, retirement planning, and portfolio strategy. Through his work at 24/7 Wall St. and other investment platforms, including Seeking Alpha, he aims to provide clear, research-driven insights that help investors make more informed decisions while maintaining a long-term approach to investing.
Ryne holds a B.Sc. in Finance and an M.A. in Political Science. He is a formerly registered Municipal Advisor Representative and has passed the Series 50, Series 63, and Series 65 exams. His articles are not intended to be, nor should they be interpreted as, financial advice.