You Saved $1.2 Million but Nobody Will Tell You What You Can Safely Spend Each Month. These 4 ETFs Answer With a Deposit
Twelve years of disciplined saving built a $1.2 million balance, but your advisor's withdrawal chart still cannot tell you what hits your account next month. Four ETFs reframe that question entirely.

This post may contain links from our sponsors and affiliates, and Flywheel Publishing may receive compensation for actions taken through them.

You have already done the hard work — twelve years of maxing out contributions and avoiding unnecessary spending. Now you have $1.2 million sitting in a brokerage account and one simple question nobody will answer straight: how much can I actually spend each month? Your advisor may pull out a chart and talk about “safe withdrawal rates,” but you are left with questions. Four ETFs provide you with the answer you need — a regular deposit. The JPMorgan Nasdaq Equity Premium Income ETF (NASDAQ:JEPQ), the NEOS Nasdaq-100 High Income ETF (NASDAQ:QQQI), the Global X U.S. Preferred ETF (NYSEARCA:PFFD), and the ProShares S&P 500 Dividend Aristocrats ETF (CBOE:NOBL) each turn your balance into cash flow instead of just a projection.
Baseline Answer Nobody Wants to Repeat
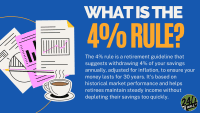
The classic rule pulls roughly 4% a year from a diversified portfolio and calls it safe across a 30-year retirement. On $1.2 million, that is the number most planners default to. It works as a projection, but it is not a paycheck (we made the fuller case against leaning on that number, and what to run instead, in a free report on why the 4% rule is broken).
withdrawal-rate portfolio_value=1200000 withdrawal_rate=4 rate=6 time=30
An income-tilted sleeve reframes the question. An income-tilted sleeve shifts the focus to what the funds actually deposit each month.
JEPQ: Monthly Check Backed by Big Tech
JEPQ is JPMorgan’s active take on Nasdaq income. It owns a portfolio anchored by names like NVIDIA, Apple, Micron, and Alphabet, then writes call options for premium. That premium is what turns growth names into cash flow. Payments arrive monthly: the September 3, 2026 distribution came in at $0.68255 per share, and trailing 12-month payouts totaled $6.76379 per share. Shares closed at $59.87 on September 4, 2026, up 11.58% year to date and 20.68% over the past year. Fund size sits near $40.7 billion in net assets.
QQQI: Higher Income With a Tax-Efficient Wrinkle
QQQI is NEOS’s answer to the same problem with a tax angle. The fund holds a similar Nasdaq-100 lineup, led by the same names, and layers NDX index options on top. The August 21, 2026 distribution paid $0.6518 per share, with $7.648285 per share over the trailing 12 months on a fund trading at $54.75 (up 11.66% year-to-date). NEOS’s Form 8937 disclosed that roughly 94% to 99% of each monthly dividend during fiscal year 2025 was classified as nontaxable return of capital under IRC 301 and 316. That defers tax and lowers your cost basis instead of hitting your 1099-DIV as ordinary income.
PFFD: Preferred Stock for the Middle of the Barbell
PFFD swaps common stock for preferred shares (the hybrid securities that sit above equity and below bonds). Global X’s portfolio holds preferreds from Boeing, Wells Fargo, Citigroup Capital, KKR, NextEra Energy, Southern Company, and Bank of America, among many other financial and utility issuers. The distribution is a steady $0.10 per share per month, or $1.20 over the trailing 12 months, on a fund trading at $18.26. The trade shows up in the price: PFFD is up 0.76% year-to-date and 0.49% over one year. You are buying coupon income; capital appreciation is minimal. Fund size is roughly $2.17 billion.
NOBL: Dividend Growth as Your Shock Absorber
NOBL is the defensive sleeve of the portfolio. It tracks the S&P 500 Dividend Aristocrats, companies with at least 25 straight years of rising payouts, and the holdings read exactly like you would expect: Coca-Cola, Procter & Gamble, Johnson & Johnson, McDonald’s, Walmart, AbbVie, and Nucor, each around 1% to 2% of holdings. One caveat for cash-flow planning: NOBL pays quarterly, not monthly, with the June 30, 2026 distribution at $0.303711 per share and trailing 12-month payouts of $2.025885. Shares closed at $57.70, up 12.04% year-to-date and 12.69% over one year. AUM is about $11.07 billion. You accept a lower current yield in exchange for a rising payout stream.
Trade-Offs to Say Out Loud
None of this is free money. Covered-call funds like JEPQ and QQQI cap your upside in a strong Nasdaq rally, and their NAVs can erode over time as option premium is paid out as distributions. QQQI’s return-of-capital treatment is tax-efficient, but part of the distribution is your own money coming back to you, reducing basis on the way. PFFD’s flat price action is the real face of interest-rate sensitivity in preferreds. NOBL’s yield is modest compared with the option-income names. Put the four together, size the sleeve to the deposit you actually need, and the account starts answering the question the withdrawal chart never quite does.
Contact [email protected] for any questions or corrections.
Ryne Mauck is an investment writer covering exchange-traded funds, retirement planning, and portfolio strategy. Through his work at 24/7 Wall St. and other investment platforms, including Seeking Alpha, he aims to provide clear, research-driven insights that help investors make more informed decisions while maintaining a long-term approach to investing.
Ryne holds a B.Sc. in Finance and an M.A. in Political Science. He is a formerly registered Municipal Advisor Representative and has passed the Series 50, Series 63, and Series 65 exams. His articles are not intended to be, nor should they be interpreted as, financial advice.