Only 3 Numbers Really Matter for Retirement — Do You Know Yours?
Are you ready to retire? The answer comes down to three concrete numbers: your investment account balance, your projected Social Security benefit, and your annual spending. Here is what each number means, how they interact, and what the latest research…

This post may contain links from our sponsors and affiliates, and Flywheel Publishing may receive compensation for actions taken through them.

Deciding whether you are ready to retire can feel overwhelming, but the question ultimately comes down to three concrete numbers. Get a clear handle on all three and the answer becomes much easier to see.
Here is what those numbers are and why each one carries so much weight.
1. Investment account balance
The first number you need to know is your total investment account balance: the combined value of your 401(k), IRA, and any taxable brokerage accounts. These savings will supplement your Social Security income once you stop working, which makes knowing the precise figure essential. Tax treatment matters just as much as the raw balance. A dollar in a traditional 401(k) will eventually shrink by income taxes at withdrawal, while money in a Roth IRA comes out entirely tax-free. The two accounts may show the same number on paper, but they are worth different amounts in practice.
Once you know your total balance, a safe withdrawal rate tells you how much annual income those savings can reliably produce. Morningstar’s 2025 “State of Retirement Income” research sets the base-case safe starting withdrawal rate at 3.9% for a portfolio holding 20% to 50% in equities, assuming a 30-year retirement horizon with a 90% probability of success. That rate climbed from 3.7% in the prior year’s research, driven by improved capital markets assumptions across nearly every asset class. For a retiree with $850,000 saved, the 3.9% figure translates to roughly $33,150 in first-year income from savings alone.
Morningstar also found that flexible strategies, including a guardrails spending approach, delaying Social Security, or incorporating Treasury Inflation-Protected Securities, can push the starting withdrawal rate as high as 5.7% for retirees willing to adjust their spending as market conditions shift. The classic 4% rule remains a widely cited benchmark, but those who want the greatest margin of safety may prefer the slightly more conservative Morningstar figure. Those comfortable making dynamic adjustments in down markets can often stretch their withdrawal rate meaningfully higher.
2. Social Security benefit
The second number is your projected Social Security benefit. This monthly payment stands apart from a portfolio balance because it is guaranteed to last for life and automatically adjusts for inflation each year. For 2026, the Social Security Administration announced a 2.8% cost-of-living adjustment, raising the average retired worker’s monthly benefit from approximately $2,015 to about $2,071. That increase of roughly $56 per month reflects the COLA tied to changes in the Consumer Price Index for Urban Wage Earners and Clerical Workers, and it marks the fifth consecutive year with a COLA of at least 2.5%, the longest such streak since the 1990s.
Social Security is designed to replace roughly 40% of pre-retirement income, though the actual share varies by earner. The formula is progressive, so higher earners see a smaller percentage replaced. Timing matters just as much as the formula itself. Claiming benefits before your full retirement age permanently reduces each monthly check, while waiting past full retirement age earns delayed retirement credits worth roughly 8% for every year you hold off, up to age 70. For those expecting a long life, or for married couples trying to maximize the survivor benefit, delaying almost always pays off.
Calculating your personal breakeven point for waiting until 70 can clarify whether the larger monthly checks eventually outweigh the years of missed payments. You can find your personalized estimate through your online Social Security account, which projects your monthly payment at different claiming ages. The size of this benefit directly shapes how much your savings need to carry.
3. Annual expenditures
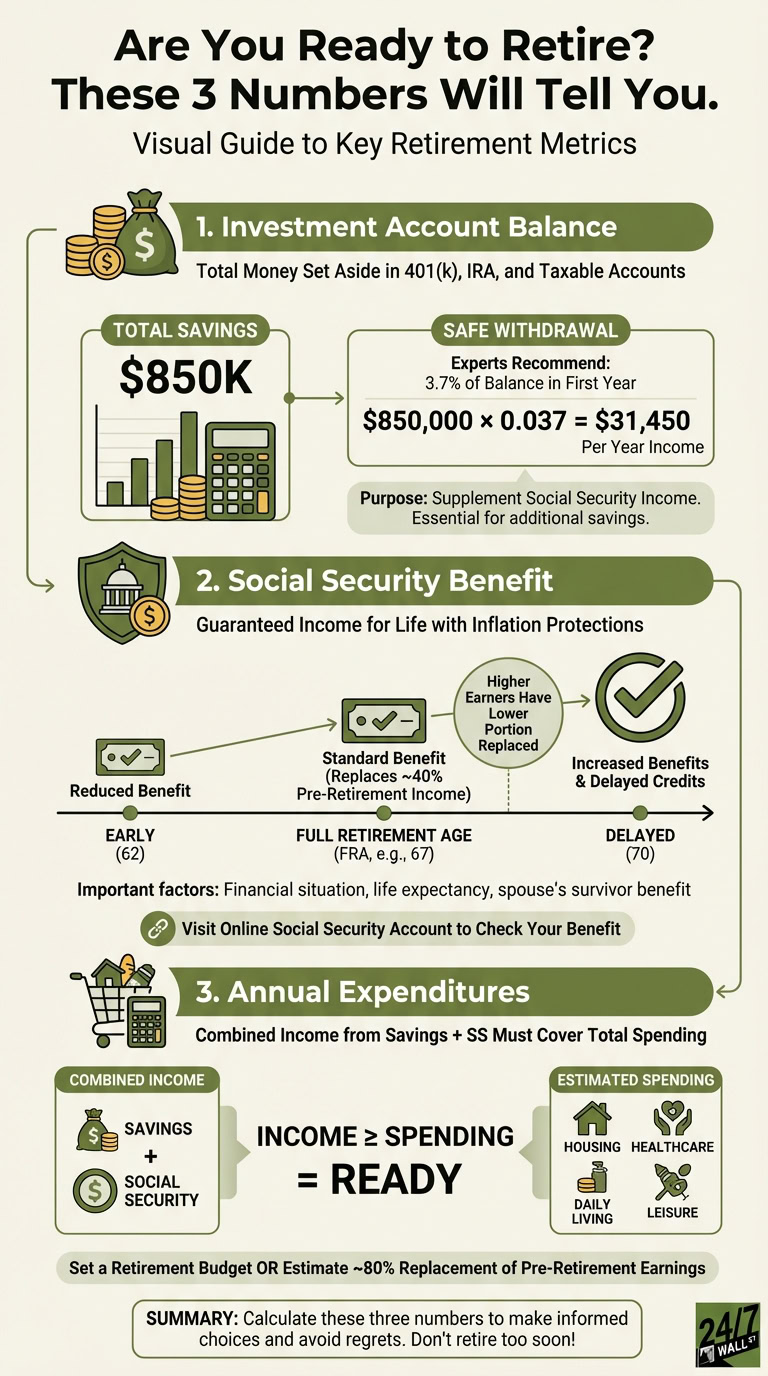
The third number is your projected annual spending. Your combined income from Social Security and savings must cover everything you plan to spend in retirement, including costs that many people consistently underestimate. Healthcare deserves particular attention. Fidelity’s 25th annual Retiree Health Care Cost Estimate, released in July 2026, puts lifetime medical expenses for a single 65-year-old retiring in 2026 at $185,500, a jump of 7.5% from the prior year’s estimate of $172,500. That increase reflects rising medical prices, growing utilization of healthcare services, and higher costs tied to chronic conditions. The estimate does not include long-term care. For a couple, the comparable 2026 figure reaches $371,000.
Medicare costs add another layer of annual pressure. The 2026 Medicare Part B standard premium is $202.90 per month, an increase of $17.90 from the 2025 rate of $185.00. The annual Part B deductible rose to $283 in 2026, up $26 from $257 in 2025. Looking ahead, the 2026 Medicare Trustees Report projects the Part B premium will climb to approximately $209.50 per month in 2027, with the deductible rising to about $292. Both figures tend to move higher each year, reinforcing why healthcare costs require their own dedicated line in any retirement plan.
A practical starting point for setting your retirement spending target is to aim for enough income to replace about 80% of your pre-retirement earnings. Keep in mind that many retirees follow what researchers call a “spending smile” pattern: outlays are highest in the active early years, ease off during the quieter middle stretch, and then climb again as medical costs rise later in life. A budget that reflects this arc gives a more accurate picture than one that assumes flat annual spending throughout retirement.
Once you have all three numbers in hand, the final step is to stress-test them against sequence-of-returns risk. A severe market decline in the first few years of retirement can permanently deplete a portfolio before it has a chance to recover, even if the long-run average return looks acceptable on paper. Retirees who account for that risk alongside their balance, their benefit, and their budget are far better positioned to leave work on their own terms.
Editor’s note: This pass updated the Fidelity healthcare cost figures to the firm’s 2026 estimate of $185,500 for a single retiree and $371,000 for a couple (up 7.5% from 2025), corrected the Social Security average benefit to the SSA’s official January 2026 figure of $2,071 per month, adjusted the Morningstar equity allocation range from “30% to 50%” to the correct “20% to 50%,” and added the 2026 Medicare Trustees Report projections for 2027 Part B premiums ($209.50) and the deductible ($292).
Contact [email protected] for any questions or corrections.
Christy Bieber has been a personal finance and legal writer since 2008. She has a JD from UCLA School of Law and a BA in English, Media and Communications with a certification in business from the University of Rochester.
Christy has been published by a wide variety of sites, including WSJ Buy Side, Forbes, Kiplinger, Fox Business, Credit Karma, Insurify, and Annuity.org. In addition to writing for the web, she has also ghostwritten textbooks on business and law and served as a subject matter expert for course design.