How Much Do You Need Invested at 55 to Bridge the Gap Until Social Security at 62?
Retiring at 55 sounds like freedom, but seven years without a paycheck or Social Security creates a funding gap that destroys most portfolios before the first benefit check ever arrives. The yield tier you choose now determines whether you cross…

This post may contain links from our sponsors and affiliates, and Flywheel Publishing may receive compensation for actions taken through them.

Retiring at 55 puts you seven years short of Social Security eligibility at 62, and every year you file early permanently trims the benefit. A household budgeting $60,000 a year needs a portfolio that produces that check reliably, without drawing down principal, from age 55 until the first Social Security deposit lands.
One hard rule before the math: traditional IRAs and 401(k)s generally cannot be tapped before age 59½ without a 10% early-withdrawal penalty. The bridge has to come from a taxable brokerage account, Roth contributions (which come out tax- and penalty-free), the Rule of 55 (which applies only to the 401(k) at the employer you separate from in or after the year you turn 55, and never to IRAs), or a 72(t) substantially equal periodic payment plan.
Claiming Social Security at 62 also cuts the benefit by up to 30% versus your full retirement age. That reduction is permanent, so the bigger the bridge portfolio, the more optionality you keep.
Conservative Tier: 3% to 4% Yield
This is the dividend-growth range. Think Dividend Kings and Aristocrats: Johnson & Johnson (NYSE:JNJ | JNJ Price Prediction) yields 2.0% with 64 consecutive years of dividend increases; Procter & Gamble (NYSE:PG) yields 2.9%; Coca-Cola (NYSE:KO) yields 2.4%. A blended dividend-growth ETF typically lands in the 3% to 4% range.
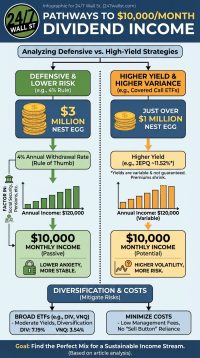
The math: $60,000 divided by 0.035 equals roughly $1,714,000 in required capital.
The tradeoff is the highest capital hurdle, offset by dividend growth that compounds. JNJ lifted its quarterly payout from $1.30 to $1.34 this year, KO went from $0.51 to $0.53, and PG raised to $1.0885. Principal is also most likely to appreciate over a seven-year window.
Moderate Tier: 5% to 7% Yield
Real estate investment trusts, telecoms, preferred shares, and covered-call ETFs live here. Realty Income (NYSE:O) yields 5.2% and pays monthly, which matches how retirees actually budget. Verizon yields 5.9%. Preferred-share ETFs and business development companies often sit in the same band.
The math: $60,000 divided by 0.06 equals $1,000,000.
Capital drops meaningfully, but dividend growth slows. Verizon raised its payout from $0.69 to $0.7075 this year, while Realty Income’s monthly bumps are steady but small. With CPI near a 12-month high, income growth in this tier may lag inflation over the full seven years.
Aggressive Tier: 8% to 12% Yield
Business development companies, mortgage REITs, leveraged covered-call funds, and high-yield bond funds populate this range. Altria yields 6.5% and shows what elevated yield looks like on a still-growing Dividend King, but genuine 10%+ payouts require the more speculative categories.
The math: $60,000 divided by 0.10 equals $600,000. At 12%, closer to $500,000.
The tradeoff is lowest capital, highest risk of principal erosion and distribution cuts. Over seven years, this tier can leave you with less capital when Social Security starts than the day you retired.
Why the Cheap Answer Usually Loses
Lower yields tend to win over multi-year windows. A 3.5% dividend that grows 6% annually roughly doubles the income in about 12 years. A 10% distribution that never grows stays flat, and if it comes from a leveraged strategy, share price often drifts lower. The 10-year Treasury at 4.7% is your risk-free benchmark: if a high-yield strategy can’t beat that on total return, the current yield alone isn’t buying you anything.
Three Moves Before You Pull the Trigger at 55
- Calculate actual annual spending, not your salary. Bridge funding replaces expenses, and pre-retirees frequently overshoot the number by 20% to 30% because they anchor on gross income.
- If you hold a 401(k) at the employer you are leaving at 55, confirm Rule of 55 eligibility with the plan administrator before rolling it to an IRA. Once rolled, that penalty-free access disappears and you are back to 72(t) or waiting until 59½.
- Model the Social Security decision alongside the portfolio. Delaying past 62 erases the permanent 30% haircut, which can shrink the size of the bridge you need to build in the first place.
Contact [email protected] for any questions or corrections.
I am a long time investor and student of business, and believe finding good companies that can become great investments is the best game on earth. After 20 years of writing and researching the public markets it is clear that individuals have never had more tools and information to take control of their financial lives. From ETFs and $0 commissions to cryptos and prediction markets there has never been a greater democratization of access to investing.
I write to help people understand the investments available to them so they can make the best choice for their portfolio, whether they're starting out or looking for income in retirement.