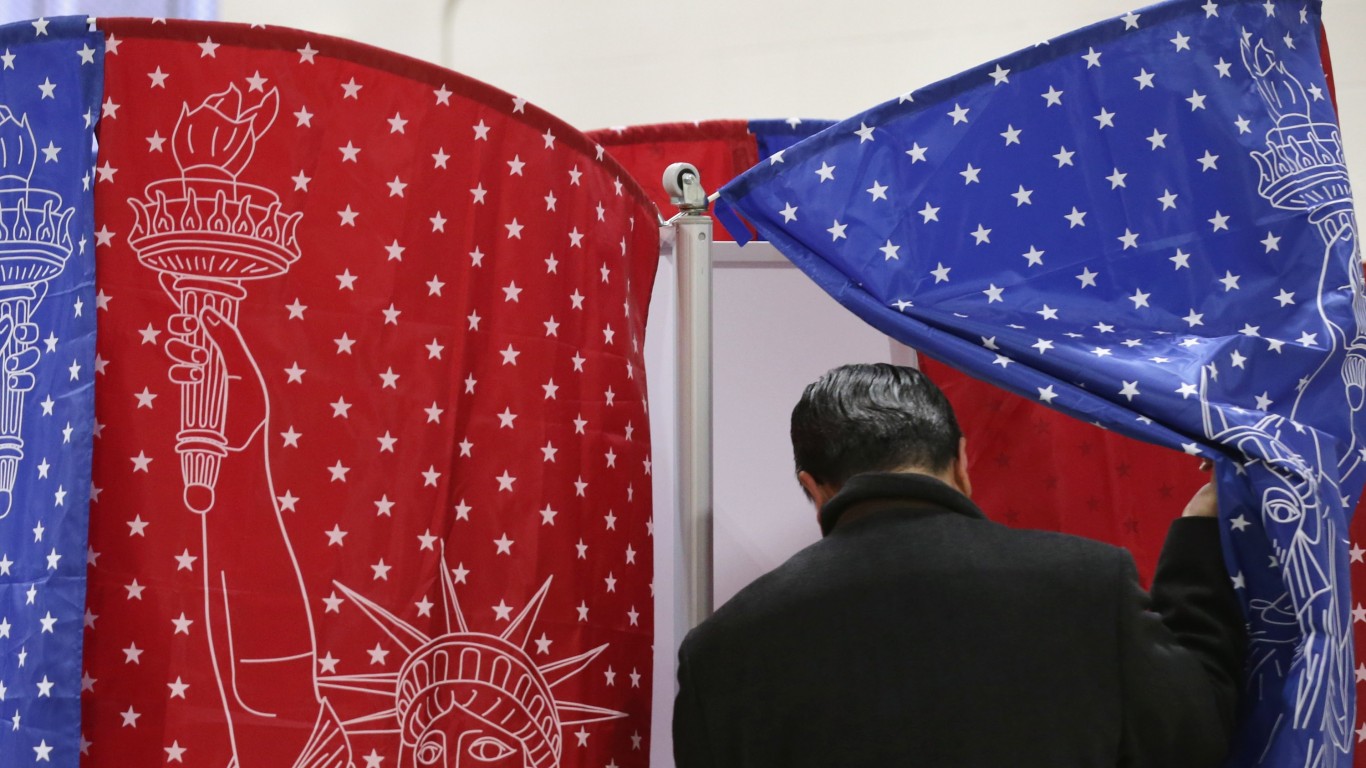
The results of the Iowa caucuses provided a snapshot of voter sentiments in the Midwest. Now, with New Hampshire’s first-in-the-nation primary election slotted for February 9, Americans will hear the first voice from New England. There are currently 28 Democrats and 30 Republicans on the New Hampshire primary ballot.
Voter turnout rates during primary elections fall over time as candidates generate momentum and it becomes clearer who the nominee will ultimately be. Therefore states scheduled to vote earlier in the election process are believed to set the tone for the election season. National attention is given to these states during their elections, and politicians, too, dedicate disproportionately large amounts of time and money to swaying the electorates in these areas.
24/7 wall st. took a close look at New Hampshire’s political climate, both heading into its primary on Tuesday and over the course of its history. How much is really at stake for candidates in this early nominating contest? What unique features of New Hampshire are important to know going into this year’s race?
Click here to see the New Hampshire primary in 9 charts.
Ohio Gov. John Kasich and New Jersey Governor Chris Christie have each invested heavily in New Hampshire, with each presidential candidate staging multiple events and spending large shares of their campaign resources on wooing New Hampshire’s electorate. For these candidates, for whom a weak result on Tuesday could effectively mean elimination, the stakes are indeed higher than ever.
The support a candidate can expect in a given state often varies tremendously. For example, Sen. Ted Cruz may have far more trouble winning over New Hampshire primary voters than Iowa voters, where the electorate is comparatively religious and mirrors Cruz’s own beliefs. Similarly, presidential hopeful Bernie Sanders may have an easier time winning New Hampshire than elsewhere as he has served as a U.S. senator in neighboring Vermont for decades. New Hampshire’s electorate is also predominantly left leaning, an additional advantage for Sanders.
A win in the New Hampshire primary by no means guarantees the party’s nomination, nor does it ensure an eventual White House win. The winner of New Hampshire’s Democratic primary went on to win the nomination in three of the party’s six contests since 1980. The winner of the state’s Republican primary race became the party’s nominee in three of the five primaries since 1980.
Similarly, while the momentum gained from winning New Hampshire’s primary is often invaluable, a number of candidates have gone on to win the presidency without winning New Hampshire. Two of the three Republican presidents since 1980 won the New Hampshire primary leading up to the general election. By contrast, neither President Bill Clinton nor President Barack Obama — the two Democratic presidents serving over that period — had won the primary prior to their election.
New Hampshire’s voting result during the general election is a relatively strong bellwether of the final election outcome. Eight of the past nine U.S. presidents won New Hampshire in the general election.
Some have challenged New Hampshire’s first-to-vote status, arguing that so much should not be riding on such a small, largely homogeneous state. However, there is little opportunity for states to alter their position in the primary schedule, as New Hampshire law requires its primary election to occur at least 7 days prior to elections in any other state.
A number of social and economic characteristics are unique to the state, and the political climate has changed considerably over the years. Below are 10 visualizations that aim to capture key attributes of New Hampshire’s voting population.
1.
Click image to enlarge.
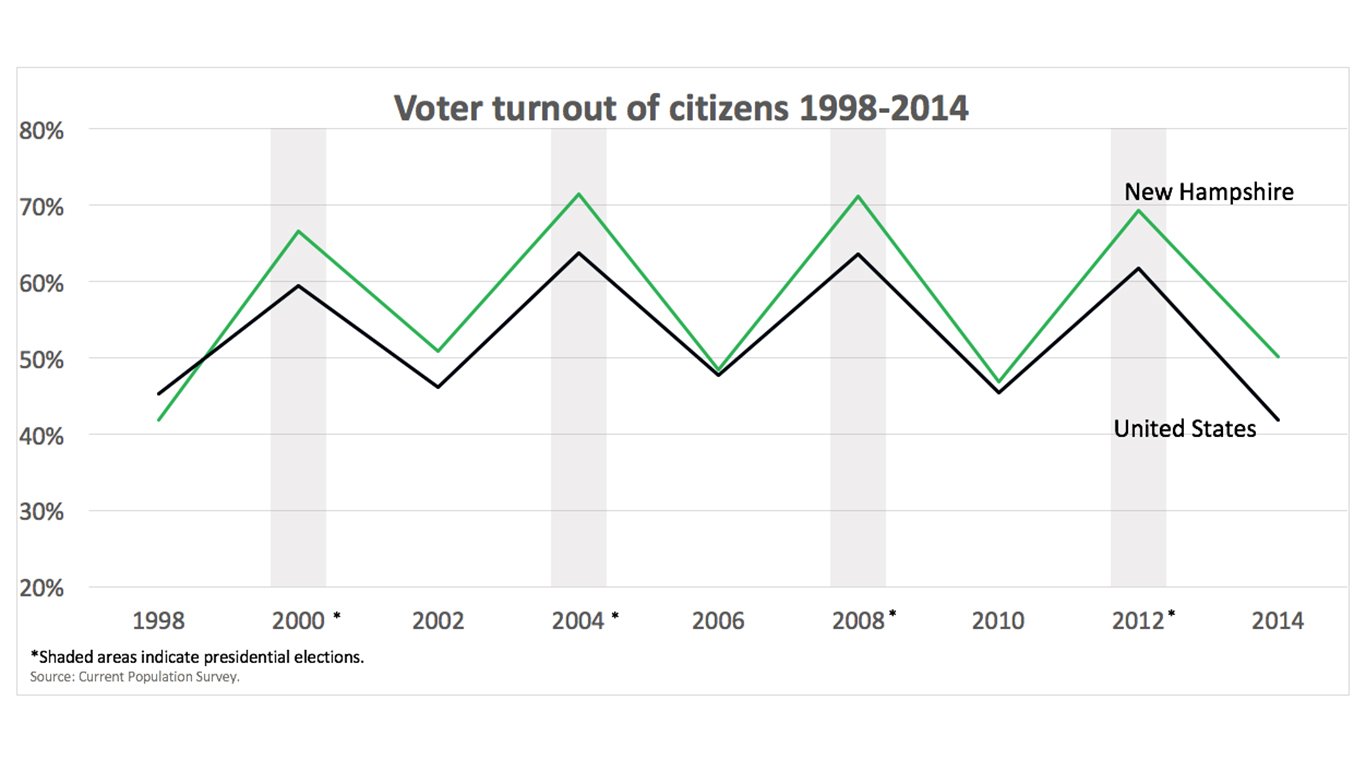
The steep competition in the New Hampshire primary election often carries over into the general election. In the last four presidential elections, an average of 69.8% of eligible voters in New Hampshire cast a ballot, a higher turnout than in most states. The peaks and troughs represent the higher voter turnout during presidential elections and the relatively low turnout during midterm elections.
2.
Click image to enlarge.
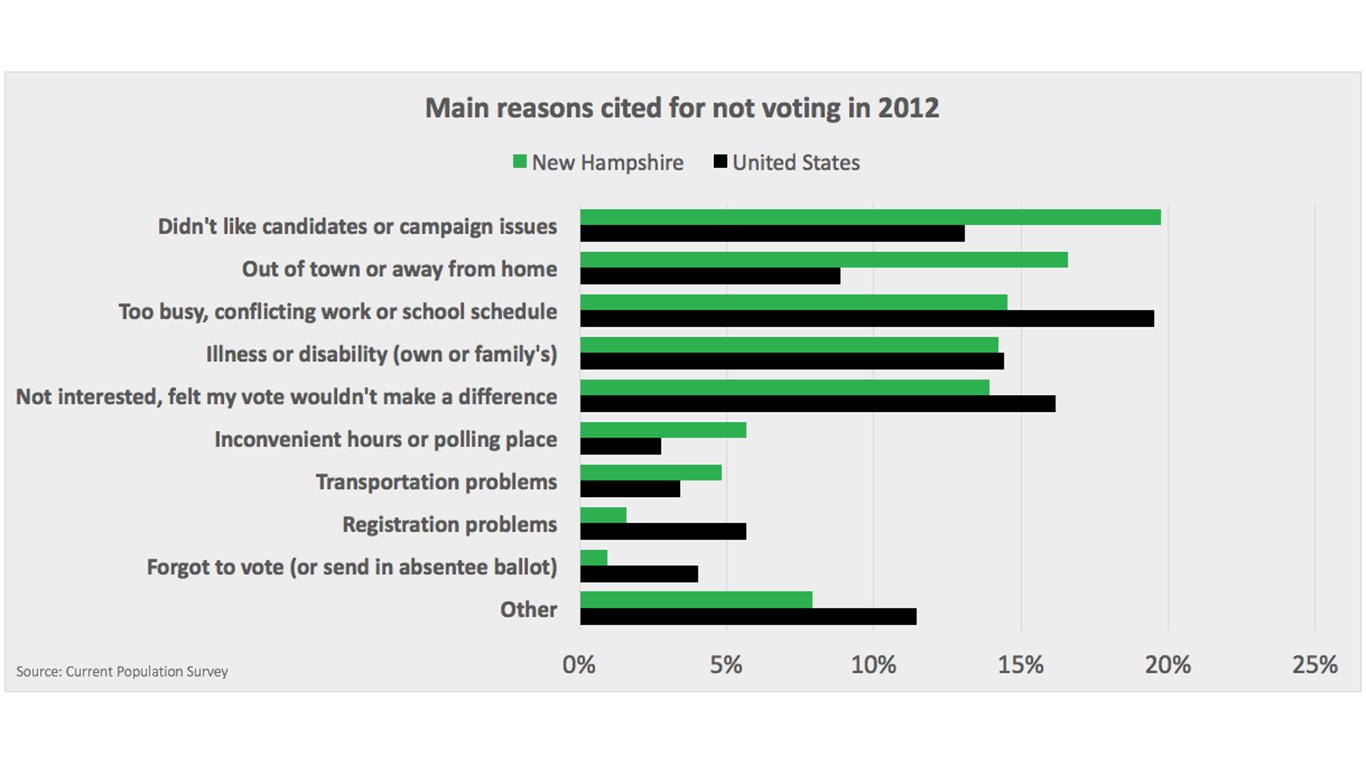
New Hampshire’s electorate has relatively strong voter turnout. For those who do no vote in the state, however, the most common reason residents gave for not voting was that they “didn’t like candidates or campaign issues,” followed by people who were “out of town or away from home.”
[recirclink id=310145]
3.
Click image to enlarge.
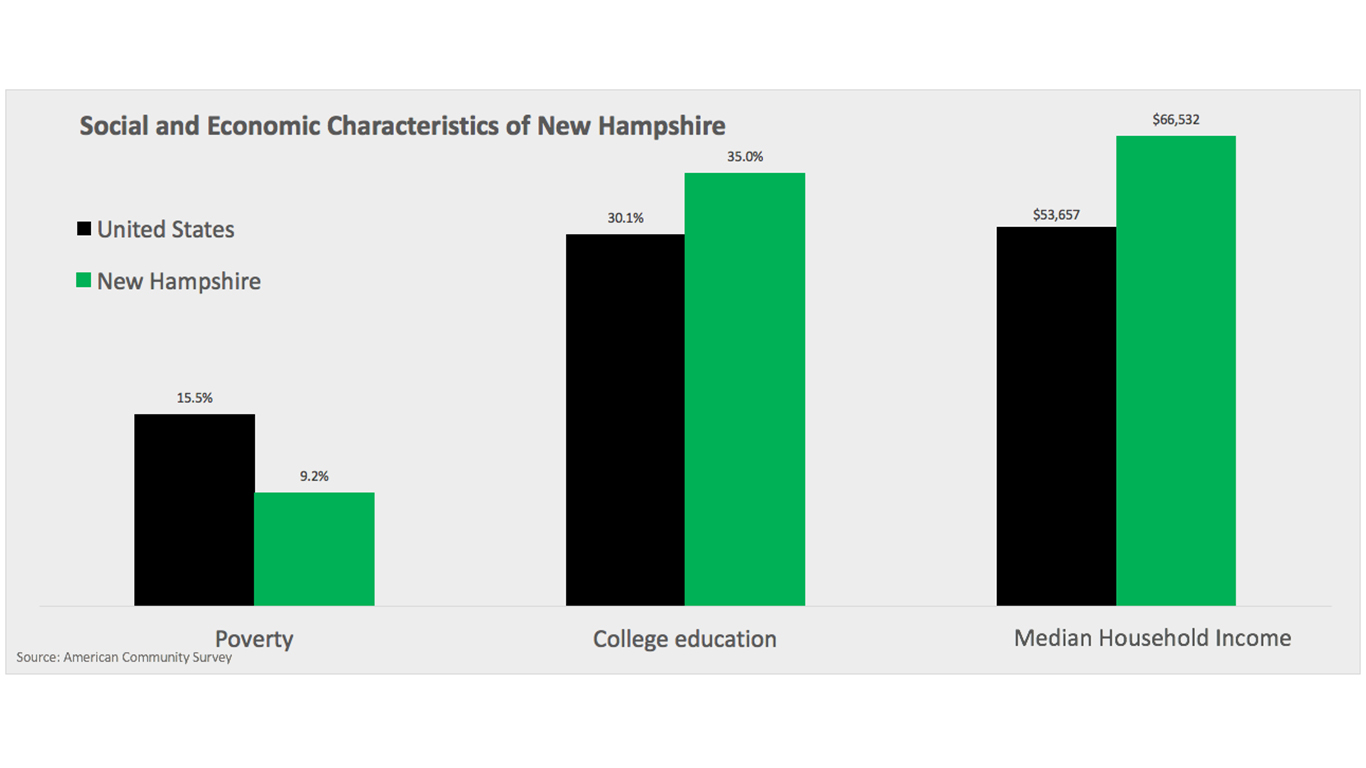
The poverty status, education, and income levels of a population can influence how — or whether — an area’s electorate will vote. The social and economic characteristics of New Hampshire’s population often do not align with the nation. Education, for example, is a major driver of voter turnout as well as financial security. Of New Hampshire adults with a college degree, 84.4% made it to the polls in 2012, versus 77.1% of adults with similar education nationwide. The turnout rates for all voting age state and national residents were 69.4% and 61.8% that year.
4.
Click image to enlarge.
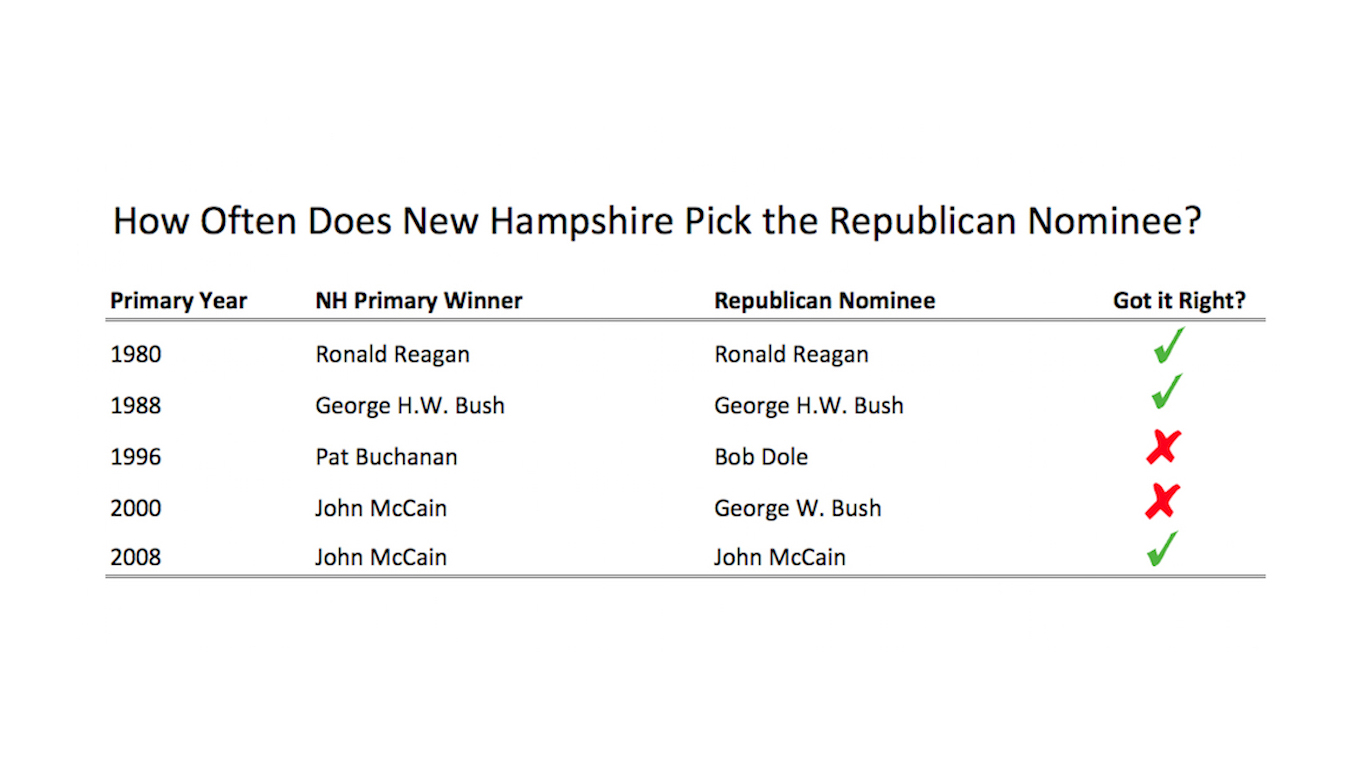
As the nation’s first state primary, and second state to vote during the election season after the Iowa caucus, a great deal of energy and money is spent wooing New Hampshire voters. Is winning New Hampshire really so important for candidates? For Republicans, three of the last five primary winners have gone on to win their party’s nomination.
5.
Click image to enlarge.
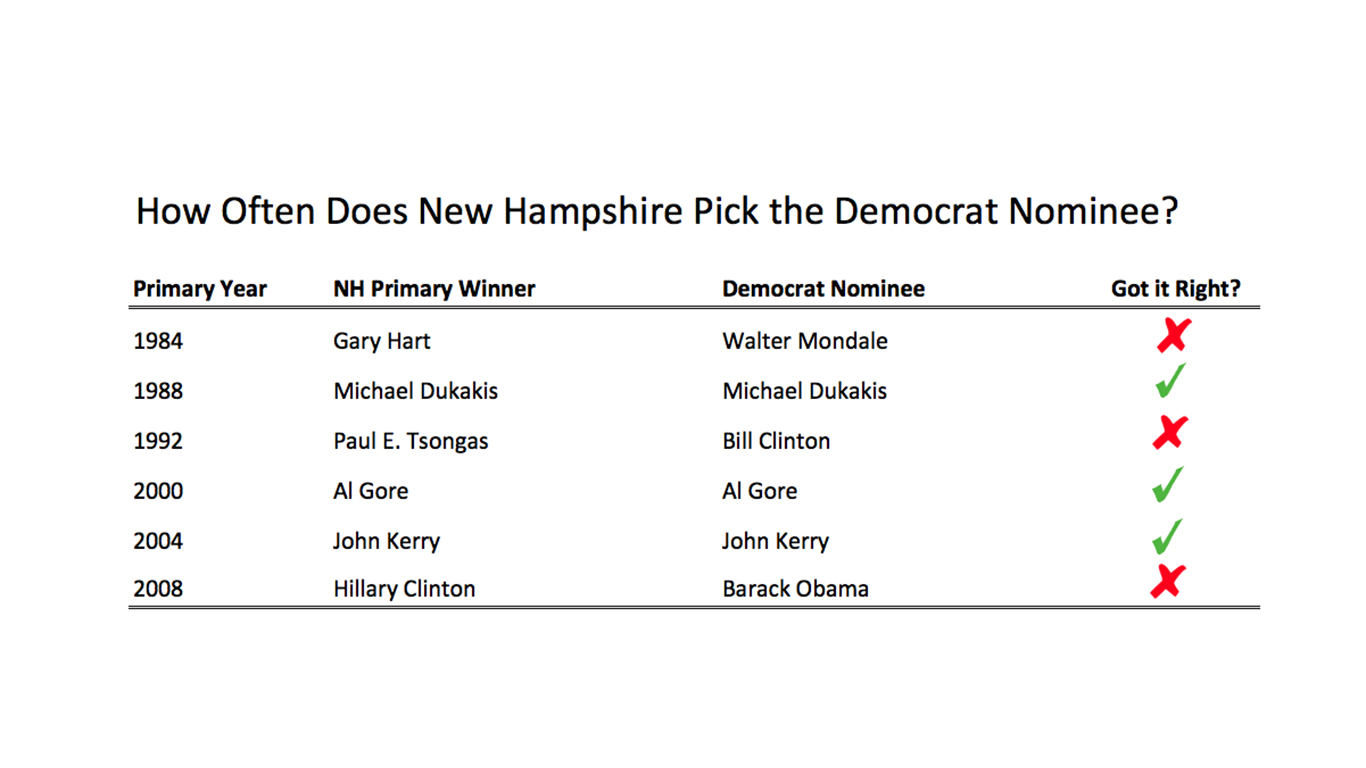
As the nation’s first state primary, and second state to vote during the election season after the Iowa caucus, a great deal of energy and money is spent wooing New Hampshire voters. Is winning New Hampshire really so important for candidates? For Democrats, three of the last six primary winners have gone on to win their party’s nomination.
[recirclink id=310239]
6.
Click image to enlarge.
Historically, New Hampshire has been a swing state, and voter turnout is arguably more decisive in the state’s elective outcome than in the rest of the country. In the last four presidential elections, no candidate has won New Hampshire by a margin larger than 10 percentage points.
7.
Click image to enlarge.
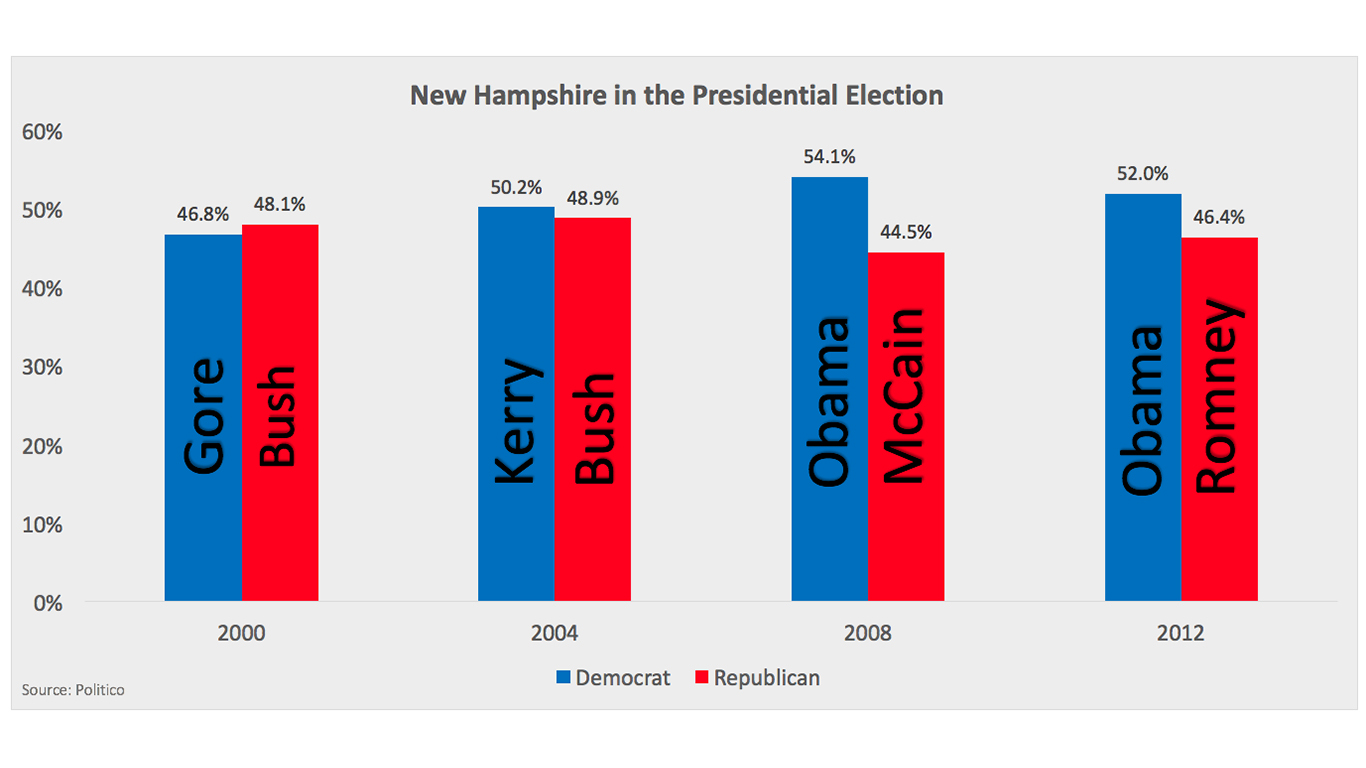
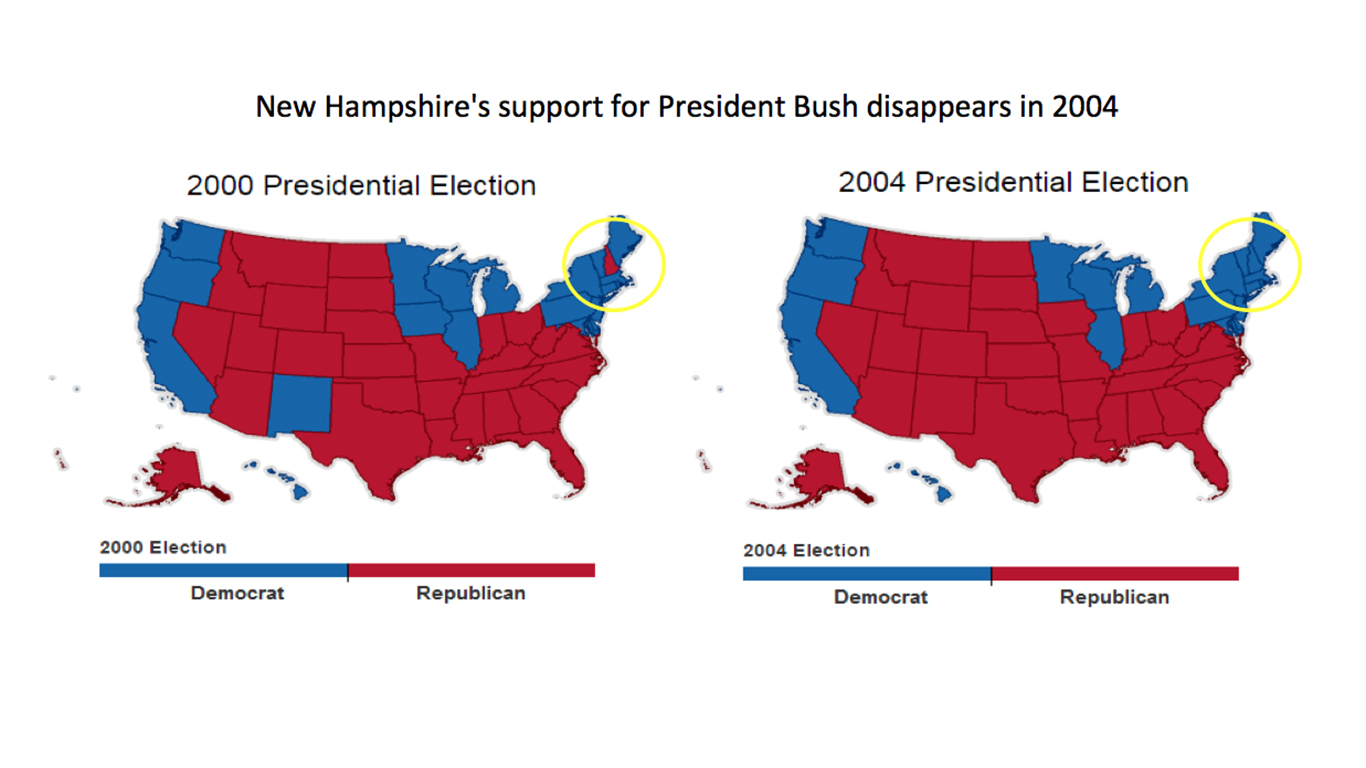
The competition for New Hampshire voter support is high during presidential elections. In eight of the past nine presidential elections, the eventual winner of the presidency had also garnered majority support among New Hampshire’s electorate. The only exception to the state’s record occured in 2004, when the state voted against re-electing George W. Bush. New Hampshire was the only state that supported George W. Bush in 2000 that did not vote to re-elect him in 2004.
8.
Click image to enlarge.
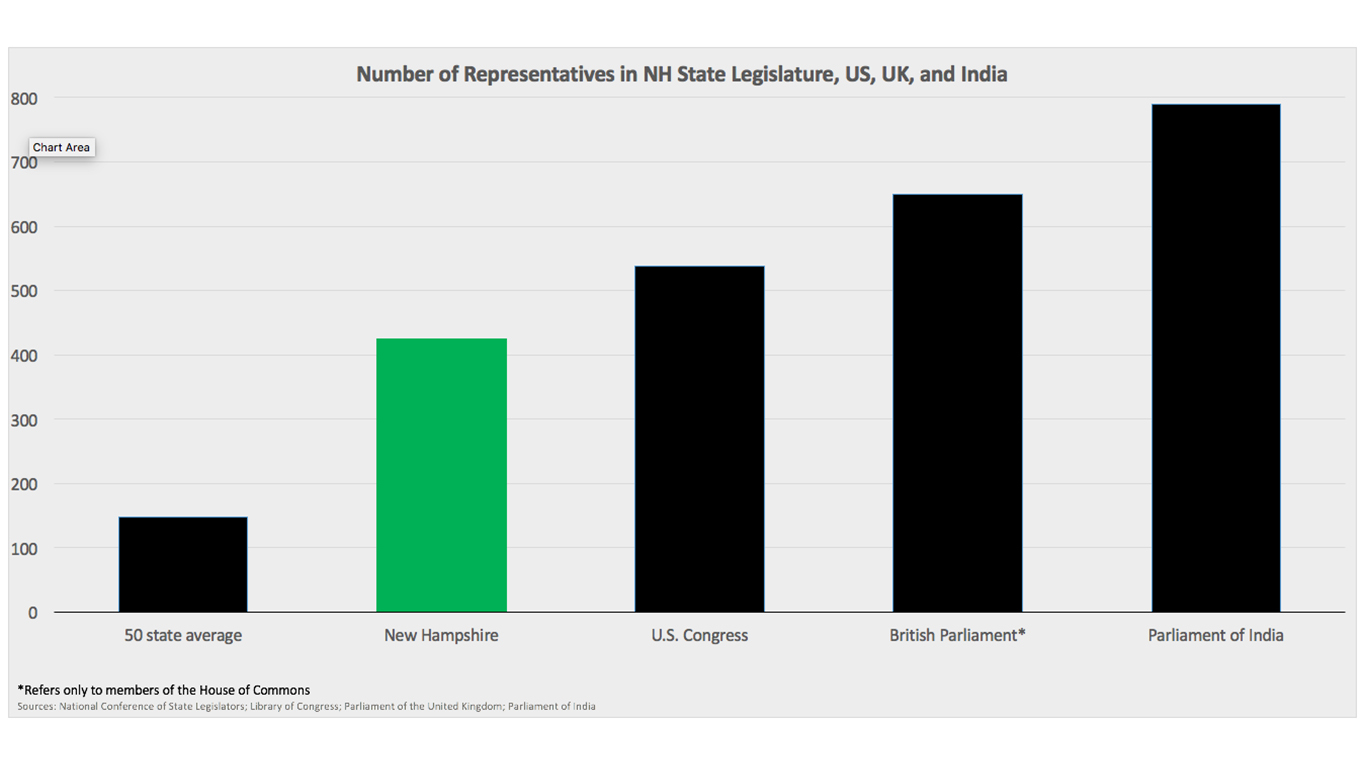
New Hampshire has by far the largest state legislature of any state. Compared with the U.S. Congress and other nations, the state’s body of representatives is the fourth largest English-speaking legislature worldwide.
[recirclink id=312913]
9.
Click image to enlarge.
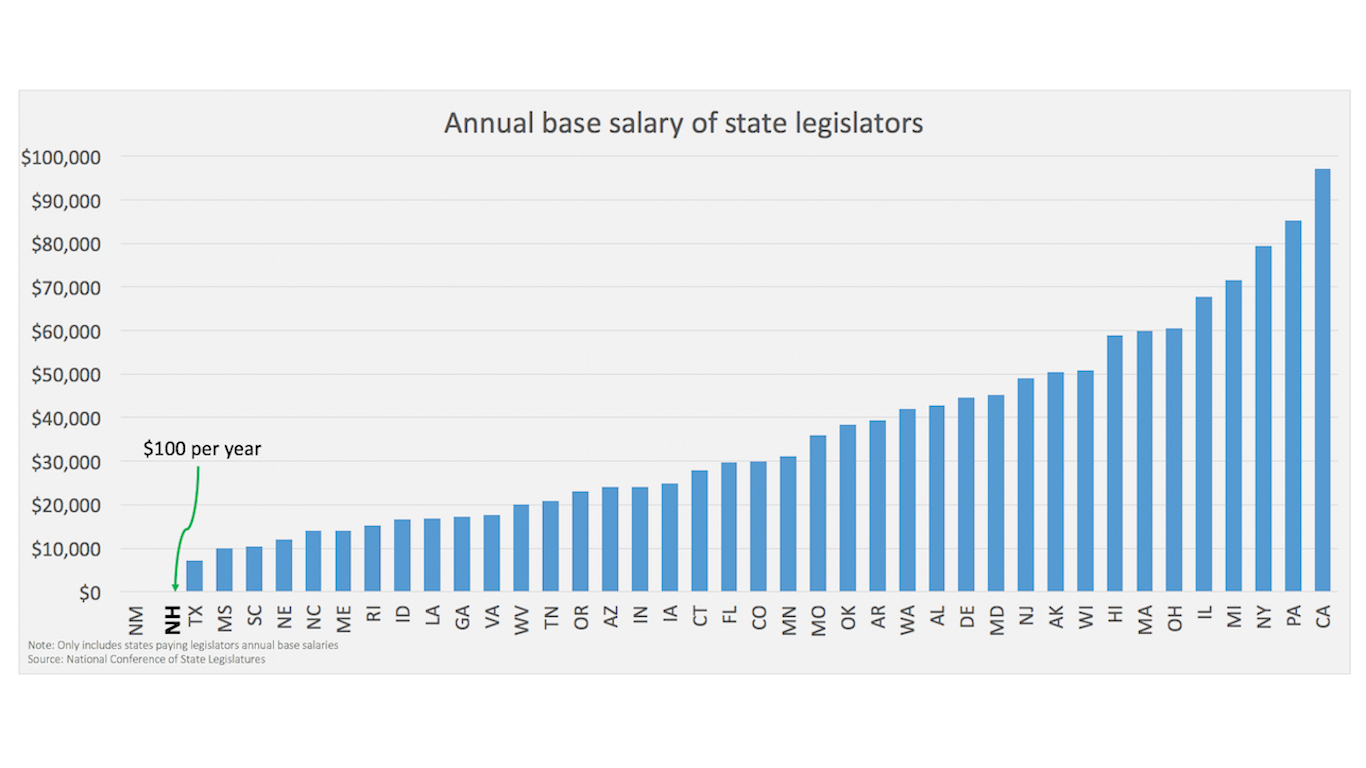
Written in the state’s constitution and never adjusted for inflation, New Hampshire legislators are some of the lowest paid in the country. At $100 annually, the typical pay is dwarfed by that of other states and a fraction of the baseline compensation of $174,000 for U.S. representatives nationwide.
Contact [email protected] for any questions or corrections.