In every state, there are rich and there are poor counties. The poorest county in each state can be much poorer than the state’s median household income, or the difference can be much smaller. Delaware has smallest income gap, with the typical household in the poorest county earning $6,700 less annually than the state’s median income. In Maryland and Virginia the difference is the largest, with a typical household earning more than $37,000 less than the states’ respective median household incomes. 24/7 Wall St. reviewed the poorest county in each state based on data from the Census Bureau’s American Community Survey.
Incomes vary considerably within each state. Even in many of the nation’s wealthiest states, households in the poorest counties earn incomes below the national median. The two exceptions are the poorest counties in Connecticut and Delaware, where the typical household still earns more annually compared to the national median of $53,482.
1. Sumter County, Alabama
> County median household income: $22,865
> State median household income: $43,511
> Poverty rate: 38.5%
> Unemployment: 8.9%
Alabama’s median household income of $43,511 is one of the lowest in the nation. A typical Sumter County household earns barely half that figure at $22,865 annually. Sumter County also has one of the nation’s highest poverty rates at 38.5%. By contrast, 18.9% of people across the state and 15.6% of Americans live in poverty.
2. Bethel Census Area, Alaska
> County median household income: $51,930
> State median household income: $71,829
> Poverty rate: 23.7%
> Unemployment: 16.0%
A typical household in Bethel, Alaska’s poorest region, earns $19,899 less than the typical household across the state. As in other poor areas, area residents have relatively low educational attainment rates. Only 11.4% of adults in the area have a bachelor’s degree, and 80.2% have finished at least high school, each some of the lower percentages in the country.
[nativounit]
3. Apache County, Arizona
> County median household income: $32,396
> State median household income: $49,928
> Poverty rate: 35.9%
> Unemployment: 16.0%
In Apache County, the poorest in Arizona, a typical household earns just $32,396, or $17,532 less than the statewide median household income. As in other poor counties, area residents have relatively low educational attainment rates. Only 10.1% of adults in the county have at least a bachelor’s degree, and 75.8% have finished at least high school, each some of the lower percentages in the country.
4. Lee County, Arkansas
> County median household income: $26,986
> State median household income: $41,264
> Poverty rate: 29.8%
> Unemployment: 7.9%
Arkansas residents have some of the lowest incomes in the nation. In Lee County, the state’s poorest, incomes are even lower. A typical household in the area earns just $26,986 annually. A weak economy in Lee County may partially account for the low incomes. The county’s 7.9% unemployment rate is higher than the state and national jobless rates of 6.1% and 6.2%, respectively.
[recirclink id=299375]
5. Lake County, California
> County median household income: $35,997
> State median household income: $61,489
> Poverty rate: 24.3%
> Unemployment: 8.9%
A typical household in Lake County, California’s poorest, earns $25,492 less than the typical household does across the state. As in other poor counties, area residents have relatively low educational attainment rates. Only 16.2% of adults in the county have at least a bachelor’s degree, and 84.8% have finished at least high school, each some of the lower percentages in the country. By contrast, 29.3% of adults nationwide have at least a bachelor’s degree, and 86.3% of adults nationwide have finished at least high school.
6. Alamosa County, Colorado
> County median household income: $31,400
> State median household income: $59,448
> Poverty rate: 27.9%
> Unemployment: 7.1%
A typical household in Alamosa County, Colorado’s poorest, earns $28,048 less than the typical household earns across the state. As in other poor counties, area residents have relatively low educational attainment rates. Less than one in four county adults have at least a bachelor’s degree versus the national college attainment rate of nearly 30%.
7. Windham County, Connecticut
> County median household income: $59,218
> State median household income: $69,899
> Poverty rate: 11.4%
> Unemployment: 7.3%
Connecticut is one of the wealthiest states in the country, and even the state’s poorest county is wealthier than the typical U.S household. A typical Windham County household earns nearly $60,000 annually. While this figure is lower than the state’s median household income of $69,899, it is more than $5,000 above the national median household income of $53,482.
[recirclink id=306207]
8. Sussex County, Delaware
> County median household income: $53,505
> State median household income: $60,231
> Poverty rate: 13.3%
> Unemployment: 5.7%
A typical household in Sussex County, Delaware’s poorest, earns $6,726 less than the typical household across the state. As in other poor counties, area residents have relatively low educational attainment rates. Only 21.9% of adults in Sussex County have at least a bachelor’s degree, and 85.3% have earned a high school diploma, each some of the lower percentages in the country.
9. Putnam County, Florida
> County median household income: $32,714
> State median household income: $47,212
> Poverty rate: 26.5%
> Unemployment: 8.7%
Florida residents have some of the lowest incomes in the nation. In Putnam County, the state’s poorest, incomes are even lower. A typical area household earns just $32,714 annually. The county’s weak economy may partially account for the low incomes. The area’s 8.7% unemployment rate is higher than the state and national jobless rates of 6.3% and 6.2%, respectively.
10. Jefferson County, Georgia
> County median household income: $26,796
> State median household income: $49,342
> Poverty rate: 31.8%
> Unemployment: 11.6%
Jefferson is the poorest county in one of the poorest states. A typical area household earns $26,796 annually, nearly half of the state’s median household income of $49,342. Jefferson County’s high unemployment rate has likely contributed to the lower median household income. Jefferson’s unemployment rate of 11.6% is well above the state jobless rate of 7.2% which is itself higher than that of all but five other states.
11. Hawaii County, Hawaii
> County median household income: $51,213
> State median household income: $68,201
> Poverty rate: 19.2%
> Unemployment: 5.5%
Hawaii County, which encompasses the entire island of Hawaii — also known as the Big Island — is the state’s poorest area. A typical county household earns nearly $52,000 annually. While this figure is considerably lower than the state’s median household income of $68,201, it is not substantially lower than the national median household income of $53,482.
12. Madison County, Idaho
> County median household income: $32,052
> State median household income: $47,334
> Poverty rate: 35.7%
> Unemployment: 3.3%
Idaho residents have some of the lowest incomes in the nation. In Madison County, the state’s poorest county, incomes are even lower. A typical area household earns just $32,052 annually, well below both the state and national income figures. Unlike the poorest county in many other states, the area’s 3.3% unemployment rate is lower than the state and national jobless rates of 4.8% and 6.2%, respectively. Madison is also one of only a few counties on this list where the percentage of adults with at least a bachelor’s degree exceeds the corresponding statewide rate.
[nativounit]
13. Jackson County, Illinois
> County median household income: $32,681
> State median household income: $57,166
> Poverty rate: 32.3%
> Unemployment: 6.6%
Jackson is the poorest county in Illinois. Higher educational attainment typically correlates with higher incomes. However, more than one in three adults in the area have at least a bachelor’s degree, higher than the statewide college attainment rate of 31.9%. As in the poorest counties in most other states, Jackson’s poverty rate of 32.3% is more than double the corresponding statewide rate.
14. Fayette County, Indiana
> County median household income: $37,833
> State median household income: $48,737
> Poverty rate: 20.6%
> Unemployment: 8.0%
A typical household in Fayette County, Indiana’s poorest, earns $10,904 less than the typical household earns across the state. As in other poor counties, area residents have relatively low educational attainment rates. Only 10.1% of county adults have at least a bachelor’s degree, and 80.1% have earned a high school diploma, each some of the lower percentages in the country.
[recirclink id=299799]
15. Wapello County, Iowa
> County median household income: $41,519
> State median household income: $52,716
> Poverty rate: 19.1%
> Unemployment: 5.7%
A typical household in Wapello County, Iowa’s poorest, earns $11,197 less than the typical household does across the state. As in other poor counties, area residents have relatively low educational attainment rates. Only 15.3% of adults in the county have at least a bachelor’s degree, a significantly smaller share than the 26.4% of adults across the state with similar education. Iowa’s poorest county has poverty as well. More than one-quarter of all Wapello children live below the poverty line, a stark contrast to the state’s 16.1% child poverty rate.
16. Crawford County, Kansas
> County median household income: $37,154
> State median household income: $51,872
> Poverty rate: 21.7%
> Unemployment: 5.3%
Of the 40 counties in Kansas with at least 10,000 people, none have a lower median income than Crawford County, located in the southeast section of the state. A typical household in the county earns $37,154, nearly $15,000 less than the state median income of $51,872 — which itself is lower than the national figure.
17. McCreary County, Kentucky
> County median household income: $20,000
> State median household income: $43,342
> Poverty rate: 37.7%
> Unemployment: 10.7%
Kentucky residents have some of the lowest incomes in the nation. In McCreary County, the state’s poorest county, incomes are less than half the state figure. A typical household in the area earns just $20,000 annually, also one of the lowest median incomes in the nation. The area’s weak economy may at least partially explain the low incomes in McCreary. The county’s 10.7% unemployment rate is significantly higher than the state and national jobless rates of 6.5% and 6.2%, respectively.
[recirclink id=305541]
18. Madison Parish, Louisiana
> County median household income: $24,028
> State median household income: $44,991
> Poverty rate: 38.6%
> Unemployment: 11.3%
The median household income of $44,991 in Louisiana is one of the lowest in the country. A typical household in Madison Parish earns barely half that figure, with a median annual income of $24,028. Madison Parish also has one of the nation’s highest poverty rates of 38.6%. By contrast, 19.6% of people across the state, and 15.6% of Americans, live in poverty.
19. Piscataquis County, Maine
> County median household income: $37,110
> State median household income: $48,804
> Poverty rate: 19.9%
> Unemployment: 7.5%
Piscataquis is the poorest of the 16 counties in Maine with at least 10,000 people. The typical county household earns $11,694 less than the statewide median household income. A high child poverty rate accompanies lower incomes in Piscataquis. As many as 30.3% of children in Maine’s poorest county live below the poverty line compared to 18.8% of all children in the state.
[nativounit]
20. Somerset County, Maryland
> County median household income: $36,716
> State median household income: $74,149
> Poverty rate: 23.7%
> Unemployment: 9.5%
A typical household in Somerset County, Maryland’s poorest, earns $37,433 less than the typical household does across the state. As in other poor counties, area residents have relatively low educational attainment rates. Only 15.1% of adults in the county have at least a bachelor’s degree, and 79% have finished at least high school, each some of the lower percentages in the country. The area’s unemployment rate of 9.5% is also well above the national jobless rate of 6.2%.
21. Berkshire County, Massachusetts
> County median household income: $49,737
> State median household income: $67,846
> Poverty rate: 12.7%
> Unemployment: 6.5%
Berkshire, the westernmost county in Massachusetts, is the poorest in the state. A typical household in Berkshire County earns nearly $50,000 annually. While this figure is considerably lower than the state’s median household income of $67,846, it is not substantially lower than the median household income of American households of $53,482.
22. Lake County, Michigan
> County median household income: $28,872
> State median household income: $49,087
> Poverty rate: 30.5%
> Unemployment: 11.0%
A typical household in Lake County, Michigan’s poorest, earns $20,215 less than the typical household across the state. As in other poor counties, area residents have relatively low educational attainment rates. Only 9.2% of adults in the county have at least a bachelor’s degree, compared to a 26.4% college attainment rate throughout the state. Low incomes in Michigan’s poorest county accompany an especially high child poverty rate. As many as 51.4% of Lake County children are impoverished compared to 23.7% of children throughout the state.
23. Wadena County, Minnesota
> County median household income: $38,661
> State median household income: $60,828
> Poverty rate: 17.2%
> Unemployment: 6.1%
Minnesota’s poverty rate of 11.5% is one of the lowest rate among all states. However, in Wadena, the state’s poorest county, 17.2% of people live in poverty, higher than the national poverty rate of 15.6%. The typical household in Wadena earns $38,661 annually, much lower than the state and national median incomes of $60,828 and $53,482, respectively.
24. Holmes County, Mississippi
> County median household income: $21,399
> State median household income: $39,464
> Poverty rate: 43.9%
> Unemployment: 15.8%
Mississippi’s median annual household income of $39,464 is the lowest in the nation. A typical household in Holmes County earns barely half that figure at $21,399. Holmes County also has one of the nation’s highest poverty rates at 43.9%. By contrast, 22.6% of people across the state, and 15.6% of Americans, live in poverty. Low incomes and prevalent poverty accompany high unemployment in Holmes. Holmes County’s 15.8% unemployment rate is significantly higher than the 7.8% statewide and 6.2% national unemployment rates.
[recirclink id=299824]
25. Mississippi County, Missouri
> County median household income: $28,436
> State median household income: $47,764
> Poverty rate: 29.7%
> Unemployment: 7.3%
The median household income in Mississippi County of $28,436 is $19,328 less than the state’s median income of $47,764, which itself is lower than the national income. The low incomes partially explain the area’s widespread poverty. As many as 45.3% of Mississippi County children live in poverty, more than double the state and national rates of 21.5% and 21.9%, respectively. Of all people in the area, nearly 30% earn poverty level wages.
26. Sanders County, Montana
> County median household income: $31,665
> State median household income: $46,766
> Poverty rate: 22.9%
> Unemployment: 9.4%
Montana’s median household income of $46,766 is one of the lowest of any state in the nation. With a median annual income of $31,665, the typical household in Sanders County earns even less. Sanders County also has a much higher poverty rate, at 22.9%. By contrast, 15.3% of people across the state, and 15.6% of Americans, live in poverty.
27. Red Willow County, Nebraska
> County median household income: $43,627
> State median household income: $52,400
> Poverty rate: 11.3%
> Unemployment: 2.6%
Red Willow County’s roughly 11,000 residents are among the lowest earning in the state. A typical county household brings in $43,627 annually, nearly $10,000 less than the median statewide income of $52,400. Unlike many of the poorest counties in each state, the unemployment rate in Red Willow County is relatively low. While 6.2% of the American workforce and 3.3% of the Nebraskan workforce is unemployed, Red Willow County’s unemployment rate is only 2.6%.
[recirclink id=305281]
28. Nye County, Nevada
> County median household income: $41,757
> State median household income: $52,205
> Poverty rate: 18.6%
> Unemployment: 9.5%
A typical household in Nye, Nevada’s poorest county, earns $41,757, or $10,448 less than the typical household earns across the state. Compared to other poor counties, this is a relatively small difference from the state median income. As in other poor counties, area residents have relatively low educational attainment rates. Only 13.4% of county adults have at least a bachelor’s degree, and 83.5% have finished at least high school, each some of the lower percentages in the country.
29. Coos County, New Hampshire
> County median household income: $42,407
> State median household income: $65,986
> Poverty rate: 13.2%
> Unemployment: 5.8%
Coos County comprises the northern portion of New Hampshire, including the state’s border with Canada. It is also the poorest county in the state. New Hampshire has one of the higher median incomes in the country as well as the lowest poverty rate at just 8.9%. At 13.2%, Coos County’s poverty rate is also lower than the national rate of 15.6%.
[nativounit]
30. Cumberland County, New Jersey
> County median household income: $50,603
> State median household income: $72,062
> Poverty rate: 18.0%
> Unemployment: 9.9%
A particularly wealthy state, New Jersey’s poorest county is not especially poor. Median household income in Cumberland County is $50,603, only about $3,000 less than the national median household income. Still, a typical New Jersey household earns $21,459 more than the typical Cumberland household does. As in other states’ poorest counties, area residents have relatively low educational attainment rates. Only 13.8% of county adults have at least a bachelor’s degree compared to the 36.4% statewide college attainment rate.
31. San Miguel County, New Mexico
> County median household income: $28,292
> State median household income: $44,968
> Poverty rate: 29.4%
> Unemployment: 7.7%
New Mexico’s median household income of $44,968 is one of the lowest in the nation. A typical household in San Miguel County earns considerably less at $28,292. San Miguel County also has one of the nation’s highest poverty rates, at 29.4%. By contrast, 20.9% of people across the state, and 15.6% of Americans, live in poverty.
32. Bronx County, New York
> County median household income: $34,284
> State median household income: $58,687
> Poverty rate: 30.5%
> Unemployment: 9.8%
A typical household in Bronx County, New York’s poorest, earns $24,403 less than the typical household does across the state. As in other poor counties, area residents have relatively low educational attainment rates. Only 18.3% of adults in the county have at least a bachelor’s degree, and 70.2% have finished at least high school, each some of the lower percentages in the country.
[nativounit]
33. Bertie County, North Carolina
> County median household income: $29,388
> State median household income: $46,693
> Poverty rate: 25.5%
> Unemployment: 7.8%
North Carolina’s median household income of $46,693 is one of the lowest in the nation. With a median annual income of $29,388, a typical household in Bertie County earns even less. Bertie County also has one of the nation’s highest poverty rates, at 25.5%. By contrast, 17.6% of people across the state, and 15.6% of Americans, live in poverty. As in many poor counties, Bertie County adults are less likely to have a college education than their counterparts across the state. Only 11.1% of adults in the county have a bachelor’s degree, significantly less than the 27.8% statewide college attainment rate.
34. Rolette County, North Dakota
> County median household income: $32,781
> State median household income: $55,579
> Poverty rate: 37.0%
> Unemployment: 11.8%
A typical household in Rolette County earns $32,781 annually, $22,798 less than the typical household does across the state and the lowest of any North Dakota county. As in other poor counties, area residents have relatively low educational attainment rates. Just one in five adults in the county has at least a bachelor’s degree, and 81.5% have finished at least high school, each some of the lower percentages in the country. Although North Dakota is often considered to have one of the healthiest job markets in the country, Rolette County does not share that distinction. While North Dakota’s unemployment rate of 2.8% is the lowest in the nation, 11.8% of workers in Rolette are looking for work, well above the national unemployment rate.
[recirclink id=300460]
35. Athens County, Ohio
> County median household income: $33,773
> State median household income: $48,849
> Poverty rate: 31.6%
> Unemployment: 6.8%
The median household income in Athens County of $33,773 is $15,076 lower than Ohio’s median income of $48,849, which itself is lower than the national figure of $53,482. Lower incomes tend to go hand in hand with lower educational attainment rates, but this is not always the case. In Athens, 89.4% of adults have at least a high school diploma, a higher share than both the state and national attainment rates.
36. Choctaw County, Oklahoma
> County median household income: $30,282
> State median household income: $46,235
> Poverty rate: 27.7%
> Unemployment: 8.1%
Oklahoma’s median household income of $46,235 is one of the lowest in the country. A typical household in Choctaw County earns substantially less, with a median annual income of $30,282. Choctaw County also has one of the nation’s highest poverty rates at 27.7%. By contrast, 16.9% of people across the state, and 15.6% of Americans, live in poverty. Oklahoma also has one of the nation’s lowest college attainment rates, at 23.8%. In Choctaw, just 14.2% of adults have at least a bachelor’s degree.
37. Malheur County, Oregon
> County median household income: $34,380
> State median household income: $50,521
> Poverty rate: 28.4%
> Unemployment: 8.2%
The median household income in Malheur County of $34,380 is $16,141 lower than the state income of $50,521, which itself is lower than the national figure. As is the case with nearly all poor counties on this list, low incomes have a negative impact on the lives of the county’s children. While the county’s overall poverty rate is 28.4%, the child poverty rate is 39.3%.
[recirclink id=304684]
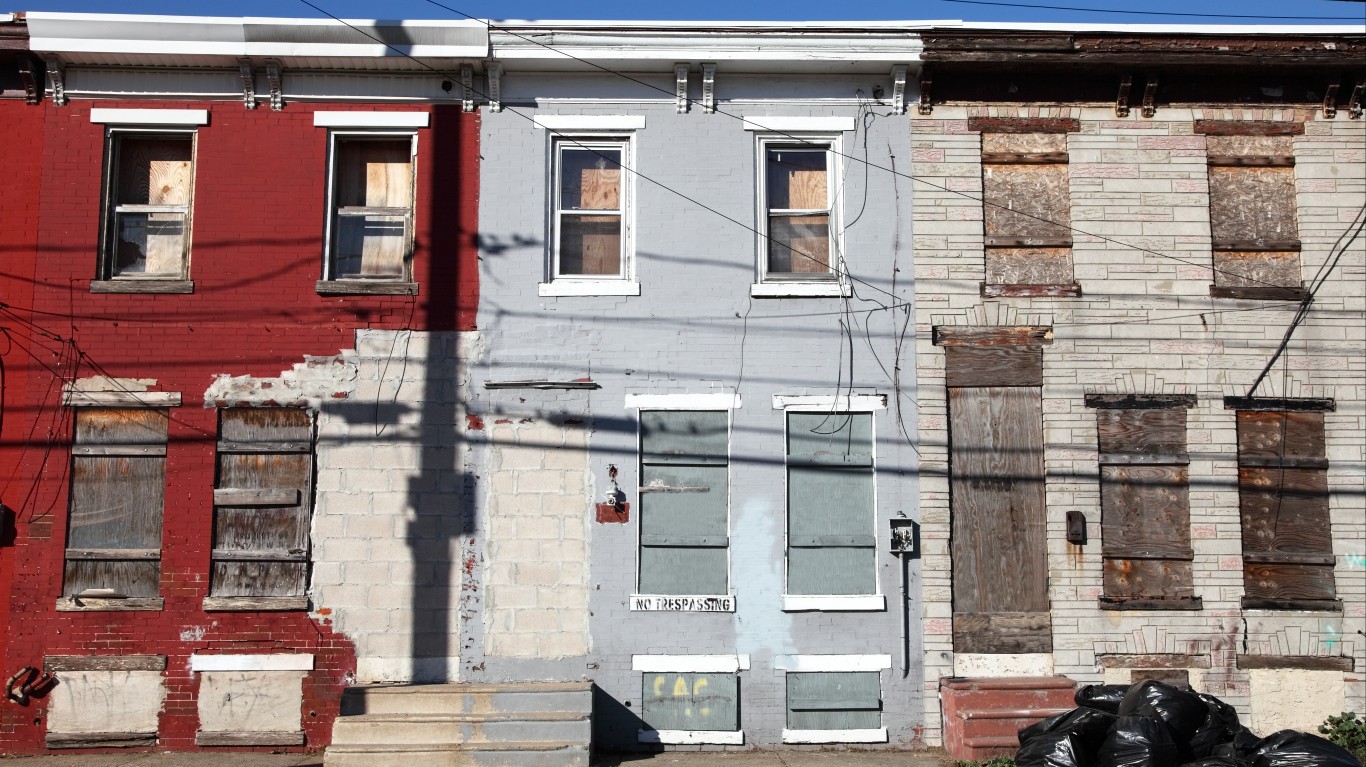
38. Philadelphia County, Pennsylvania
> County median household income: $37,460
> State median household income: $53,115
> Poverty rate: 26.7%
> Unemployment: 8.0%
While the poorest counties in a majority of states are relatively rural, Pennsylvania’s poorest county — Philadelphia County — is home to 1.5 million people and is relatively urban. The area’s median household income of $37,460 is $15,655 lower than the state income of $53,115, which itself is lower than the national figure. Among children in the county, 37% live in poverty, well above the U.S. child poverty rate of 21.9%.
39. Providence County, Rhode Island
> County median household income: $49,139
> State median household income: $56,423
> Poverty rate: 18.0%
> Unemployment: 8.2%
The county of Providence, Rhode Island, includes the tiny state’s capitol and contains well over half of Rhode Island’s approximately 1 million residents. However, compared to the state’s population as a whole, Providence is slightly poorer. A typical Providence County household earns $7,284 less than the typical household does across the state.
40. Allendale County, South Carolina
> County median household income: $25,495
> State median household income: $45,033
> Poverty rate: 32.5%
> Unemployment: 12.1%
South Carolina’s median household income of $45,033 is one of the lowest in the nation. A typical household in Allendale County earns barely half that figure, at $25,495. Allendale County also has one of the nation’s highest poverty rates, at 32.5%. By contrast, 18.3% of people across the state, and 15.6% of Americans, live in poverty. The area’s weak job market may partially account for the low incomes. The county’s 12.1% unemployment rate is nearly double the state and national jobless rates of 6.4% and 6.2%, respectively.
41. Oglala Lakota County, South Dakota
> County median household income: $26,383
> State median household income: $50,338
> Poverty rate: 52.6%
> Unemployment: 13.2%
The median household income in Oglala Lakota County, formerly known as Shannon County, of $26,383 is $23,955 lower than the state median income of $50,338, which itself is lower than the national figure. The poverty rate in Oglala Lakota is especially high — more than half of the population lives in poverty, several times higher than the national rate of 15.6%. An anemic job market may partially account for low incomes and high poverty. More than 13% of the area’s workforce is unemployed, more than double the national jobless rate of 6.2%.
42. Grundy County, Tennessee
> County median household income: $26,856
> State median household income: $44,621
> Poverty rate: 29.1%
> Unemployment: 9.4%
Tennessee residents have some of the lowest incomes in the nation. In Grundy County, the state’s poorest county, incomes are even lower. A typical household in the area earns just $26,856 annually. Grundy County also has one of the nation’s highest poverty rates, at 29.1%. By contrast, 17.8% of people across the state, and 15.6% of Americans, live in poverty. A weak economy may partially account for the low incomes. The county’s 9.4% unemployment rate is much higher than the state and national jobless rates of 6.7% and 6.2%, respectively.
[nativounit]
43. Starr County, Texas
> County median household income: $25,906
> State median household income: $52,576
> Poverty rate: 38.9%
> Unemployment: 13.5%
A typical household in Starr County, Texas’s poorest, earns $26,670 less than the typical household statewide. Texas has relatively low educational attainment rates, including the second-lowest share of adults with a high school diploma in the U.S, at 81.6%. Not surprisingly, as in other poor counties, Starr County residents have even lower educational attainment rates. Just 46.7% have finished at least high school, while only 9.6% of county adults have at least a bachelor’s degree, compared to a national share of 29.3%.
44. San Juan County, Utah
> County median household income: $41,411
> State median household income: $59,846
> Poverty rate: 28.1%
> Unemployment: 7.5%
A typical household in San Juan County, Utah’s poorest, earns $18,435 less than the typical household does across the state. As in other poor counties, area residents have relatively low educational attainment rates. Only 18.8% of county adults have at least a bachelor’s degree, and 82.9% have finished at least high school, each some of the lower percentages in the country.
[recirclink id=300526]
45. Orleans County, Vermont
> County median household income: $41,437
> State median household income: $54,447
> Poverty rate: 16.7%
> Unemployment: 6.4%
A typical household in Orleans County, Vermont’s poorest, earns $13,010 less than the typical household does across the state. As in other poor counties, a relatively high share of Orleans residents live below the poverty line. Roughly 16.7% of county residents are impoverished, more than the corresponding statewide poverty rate of 12%. Only 21.4% of Orleans County adults have a bachelor’s degree, significantly less than the 35.2% of adults who do across the Green Mountain State.
[cnxvideo id=”655414″ placement=”ros”]
46. Martinsville City, Virginia
> County median household income: $27,746
> State median household income: $64,792
> Poverty rate: 25.9%
> Unemployment: 9.9%
A typical household in Martinsville City, the poorest area in Virginia, earns $37,046 less than the typical household across the state. As in other poor parts of the country, area residents have relatively low educational attainment rates. Only 16.6% of adults in Martinsville have at least a bachelor’s degree, and 77.5% have finished at least high school, each some of the lower percentages in the country.
47. Whitman County, Washington
> County median household income: $35,578
> State median household income: $60,294
> Poverty rate: 32.7%
> Unemployment: 5.5%
Whitman County residents are exceptionally well educated compared to the poorest counties in most other states. More than 95% of adults have finished at least high school, one of the highest rates in the country. Also, 47.8% of adult have at least a bachelor’s degree — not just well above the state rate of 32.3%, but also one of the highest educational attainment rates nationwide. Still, residents earn very low incomes. The typical household earns $35,578 annually, substantially less than the state median household income of $60,294.
[recirclink id=304447]
48. McDowell County, West Virginia
> County median household income: $23,607
> State median household income: $41,576
> Poverty rate: 35.2%
> Unemployment: 12.9%
West Virginia residents have some of the lowest incomes in the nation. In McDowell County, the state’s poorest county, incomes are even lower. A typical household in the area earns just $23,607 annually. A weak economy may partially account for the low incomes. The county’s 12.9% unemployment rate is about double the state and national jobless rates of 6.5% and 6.2%, respectively.
49. Rusk County, Wisconsin
> County median household income: $38,728
> State median household income: $52,738
> Poverty rate: 17.9%
> Unemployment: 7.1%
Rusk is the poorest county in Wisconsin. The typical Rusk household earns just $38,728 annually, roughly $14,000 less than the median annual household income across the state. Lower incomes in the area are partially the result of a weak economy. While Wisconsin’s unemployment rate is 5.5%, roughly 7.1% of the Rusk workforce is unemployed.
[nativounit]
50. Albany County, Wyoming
> County median household income: $42,298
> State median household income: $58,252
> Poverty rate: 27.6%
> Unemployment: 3.6%
The unemployment rate in Albany County of 3.6% is actually lower than the state jobless rate of 4.3%, which itself is one of the lowest among all states. Yet, county residents earn lower incomes than the median income earned statewide. A typical area’s household earns $42,298 annually, versus the state median household income of $58,252. Similarly, the poverty rate in Albany of 27.6% is higher than both the state and national rates of 11.6% and 15.6%, respectively.
Correction: An earlier version of this article incorrectly identified Shannon as the poorest county in South Dakota. While the American Community Survey identifies the area as Shannon, it was officially renamed Oglala Lakota County in May 2015. The article has been updated to reflect this change.
People living in low income areas are far more likely to live in poverty than those living in richer areas. With the exception of only Red Willow, Nebraska, the poverty rate in each of these counties exceeds the state poverty rate. Compared to the national level, however, poverty in some of the poorest counties is exceptionally high. In five states — Connecticut, Delaware, Massachusetts, Nebraska, and New Hampshire — the poorest county’s poverty rate is lower than the national rate of 15.6%.
The vast majority of income is generated through employment, and a low unemployment rate contributes to higher incomes in an area. The jobless rate is also a reflection of the health of an area’s economy, which can be weakened by lower income jobs. In all but 10 states, the poorest county’s unemployment rate is greater than the 2014 national rate of 6.2%.
People who earn high wages often have more education. The higher education and income allow for more opportunities in life and socioeconomic improvements. However, education levels tend to be lower in these counties. With the exception of only nine poor counties on this list, the share of adults who finished high school does not exceed the state share. Similarly, the college attainment rate in all but five of these counties is lower than the 29.3% of adults nationwide who have completed at least a bachelor’s degree.
The populations of these poor counties are relatively sparsely populated. The poorest county in all but 12 states are more sparsely populated than the national density of 87.4 people per 100,000 Americans. The only urban areas with the distinction of poorest county are The Bronx and Philadelphia in New York and Pennsylvania.
To identify the poorest counties in each state, 24/7 Wall St. reviewed five-year estimated median annual household incomes from 2010 through 2014 from the U.S. Census Bureau’s American Community Survey (ACS). In order to be considered, counties or county-equivalents had to have a population of at least 10,000 people. Five-year estimated educational attainment and poverty rates also came from the ACS. Annual unemployment rates are for 2014 and came from the Bureau of Labor Statistics. Population density came from the Census Bureau’s 2010 decennial census.
These are the poorest counties in each state.
Contact [email protected] for any questions or corrections.