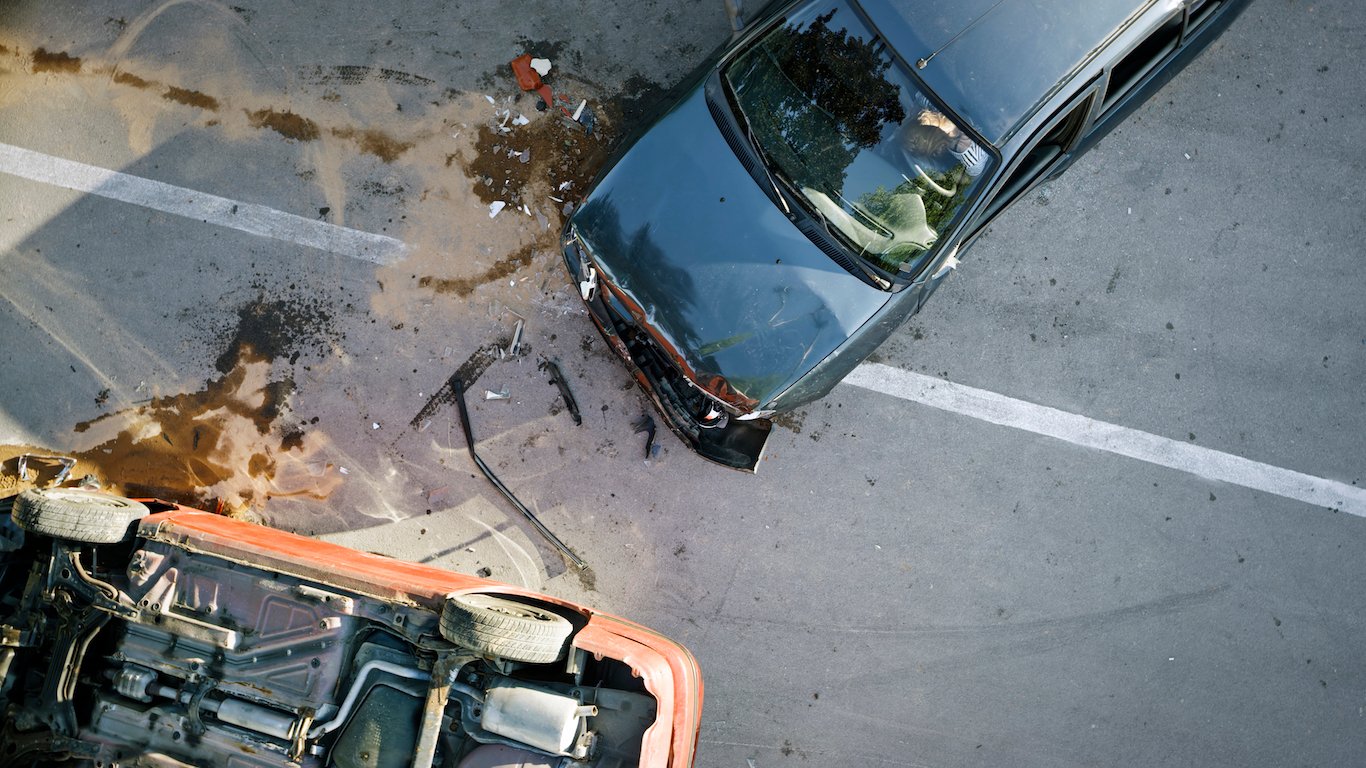
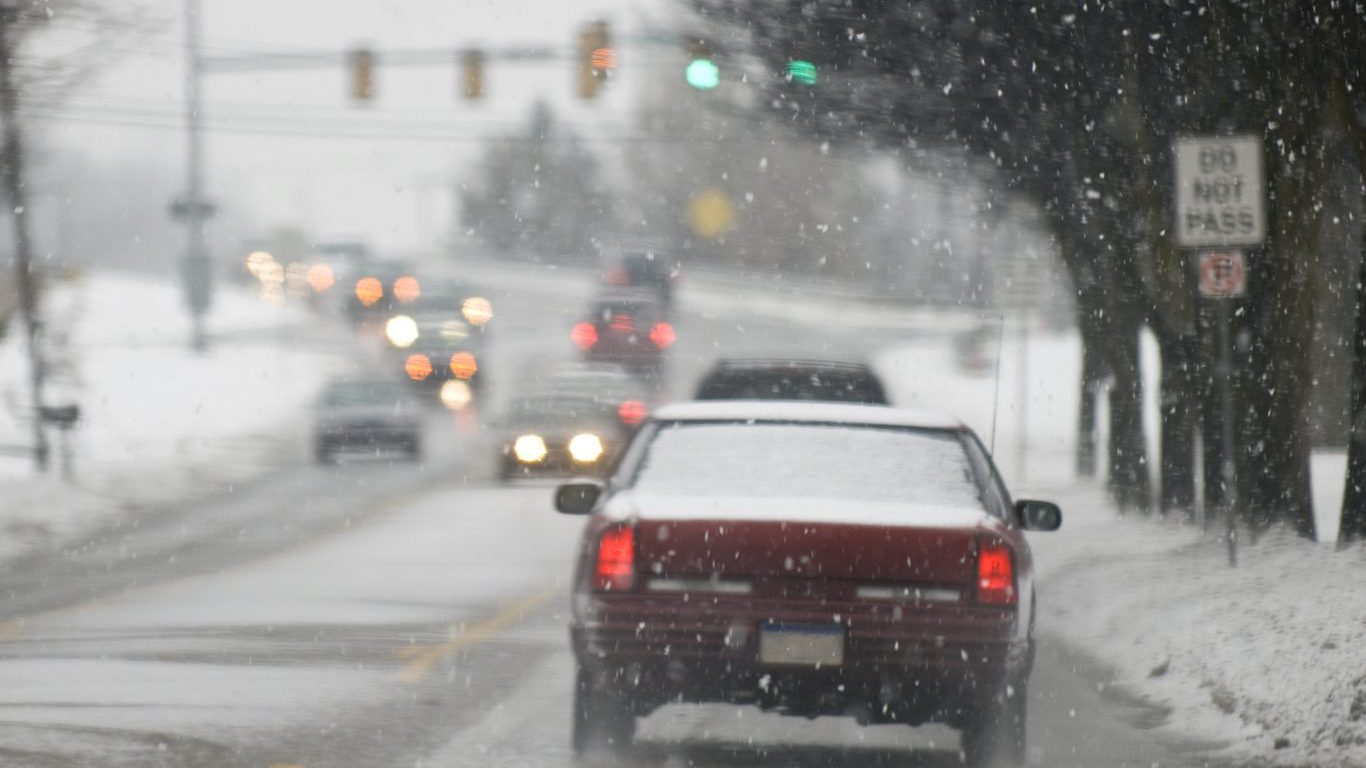
The number of fatal car crashes in the United States has declined, at least partially due to better safety measures and improved road design. In 2014, 32,675 Americans died in car crashes, roughly 10,000 fewer than there were In 2004.
Still, traffic accidents remain a serious problem in this country, and in some states the issue is much more severe than in others. Nationwide, there were 10.2 deaths for every 100,000 people in 2014. In Wyoming, the most dangerous state for drivers, there were 25.7 deaths for every 100,000 people. This was five times the traffic fatality rate recorded in Rhode Island and Massachusetts, the safest states to drive in the country.
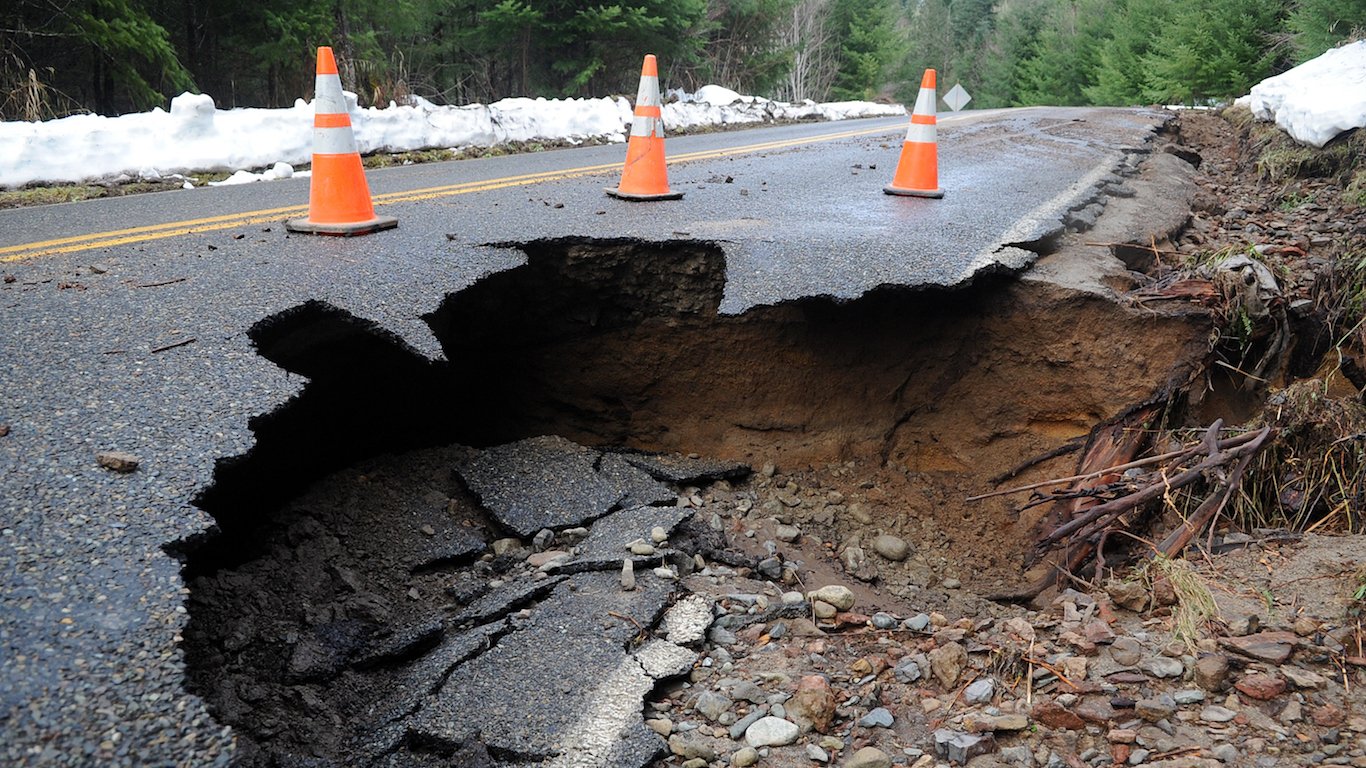
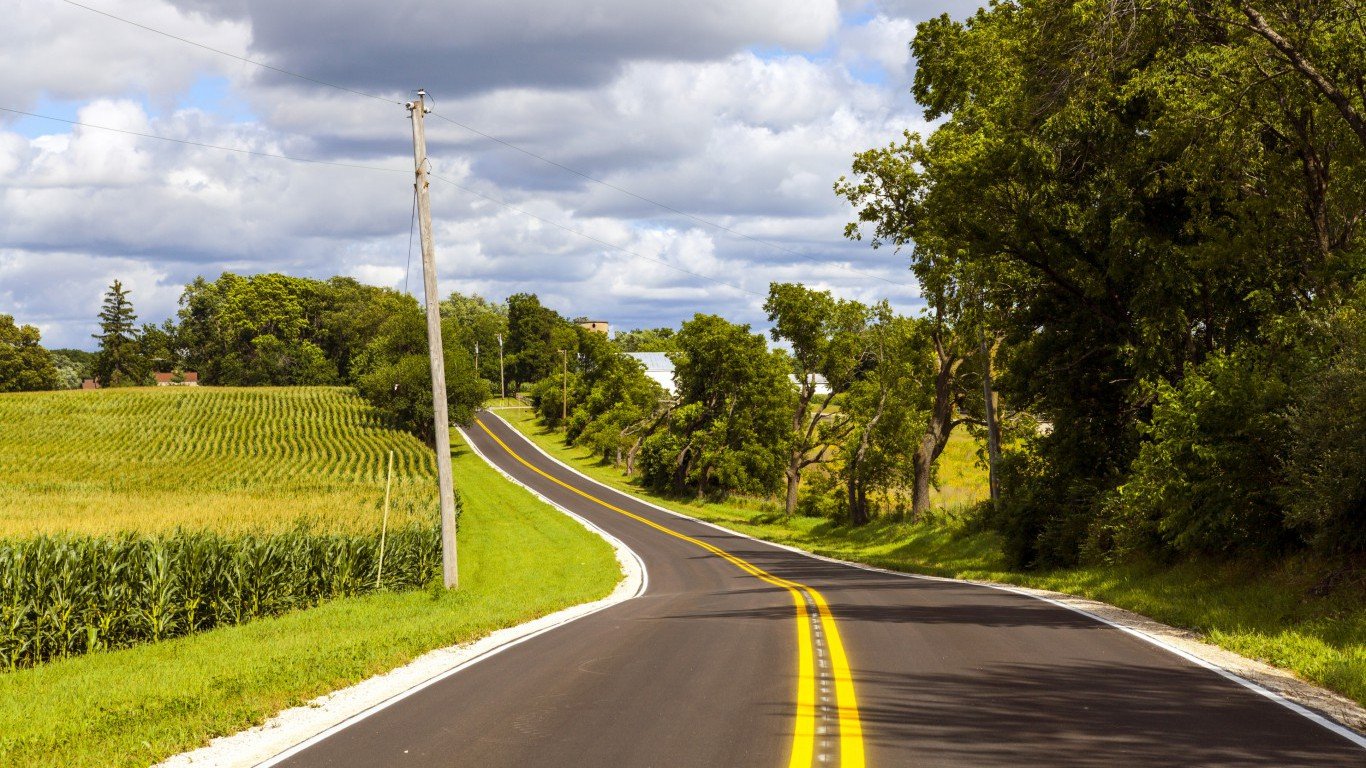
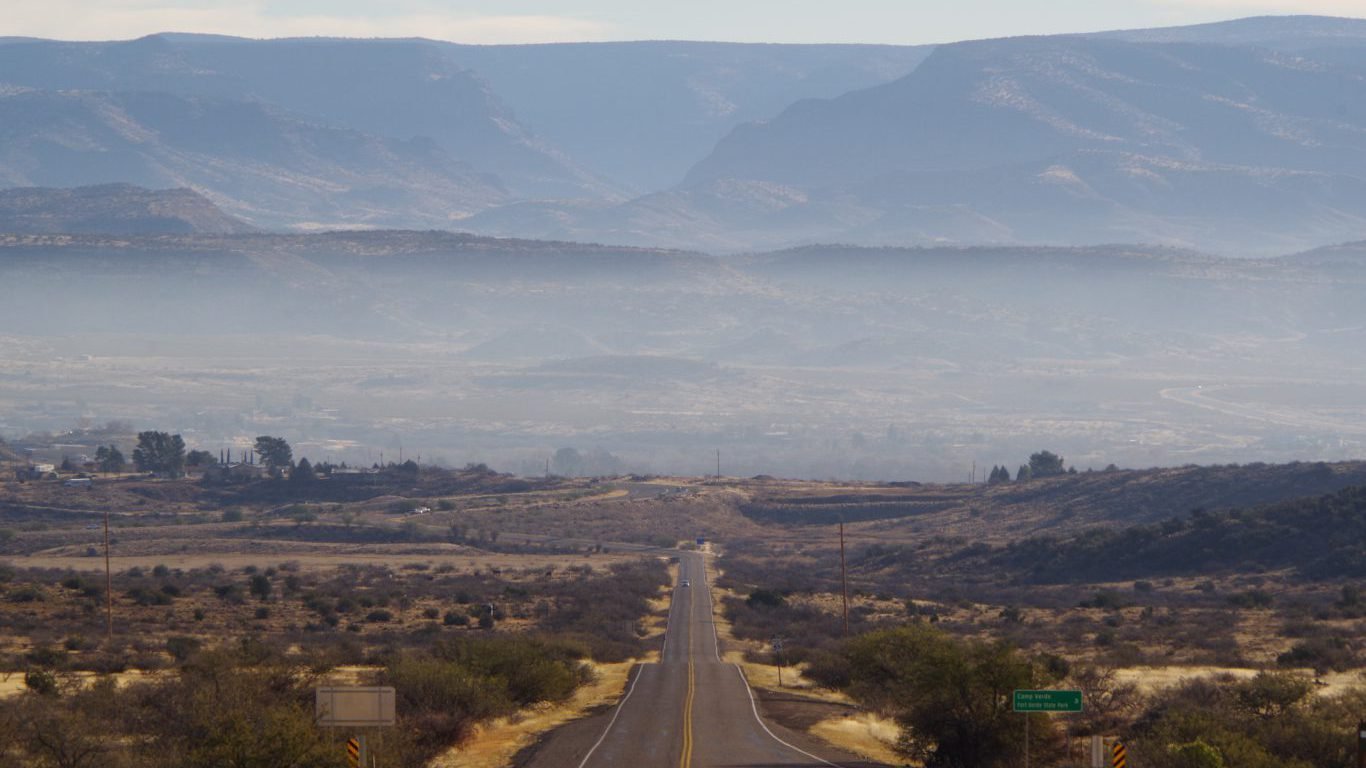
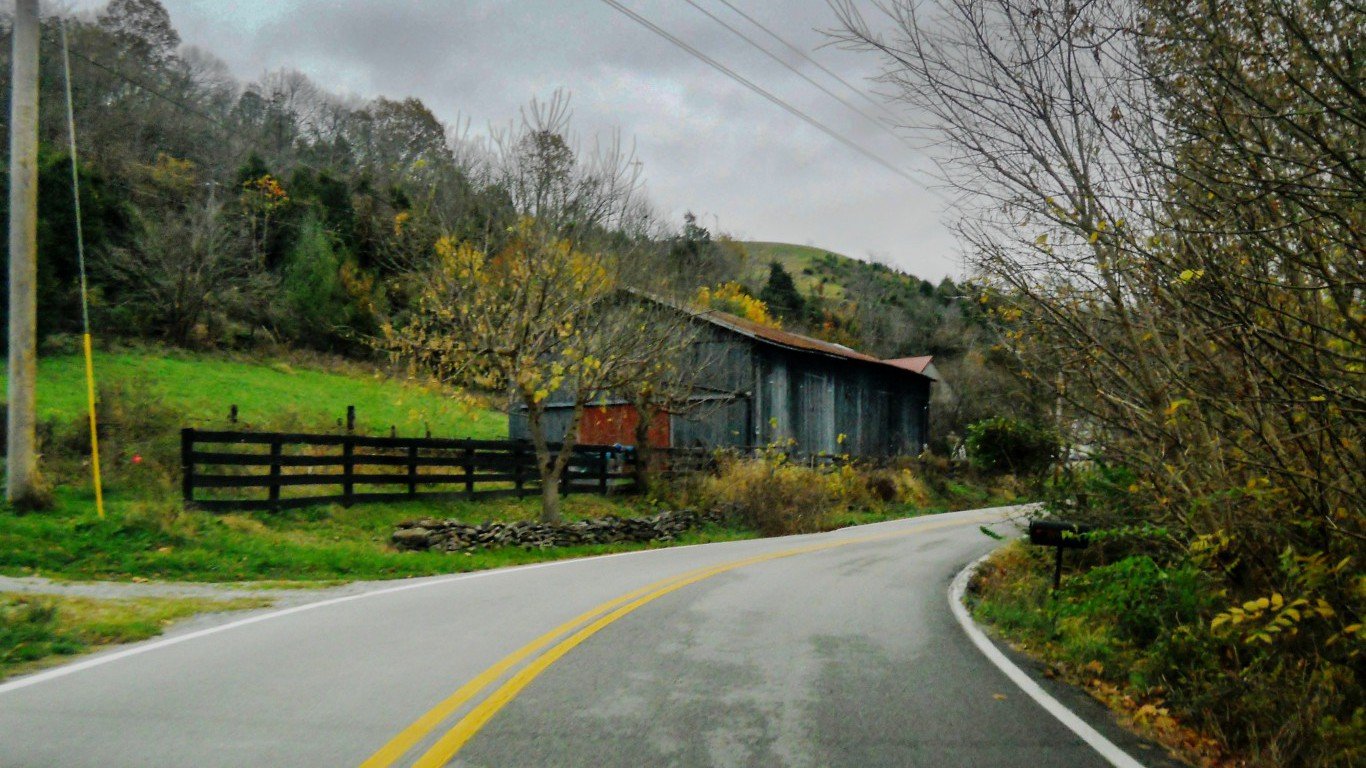
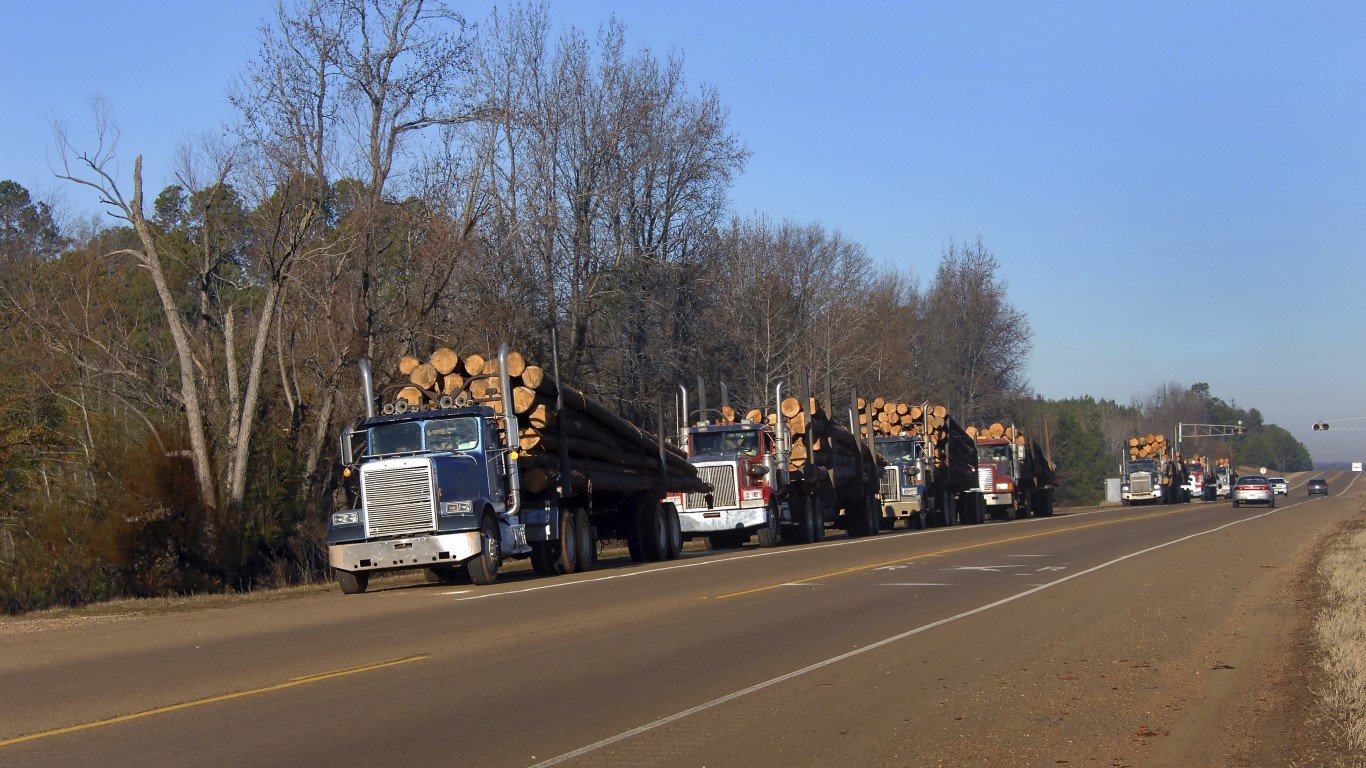
One factor that can drive up traffic fatality rates in certain states is the type of road typically traveled on. On the whole, rural roads are much less safe than those in more populated areas. Research shows that drivers tend to drive faster and more recklessly on rural roads, are less likely to wear seat belts, and are more likely to strike a wild animal crossing the road.
Click here to see the most (and least) dangerous states to drive.
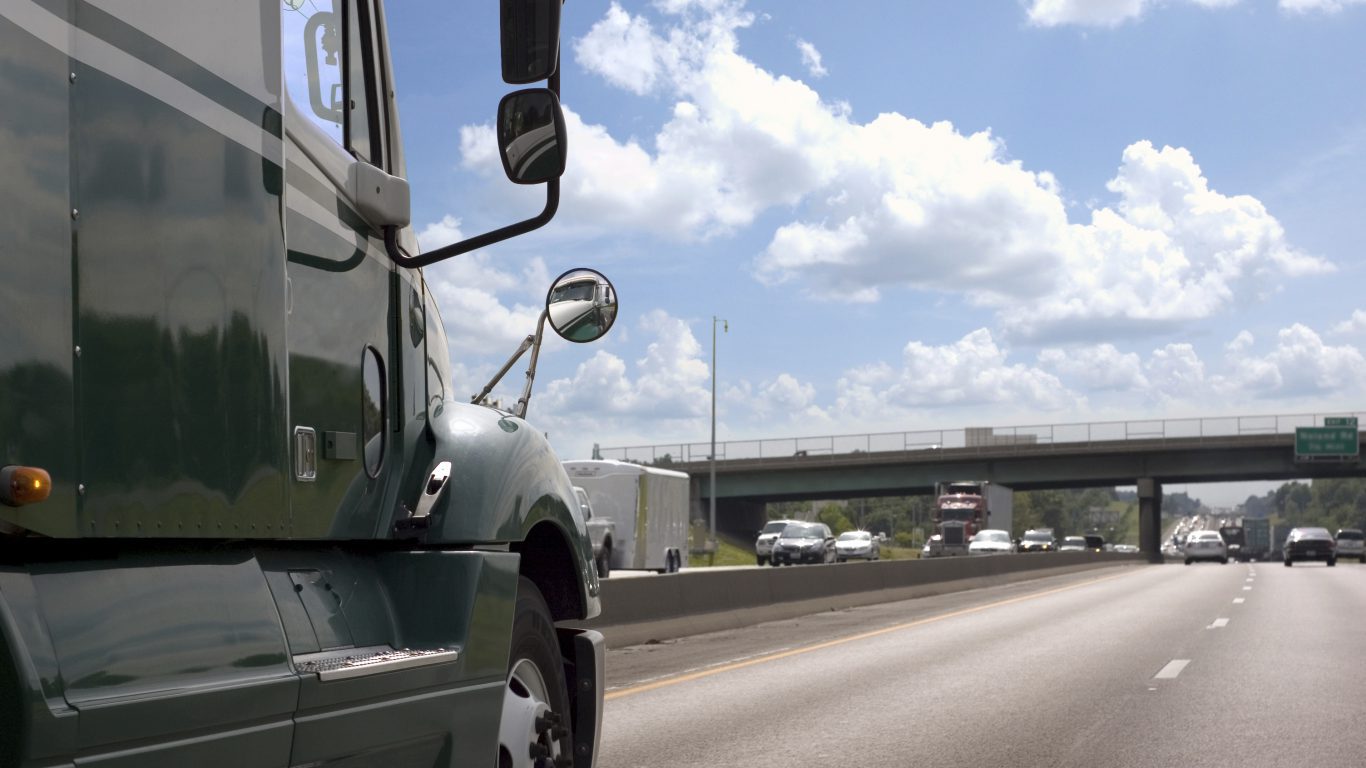
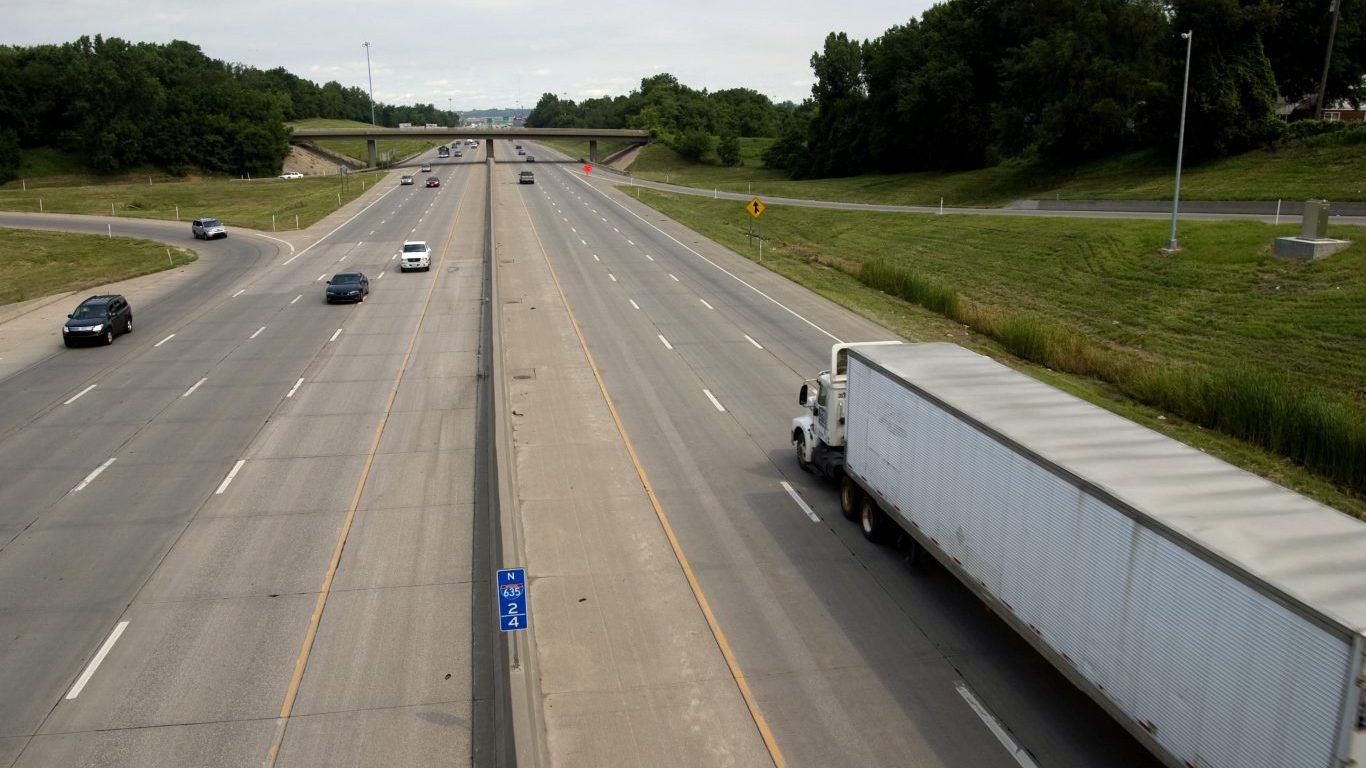
According to the Insurance Institute for Highway Safety, a nonprofit traffic safety research organization, the majority of fatal passenger vehicle and large truck accidents take place on rural roads. The organization reports: “although 19 percent of people in the U.S. live in rural areas and 30 percent of the vehicle miles traveled occur in rural areas, more than half of crash deaths occur there.”
In no state were more than 75% of the total miles traveled on rural roads, but fatal crashes on rural roads accounted for at least 75% of all vehicle deaths in 15 states. In South Carolina, 45.3% of total miles driven were on rural roads, yet 82.0% of all fatal car accidents in the state were on these roads.
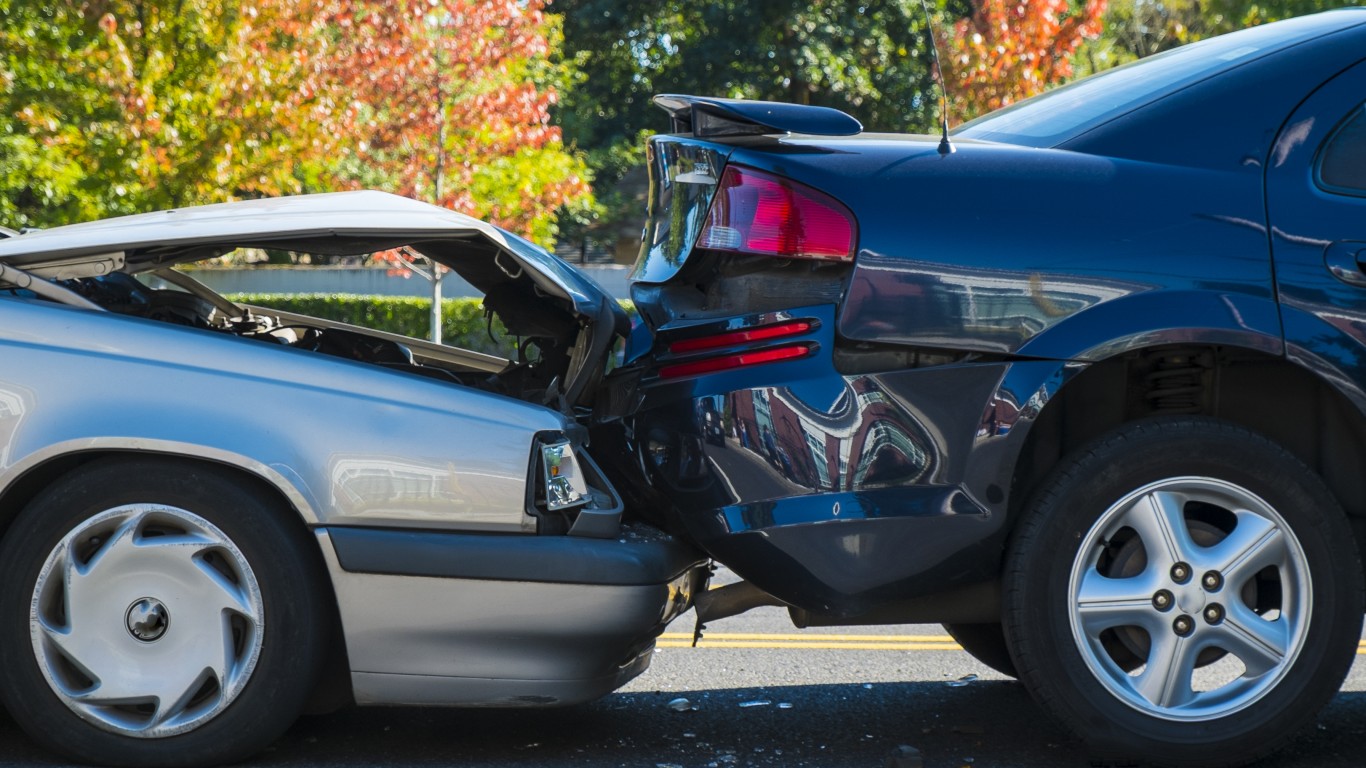
The choices drivers make can also dramatically impact the probability of a fatal accident. Seat belt use, for one, significantly reduces the likelihood of a fatality in the event of an accident. Seat belt use tends to be lower in states with the highest rate of roadway fatalities and higher in states with the lowest rates of death on the road. Nationwide, about 87% of front-seat occupants buckle up. In seven of the 10 least safe states to drive, the seat belt usage rate is below the national proportion. In 14 of the 15 most dangerous states to drive, an above average share of car crash fatalities were not wearing seat belts.
Drinking and driving remains another major cause of auto fatalities, despite numerous public service announcement campaigns and aggressive law enforcement. Nearly one-third of drivers killed in car accidents in 2014 had a blood alcohol content at or above the legal limit of 0.08. In Montana, which had one of the highest rate of fatalities per 100,000 people, 49% of drivers killed had an illegal level of alcohol in their blood, the highest proportion in the country.
To rank the safest and most dangerous states to drive in the United States, 24/7 Wall St. reviewed state by state fatality data from the International Institute for Highway Safety (IIHS) along with urban and rural travel data provided by the Federal Highway Administration (FHA), each for 2014. The number of fatal roadway deaths was then adjusted for population, noted as fatalities per 100,000 residents. Blood alcohol content levels among driver fatalities, seat belt use rates, and the share of fatal accidents on urban roads are also from IIHS, and are all for 2014. Fatal injuries due to vehicle accidents include pedestrian and cyclist fatalities.
These are the most (and least) dangerous states to drive.

50. Massachusetts
> Road deaths per 100,000: 4.9 (19th lowest)
> Total roadway fatalities in 2014: 328 (19th lowest)
> Pct. of residents using seat belts: 77% (tied-6th lowest)
> Pct. of drivers killed w/ BAC ≥ 0.08: N/A
> Pct. of fatal crashes on rural roads: 10% (the lowest)

49. Rhode Island
> Road deaths per 100,000: 4.9 (2nd lowest)
> Total roadway fatalities in 2014: 52 (2nd lowest)
> Pct. of residents using seat belts: 87% (tied-25th highest)
> Pct. of drivers killed w/ BAC ≥ 0.08: 7 (17th lowest)
> Pct. of fatal crashes on rural roads: 12% (2nd lowest)
[nativounit]

48. New York
> Road deaths per 100,000: 5.3 (7th highest)
> Total roadway fatalities in 2014: 1039 (7th highest)
> Pct. of residents using seat belts: 91% (tied-15th highest)
> Pct. of drivers killed w/ BAC ≥ 0.08: 109 (9th highest)
> Pct. of fatal crashes on rural roads: 38% (tied-12th lowest)

47. New Jersey
> Road deaths per 100,000: 6.2 (22nd highest)
> Total roadway fatalities in 2014: 556 (22nd highest)
> Pct. of residents using seat belts: 88% (tied-21st highest)
> Pct. of drivers killed w/ BAC ≥ 0.08: 65 (16th highest)
> Pct. of fatal crashes on rural roads: 14% (3rd lowest)
[recirclink id=326599]

46. Washington
> Road deaths per 100,000: 6.5 (25th lowest)
> Total roadway fatalities in 2014: 462 (25th lowest)
> Pct. of residents using seat belts: 95% (tied-5th highest)
> Pct. of drivers killed w/ BAC ≥ 0.08: 64 (17th highest)
> Pct. of fatal crashes on rural roads: 46% (16th lowest)

45. Minnesota
> Road deaths per 100,000: 6.6 (21st lowest)
> Total roadway fatalities in 2014: 361 (21st lowest)
> Pct. of residents using seat belts: 95% (tied-5th highest)
> Pct. of drivers killed w/ BAC ≥ 0.08: 55 (19th highest)
> Pct. of fatal crashes on rural roads: 73% (16th highest)

44. Hawaii
> Road deaths per 100,000: 6.7 (tied-5th lowest)
> Total roadway fatalities in 2014: 95 (tied-5th lowest)
> Pct. of residents using seat belts: 94% (tied-7th highest)
> Pct. of drivers killed w/ BAC ≥ 0.08: N/A
> Pct. of fatal crashes on rural roads: 32% (8th lowest)
[nativounit]

43. Connecticut
> Road deaths per 100,000: 6.9 (14th lowest)
> Total roadway fatalities in 2014: 248 (14th lowest)
> Pct. of residents using seat belts: 85% (tied-21st lowest)
> Pct. of drivers killed w/ BAC ≥ 0.08: N/A
> Pct. of fatal crashes on rural roads: 24% (5th lowest)

42. Vermont
> Road deaths per 100,000: 7.0 (the lowest)
> Total roadway fatalities in 2014: 44 (the lowest)
> Pct. of residents using seat belts: 84% (tied-17th lowest)
> Pct. of drivers killed w/ BAC ≥ 0.08: 5 (16th lowest)
> Pct. of fatal crashes on rural roads: 84% (6th highest)
[recirclink id=326784]

41. Illinois
> Road deaths per 100,000: 7.2 (10th highest)
> Total roadway fatalities in 2014: 924 (10th highest)
> Pct. of residents using seat belts: 94% (tied-7th highest)
> Pct. of drivers killed w/ BAC ≥ 0.08: 145 (5th highest)
> Pct. of fatal crashes on rural roads: 45% (15th lowest)

40. New Hampshire
> Road deaths per 100,000: 7.2 (tied-5th lowest)
> Total roadway fatalities in 2014: 95 (tied-5th lowest)
> Pct. of residents using seat belts: 70% (2nd lowest)
> Pct. of drivers killed w/ BAC ≥ 0.08: 19 (tied-20th lowest)
> Pct. of fatal crashes on rural roads: 51% (tied-24th lowest)

39. Maryland
> Road deaths per 100,000: 7.4 (24th lowest)
> Total roadway fatalities in 2014: 442 (24th lowest)
> Pct. of residents using seat belts: 92% (tied-12th highest)
> Pct. of drivers killed w/ BAC ≥ 0.08: 53 (21st highest)
> Pct. of fatal crashes on rural roads: 34% (9th lowest)
[recirclink id=327122]

38. California
> Road deaths per 100,000: 7.9 (2nd highest)
> Total roadway fatalities in 2014: 3074 (2nd highest)
> Pct. of residents using seat belts: 97% (tied-2nd highest)
> Pct. of drivers killed w/ BAC ≥ 0.08: 359 (the highest)
> Pct. of fatal crashes on rural roads: 38% (tied-12th lowest)

37. Virginia
> Road deaths per 100,000: 8.4 (18th highest)
> Total roadway fatalities in 2014: 703 (18th highest)
> Pct. of residents using seat belts: 77% (tied-6th lowest)
> Pct. of drivers killed w/ BAC ≥ 0.08: 113 (8th highest)
> Pct. of fatal crashes on rural roads: 65% (22nd highest)
[nativounit]

36. Ohio
> Road deaths per 100,000: 8.7 (8th highest)
> Total roadway fatalities in 2014: 1006 (8th highest)
> Pct. of residents using seat belts: 85% (tied-21st lowest)
> Pct. of drivers killed w/ BAC ≥ 0.08: 166 (4th highest)
> Pct. of fatal crashes on rural roads: 49% (tied-20th lowest)

35. Utah
> Road deaths per 100,000: 8.7 (15th lowest)
> Total roadway fatalities in 2014: 256 (15th lowest)
> Pct. of residents using seat belts: 83% (14th lowest)
> Pct. of drivers killed w/ BAC ≥ 0.08: 19 (tied-20th lowest)
> Pct. of fatal crashes on rural roads: 49% (tied-20th lowest)
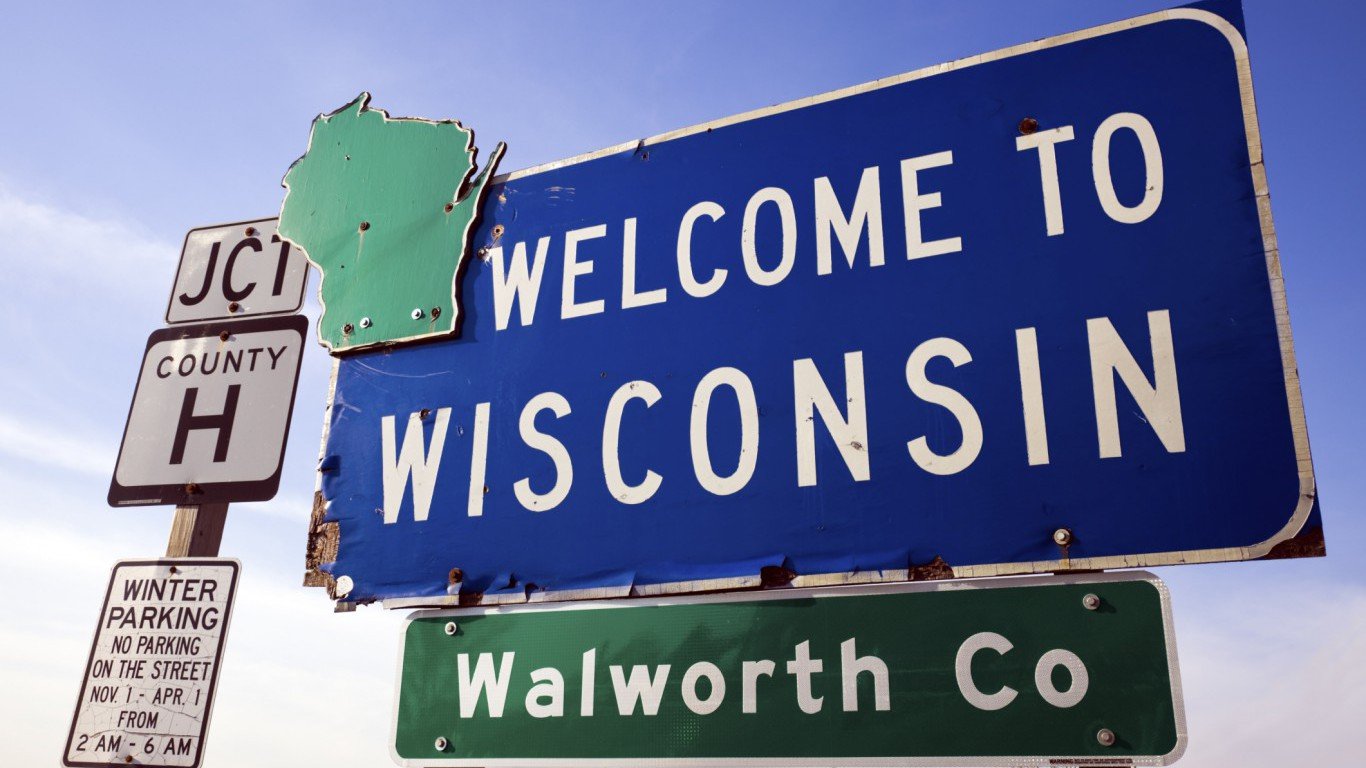
34. Wisconsin
> Road deaths per 100,000: 8.8 (23rd highest)
> Total roadway fatalities in 2014: 507 (23rd highest)
> Pct. of residents using seat belts: 85% (tied-21st lowest)
> Pct. of drivers killed w/ BAC ≥ 0.08: 88 (12th highest)
> Pct. of fatal crashes on rural roads: 67% (19th highest)
[recirclink id=327858]

33. Oregon
> Road deaths per 100,000: 9.0 (20th lowest)
> Total roadway fatalities in 2014: 357 (20th lowest)
> Pct. of residents using seat belts: 98% (the highest)
> Pct. of drivers killed w/ BAC ≥ 0.08: 57 (18th highest)
> Pct. of fatal crashes on rural roads: 66% (tied-20th highest)

32. Colorado
> Road deaths per 100,000: 9.1 (24th highest)
> Total roadway fatalities in 2014: 488 (24th highest)
> Pct. of residents using seat belts: 82% (13th lowest)
> Pct. of drivers killed w/ BAC ≥ 0.08: 81 (13th highest)
> Pct. of fatal crashes on rural roads: 47% (tied-18th lowest)
[nativounit]
31. Michigan
> Road deaths per 100,000: 9.1 (11th highest)
> Total roadway fatalities in 2014: 901 (11th highest)
> Pct. of residents using seat belts: 93% (tied-10th highest)
> Pct. of drivers killed w/ BAC ≥ 0.08: N/A
> Pct. of fatal crashes on rural roads: 42% (14th lowest)

30. Pennsylvania
> Road deaths per 100,000: 9.3 (5th highest)
> Total roadway fatalities in 2014: 1195 (5th highest)
> Pct. of residents using seat belts: 84% (tied-17th lowest)
> Pct. of drivers killed w/ BAC ≥ 0.08: 173 (3rd highest)
> Pct. of fatal crashes on rural roads: 51% (tied-24th lowest)

29. Maine
> Road deaths per 100,000: 9.8 (7th lowest)
> Total roadway fatalities in 2014: 131 (7th lowest)
> Pct. of residents using seat belts: 85% (tied-21st lowest)
> Pct. of drivers killed w/ BAC ≥ 0.08: 22 (22nd lowest)
> Pct. of fatal crashes on rural roads: 89% (3rd highest)
[nativounit]

28. Alaska
> Road deaths per 100,000: 9.9 (3rd lowest)
> Total roadway fatalities in 2014: 73 (3rd lowest)
> Pct. of residents using seat belts: 88% (tied-21st highest)
> Pct. of drivers killed w/ BAC ≥ 0.08: 10 (18th lowest)
> Pct. of fatal crashes on rural roads: 58% (25th lowest)

27. Nevada
> Road deaths per 100,000: 10.2 (17th lowest)
> Total roadway fatalities in 2014: 290 (17th lowest)
> Pct. of residents using seat belts: 94% (tied-7th highest)
> Pct. of drivers killed w/ BAC ≥ 0.08: 35 (tied-25th highest)
> Pct. of fatal crashes on rural roads: 31% (tied-7th lowest)
[recirclink id=327134]
26. Iowa
> Road deaths per 100,000: 10.3 (18th lowest)
> Total roadway fatalities in 2014: 321 (18th lowest)
> Pct. of residents using seat belts: 93% (tied-10th highest)
> Pct. of drivers killed w/ BAC ≥ 0.08: N/A
> Pct. of fatal crashes on rural roads: 79% (tied-10th highest)
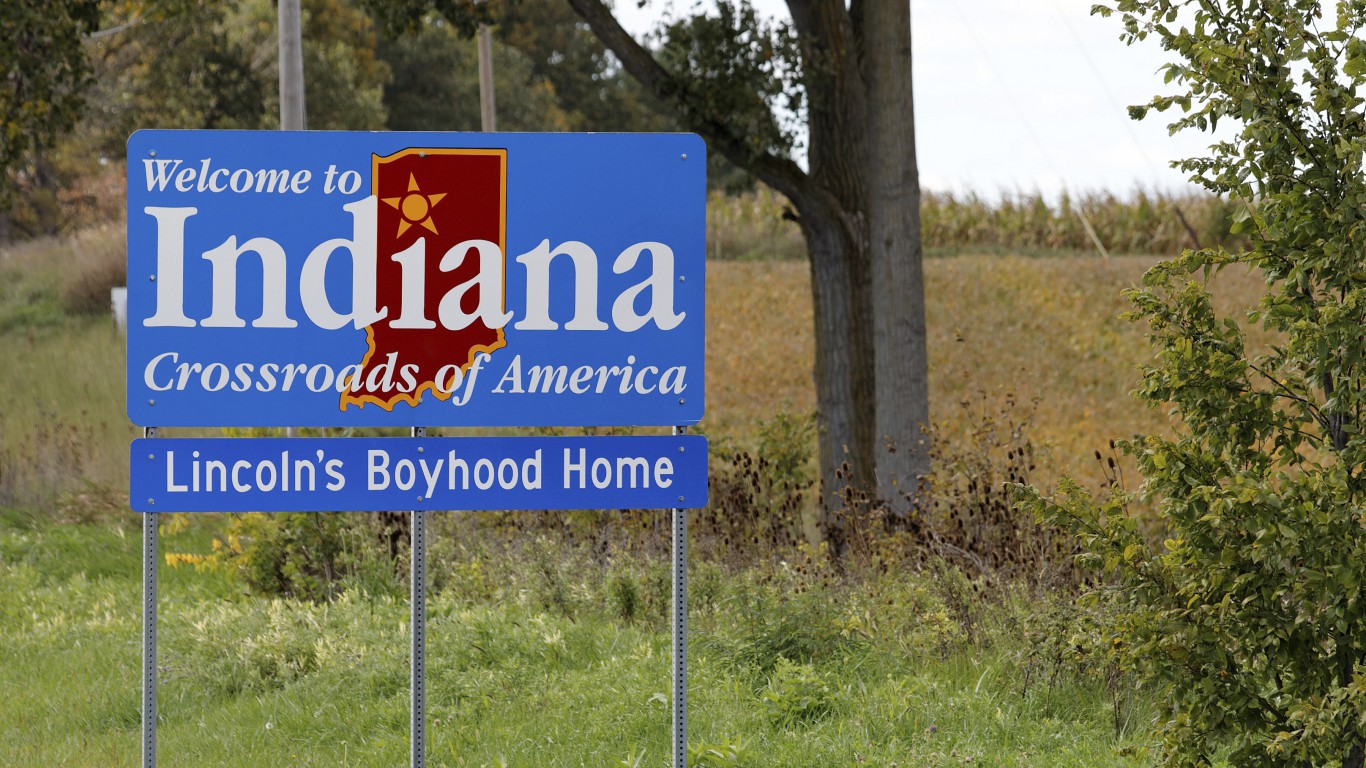
25. Indiana
> Road deaths per 100,000: 11.3 (16th highest)
> Total roadway fatalities in 2014: 746 (16th highest)
> Pct. of residents using seat belts: 90% (tied-18th highest)
> Pct. of drivers killed w/ BAC ≥ 0.08: N/A
> Pct. of fatal crashes on rural roads: 64% (tied-23rd highest)
24. Arizona
> Road deaths per 100,000: 11.4 (14th highest)
> Total roadway fatalities in 2014: 770 (14th highest)
> Pct. of residents using seat belts: 87% (tied-25th highest)
> Pct. of drivers killed w/ BAC ≥ 0.08: 80 (14th highest)
> Pct. of fatal crashes on rural roads: 37% (10th lowest)
[nativounit]

23. Idaho
> Road deaths per 100,000: 11.4 (11th lowest)
> Total roadway fatalities in 2014: 186 (11th lowest)
> Pct. of residents using seat belts: 80% (11th lowest)
> Pct. of drivers killed w/ BAC ≥ 0.08: N/A
> Pct. of fatal crashes on rural roads: 81% (tied-8th highest)

22. Georgia
> Road deaths per 100,000: 11.5 (6th highest)
> Total roadway fatalities in 2014: 1164 (6th highest)
> Pct. of residents using seat belts: 97% (tied-2nd highest)
> Pct. of drivers killed w/ BAC ≥ 0.08: N/A
> Pct. of fatal crashes on rural roads: 40% (13th lowest)
[recirclink id=328107]

21. Nebraska
> Road deaths per 100,000: 12.0 (13th lowest)
> Total roadway fatalities in 2014: 225 (13th lowest)
> Pct. of residents using seat belts: 79% (tied-10th lowest)
> Pct. of drivers killed w/ BAC ≥ 0.08: 42 (tied-22nd highest)
> Pct. of fatal crashes on rural roads: 79% (tied-10th highest)

20. Florida
> Road deaths per 100,000: 12.5 (3rd highest)
> Total roadway fatalities in 2014: 2494 (3rd highest)
> Pct. of residents using seat belts: 89% (20th highest)
> Pct. of drivers killed w/ BAC ≥ 0.08: N/A
> Pct. of fatal crashes on rural roads: 20% (4th lowest)
19. Missouri
> Road deaths per 100,000: 12.6 (15th highest)
> Total roadway fatalities in 2014: 766 (15th highest)
> Pct. of residents using seat belts: 79% (tied-10th lowest)
> Pct. of drivers killed w/ BAC ≥ 0.08: 117 (7th highest)
> Pct. of fatal crashes on rural roads: 61% (25th highest)
[recirclink id=328204]

18. Delaware
> Road deaths per 100,000: 12.9 (6th lowest)
> Total roadway fatalities in 2014: 121 (6th lowest)
> Pct. of residents using seat belts: 92% (tied-12th highest)
> Pct. of drivers killed w/ BAC ≥ 0.08: 21 (21st lowest)
> Pct. of fatal crashes on rural roads: 31% (tied-7th lowest)

17. North Carolina
> Road deaths per 100,000: 12.9 (4th highest)
> Total roadway fatalities in 2014: 1284 (4th highest)
> Pct. of residents using seat belts: 91% (tied-15th highest)
> Pct. of drivers killed w/ BAC ≥ 0.08: 192 (2nd highest)
> Pct. of fatal crashes on rural roads: 70% (tied-17th highest)
[nativounit]

16. Texas
> Road deaths per 100,000: 13.1 (the highest)
> Total roadway fatalities in 2014: 3538 (the highest)
> Pct. of residents using seat belts: 91% (tied-15th highest)
> Pct. of drivers killed w/ BAC ≥ 0.08: N/A
> Pct. of fatal crashes on rural roads: 50% (21st lowest)
15. Kansas
> Road deaths per 100,000: 13.3 (23rd lowest)
> Total roadway fatalities in 2014: 385 (23rd lowest)
> Pct. of residents using seat belts: 86% (tied-24th lowest)
> Pct. of drivers killed w/ BAC ≥ 0.08: N/A
> Pct. of fatal crashes on rural roads: 77% (tied-12th highest)

14. Tennessee
> Road deaths per 100,000: 14.7 (9th highest)
> Total roadway fatalities in 2014: 962 (9th highest)
> Pct. of residents using seat belts: 88% (tied-21st highest)
> Pct. of drivers killed w/ BAC ≥ 0.08: N/A
> Pct. of fatal crashes on rural roads: 47% (tied-18th lowest)
[recirclink id=328234]

13. West Virginia
> Road deaths per 100,000: 14.7 (16th lowest)
> Total roadway fatalities in 2014: 272 (16th lowest)
> Pct. of residents using seat belts: 88% (tied-21st highest)
> Pct. of drivers killed w/ BAC ≥ 0.08: 42 (tied-22nd highest)
> Pct. of fatal crashes on rural roads: 75% (15th highest)
12. Kentucky
> Road deaths per 100,000: 15.2 (19th highest)
> Total roadway fatalities in 2014: 672 (19th highest)
> Pct. of residents using seat belts: 86% (tied-24th lowest)
> Pct. of drivers killed w/ BAC ≥ 0.08: 96 (10th highest)
> Pct. of fatal crashes on rural roads: 77% (tied-12th highest)
[nativounit]
11. Arkansas
> Road deaths per 100,000: 15.7 (25th highest)
> Total roadway fatalities in 2014: 466 (25th highest)
> Pct. of residents using seat belts: 74% (tied-4th lowest)
> Pct. of drivers killed w/ BAC ≥ 0.08: 75 (15th highest)
> Pct. of fatal crashes on rural roads: 76% (14th highest)

10. Louisiana
> Road deaths per 100,000: 15.9 (17th highest)
> Total roadway fatalities in 2014: 737 (17th highest)
> Pct. of residents using seat belts: 84% (tied-17th lowest)
> Pct. of drivers killed w/ BAC ≥ 0.08: N/A
> Pct. of fatal crashes on rural roads: 51% (tied-24th lowest)

9. South Dakota
> Road deaths per 100,000: 15.9 (9th lowest)
> Total roadway fatalities in 2014: 136 (9th lowest)
> Pct. of residents using seat belts: 69% (the lowest)
> Pct. of drivers killed w/ BAC ≥ 0.08: 33 (tied-24th lowest)
> Pct. of fatal crashes on rural roads: 85% (5th highest)
[nativounit]
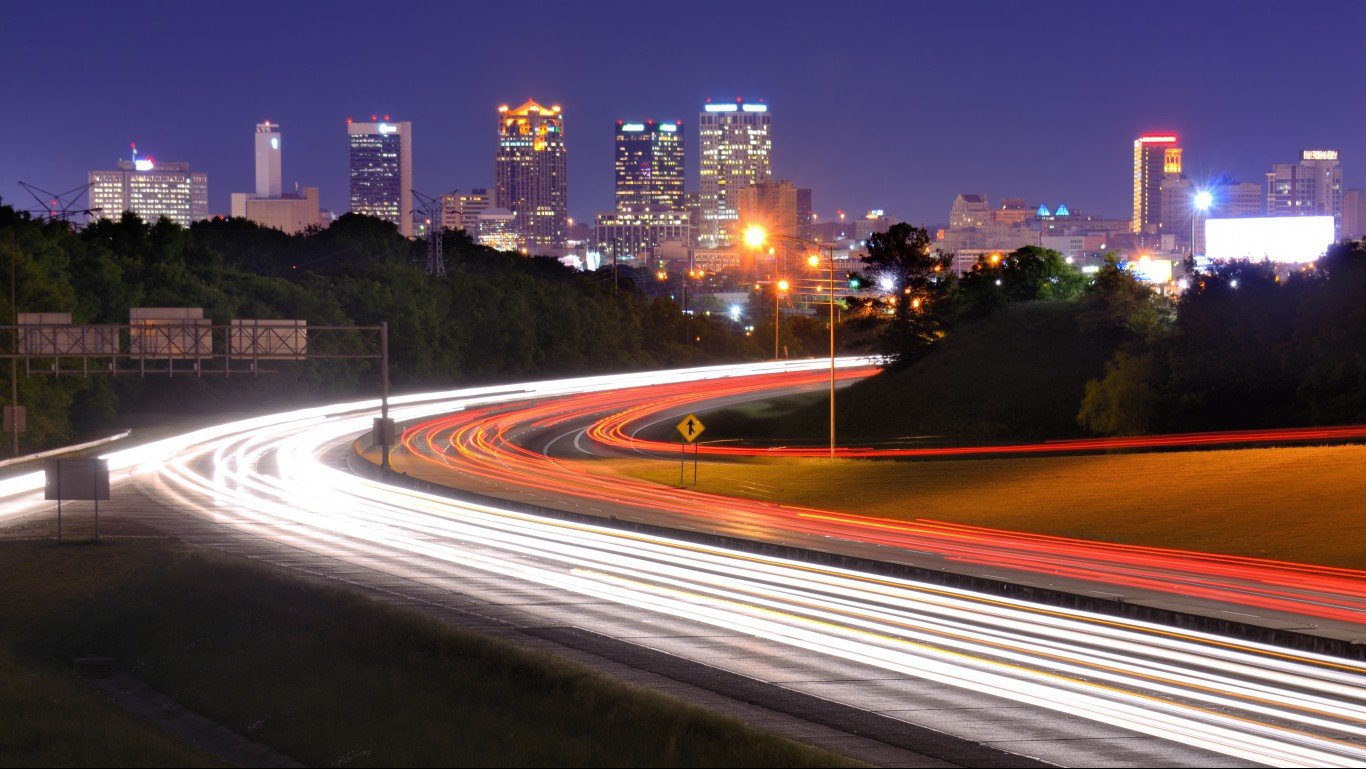
8. Alabama
> Road deaths per 100,000: 16.9 (13th highest)
> Total roadway fatalities in 2014: 820 (13th highest)
> Pct. of residents using seat belts: 96% (4th highest)
> Pct. of drivers killed w/ BAC ≥ 0.08: N/A
> Pct. of fatal crashes on rural roads: 66% (tied-20th highest)

7. South Carolina
> Road deaths per 100,000: 17.1 (12th highest)
> Total roadway fatalities in 2014: 824 (12th highest)
> Pct. of residents using seat belts: 90% (tied-18th highest)
> Pct. of drivers killed w/ BAC ≥ 0.08: 140 (6th highest)
> Pct. of fatal crashes on rural roads: 82% (7th highest)
[recirclink id=328173]

6. Oklahoma
> Road deaths per 100,000: 17.3 (20th highest)
> Total roadway fatalities in 2014: 669 (20th highest)
> Pct. of residents using seat belts: 86% (tied-24th lowest)
> Pct. of drivers killed w/ BAC ≥ 0.08: 90 (11th highest)
> Pct. of fatal crashes on rural roads: 70% (tied-17th highest)

5. North Dakota
> Road deaths per 100,000: 18.3 (8th lowest)
> Total roadway fatalities in 2014: 135 (8th lowest)
> Pct. of residents using seat belts: 81% (12th lowest)
> Pct. of drivers killed w/ BAC ≥ 0.08: 33 (tied-24th lowest)
> Pct. of fatal crashes on rural roads: 86% (4th highest)

4. New Mexico
> Road deaths per 100,000: 18.4 (22nd lowest)
> Total roadway fatalities in 2014: 383 (22nd lowest)
> Pct. of residents using seat belts: 92% (tied-12th highest)
> Pct. of drivers killed w/ BAC ≥ 0.08: 42 (tied-22nd highest)
> Pct. of fatal crashes on rural roads: 64% (tied-23rd highest)
[nativounit]

3. Montana
> Road deaths per 100,000: 18.8 (12th lowest)
> Total roadway fatalities in 2014: 192 (12th lowest)
> Pct. of residents using seat belts: 74% (tied-4th lowest)
> Pct. of drivers killed w/ BAC ≥ 0.08: 54 (20th highest)
> Pct. of fatal crashes on rural roads: 93% (the highest)

2. Mississippi
> Road deaths per 100,000: 20.3 (21st highest)
> Total roadway fatalities in 2014: 607 (21st highest)
> Pct. of residents using seat belts: 78% (7th lowest)
> Pct. of drivers killed w/ BAC ≥ 0.08: N/A
> Pct. of fatal crashes on rural roads: 91% (2nd highest)
[recirclink id=328172]

1. Wyoming
> Road deaths per 100,000: 25.7 (10th lowest)
> Total roadway fatalities in 2014: 150 (10th lowest)
> Pct. of residents using seat belts: 79% (tied-10th lowest)
> Pct. of drivers killed w/ BAC ≥ 0.08: 35 (tied-25th highest)
> Pct. of fatal crashes on rural roads: 81% (tied-8th highest)
Contact [email protected] for any questions or corrections.