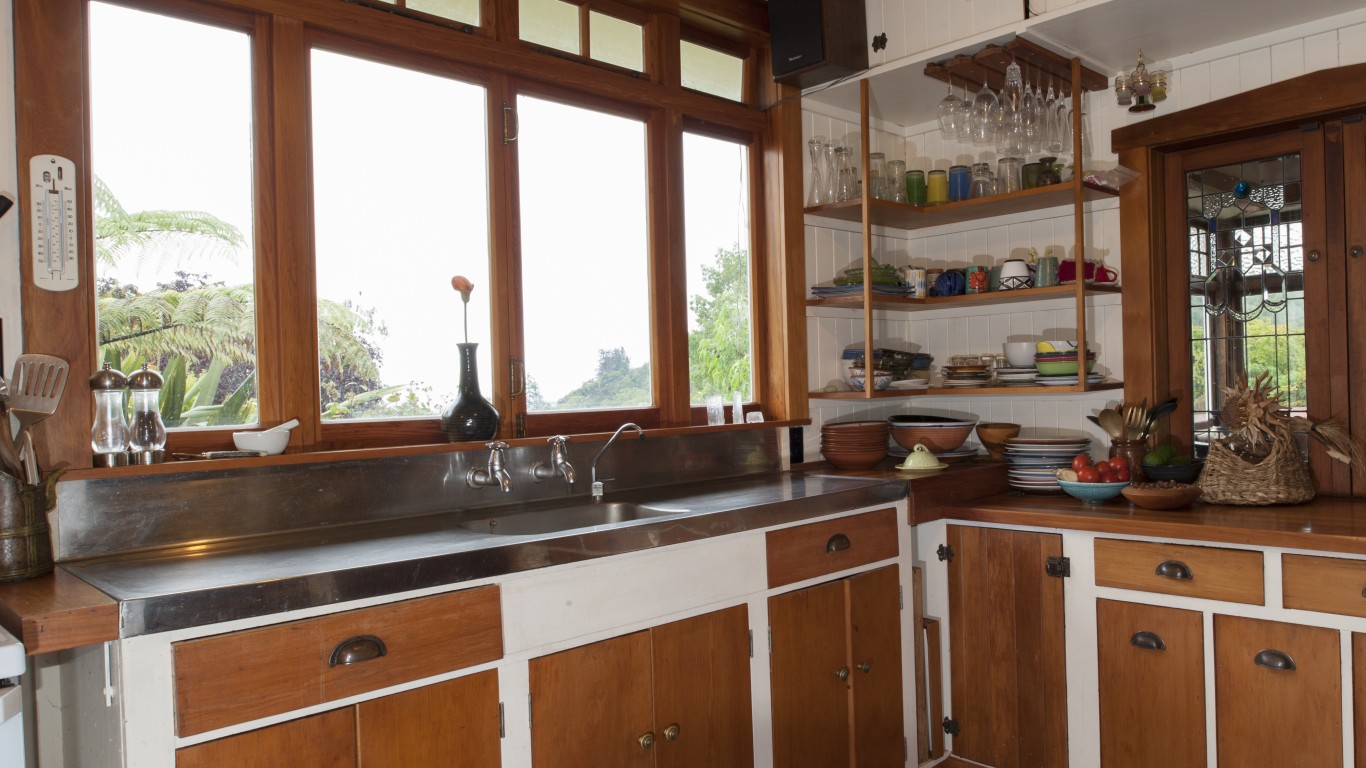
In 1940, 20.2% of U.S. homes were overcrowded, according to the Census Bureau. By 2000, that figure had fallen to just 5.7%. For many reasons, Americans today have more room than ever before.
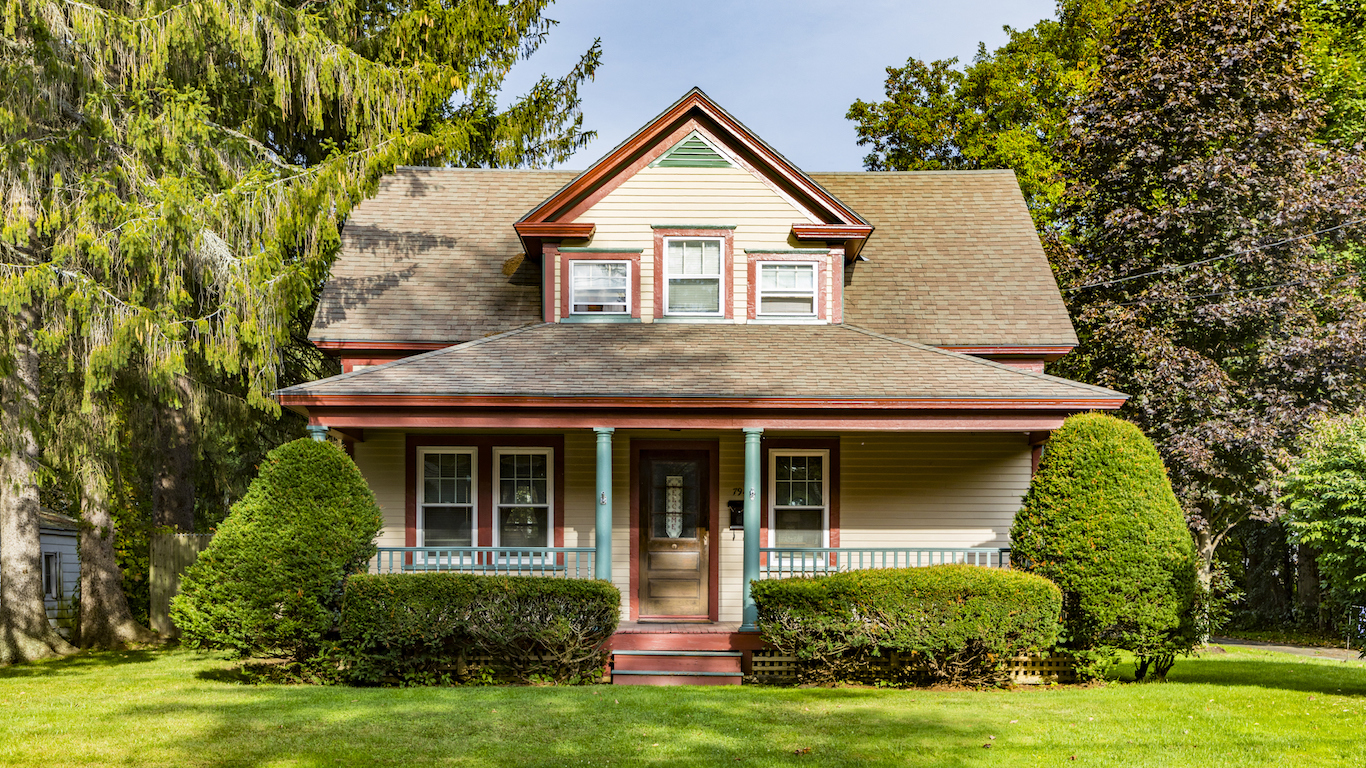
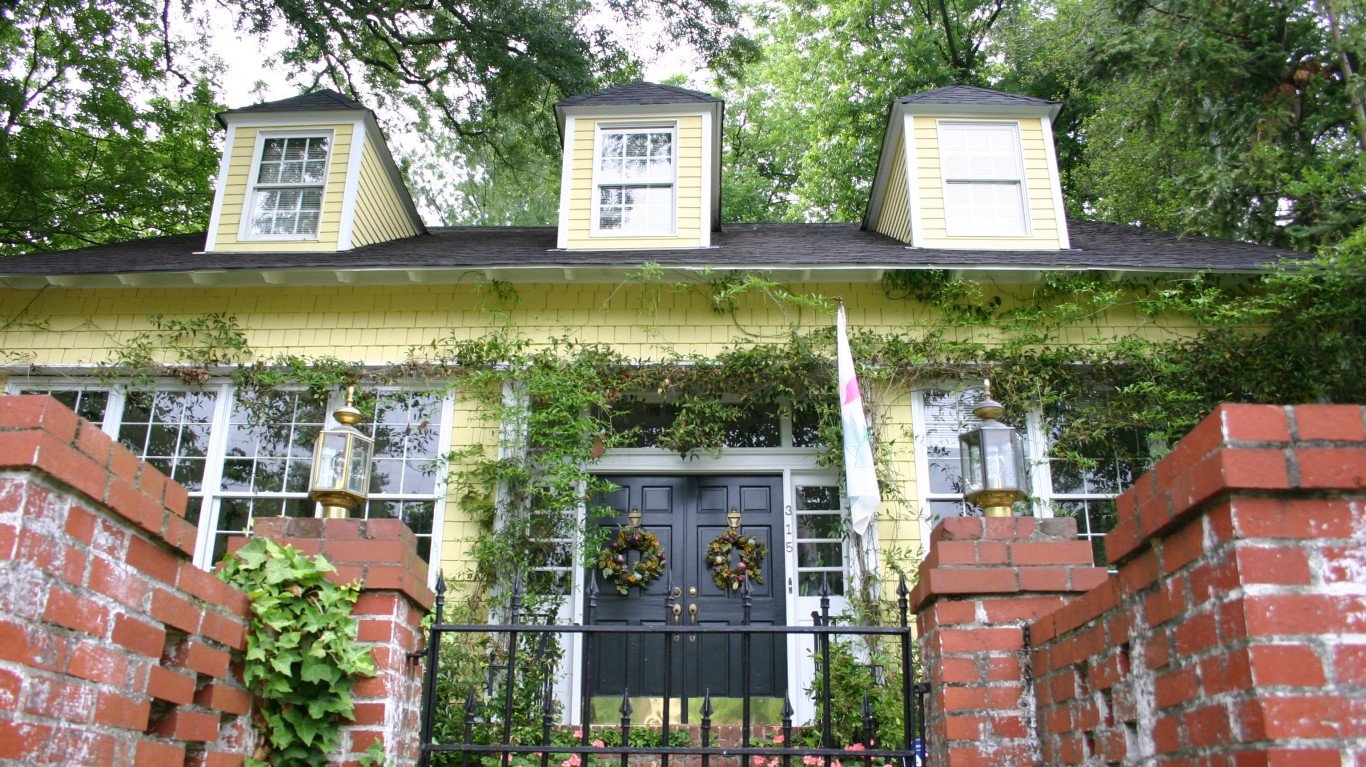
The 20th century was a period of economic growth and prosperity for the American consumer. With GDP per capita increasing from $10,164 in 1920 to $56,677 in 2015, Americans today are as wealthy as they’ve ever been. Home sizes have also increased, keeping pace with consumer demand. The average single-family home built today is 2,657 square feet, more than twice the average single-family home built in 1920.
To determine how homes have changed over the past century, 24/7 Wall St. estimated the size of a newly constructed single-family house between 1920 and 2014. The mostly uninterrupted growth in home sizes over the century was largely the result of rising incomes, changing family structure, and the proliferation of the suburbs.
Click here to see the size of a home the year you were born.
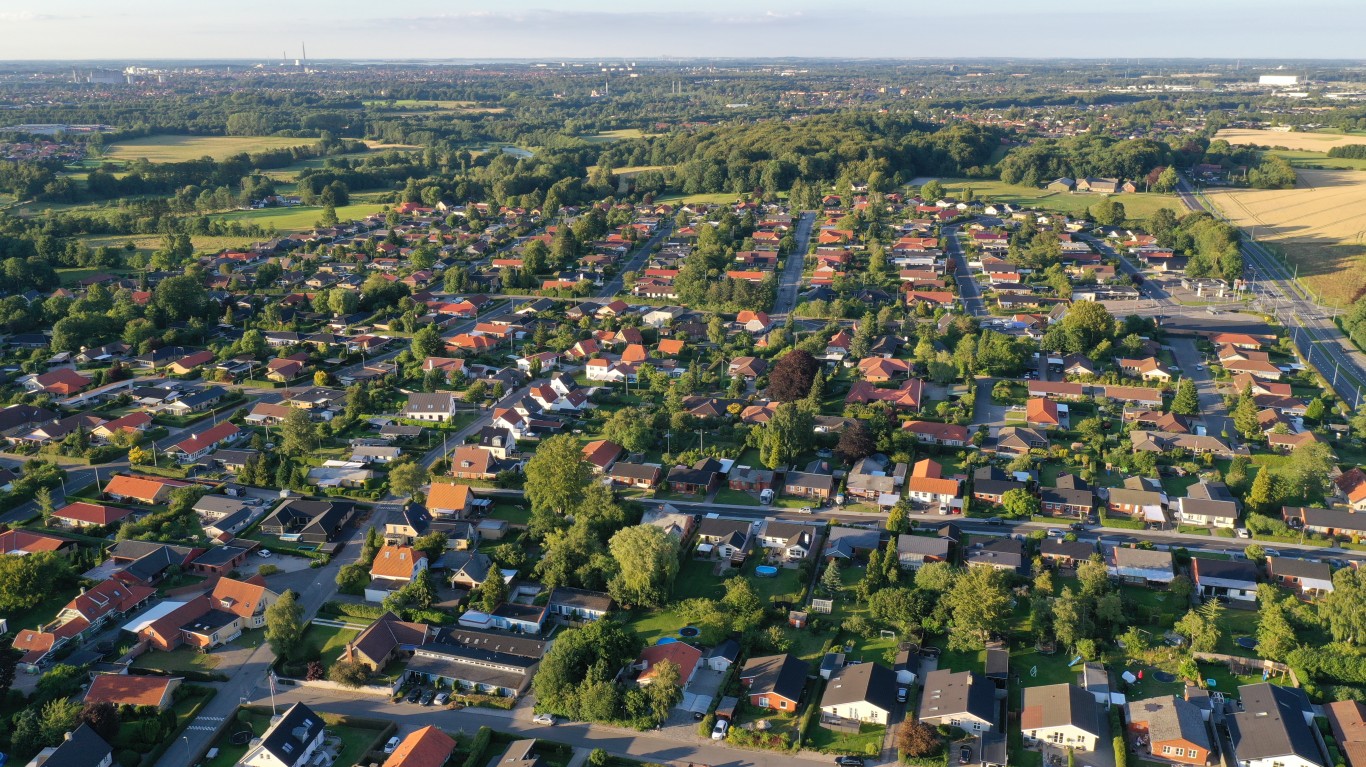
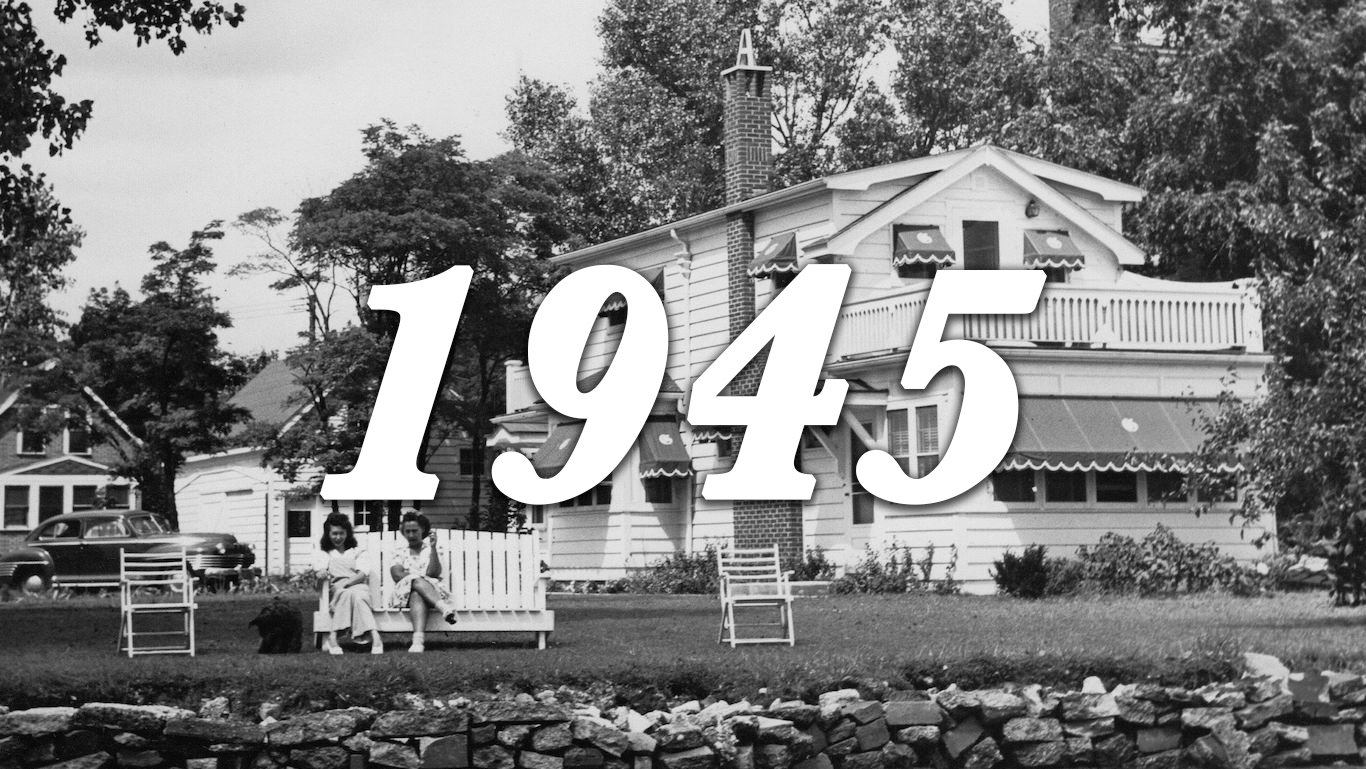
After World War II, America enjoyed a period of economic prosperity that was largely responsible for the growth of the suburbs. Between 1945 and 1946, the number of new housing contracts more than tripled, increasing from 326,000 to 1.02 million in just one year. The total value of construction grew accordingly, from $6.7 billion to $25.4 billion, adjusting for inflation.
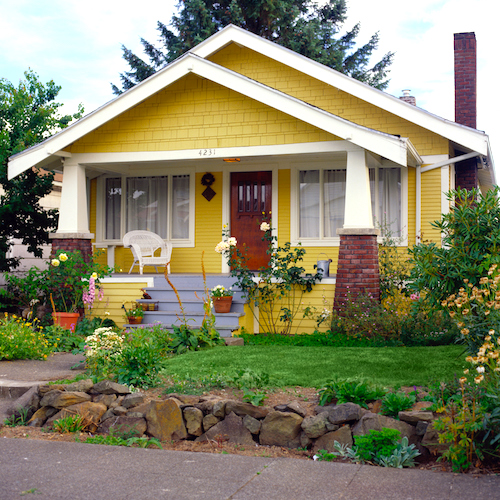
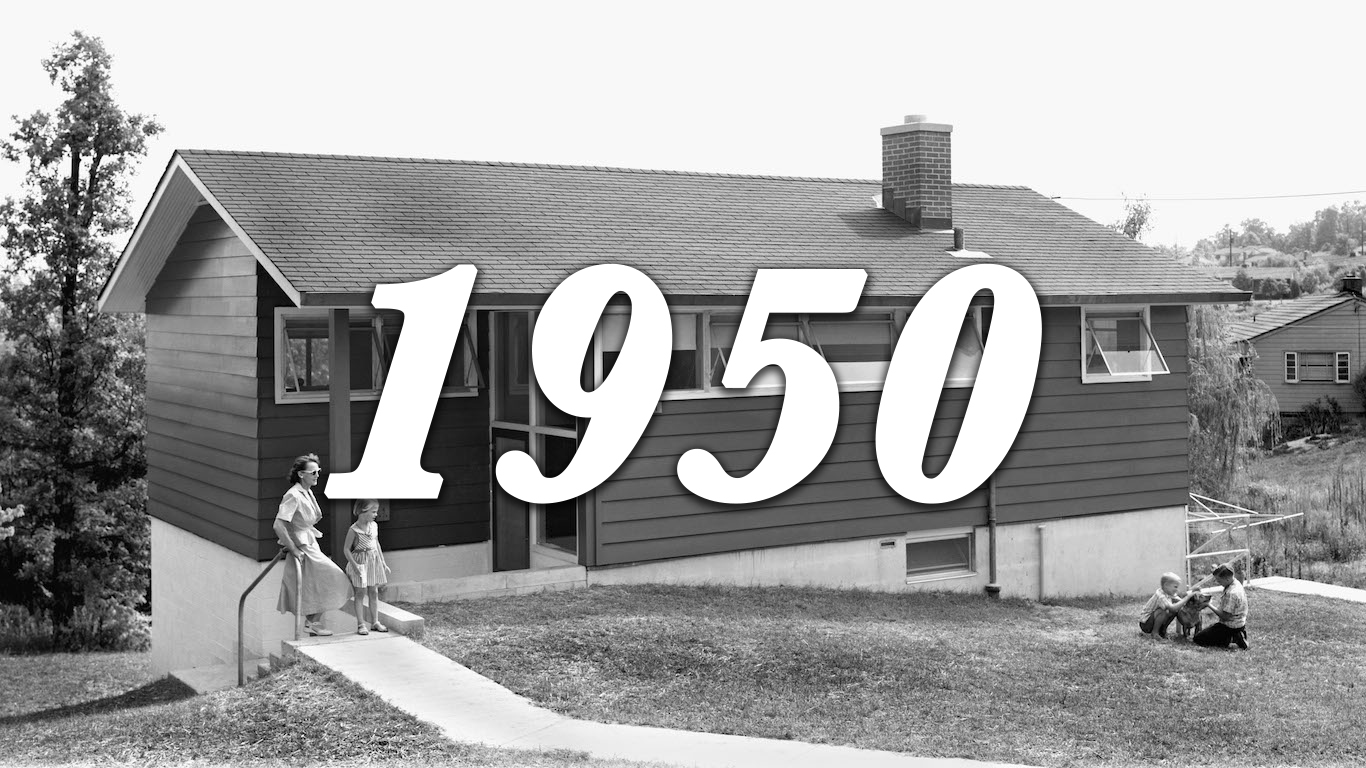
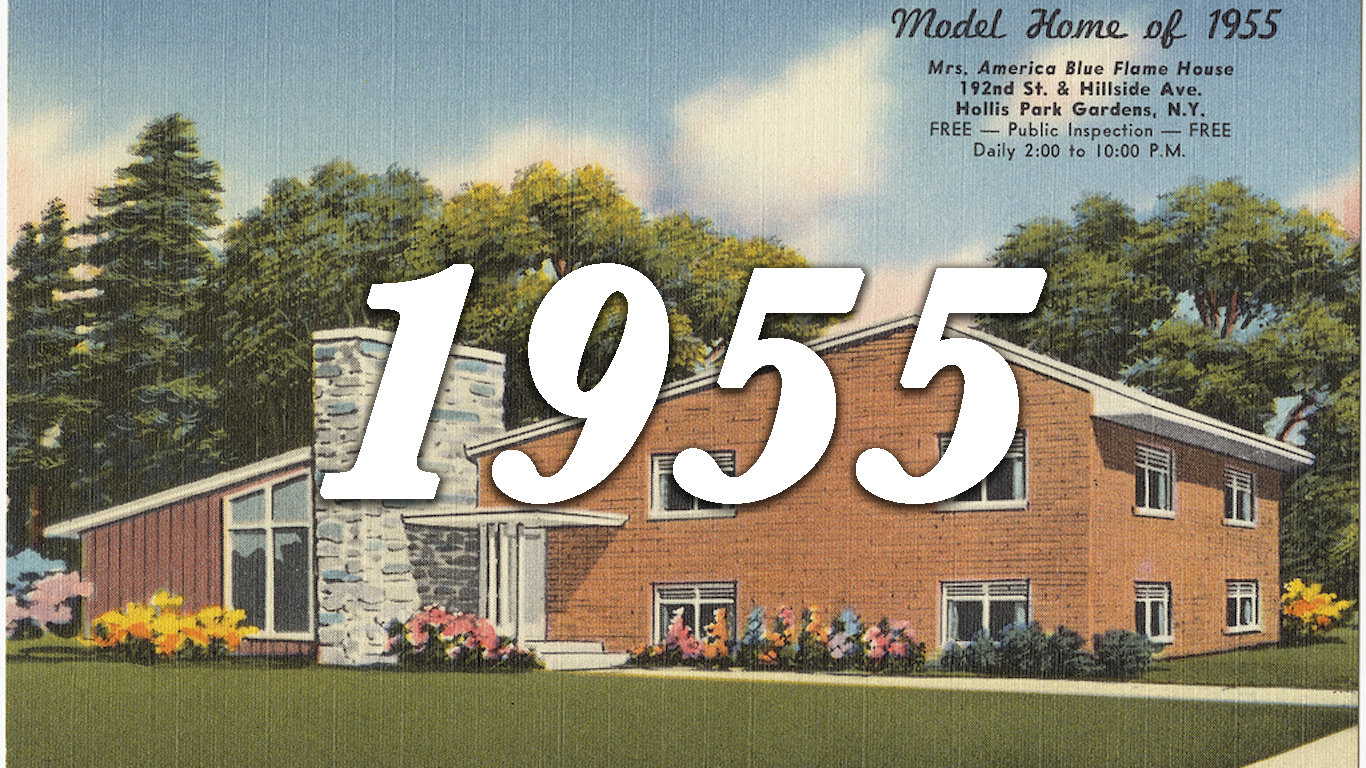
The Levittown house was a popular model for a suburban home. At just 750 square feet, the homes were relatively inexpensive and ready for mass production. In 1950, the year Time magazine estimated that Levitt and Sons built one out of every eight houses in the United States, the average size of a newly built single-family home was 983 square feet — slightly smaller than a decade prior, when it was 1,177 square feet.
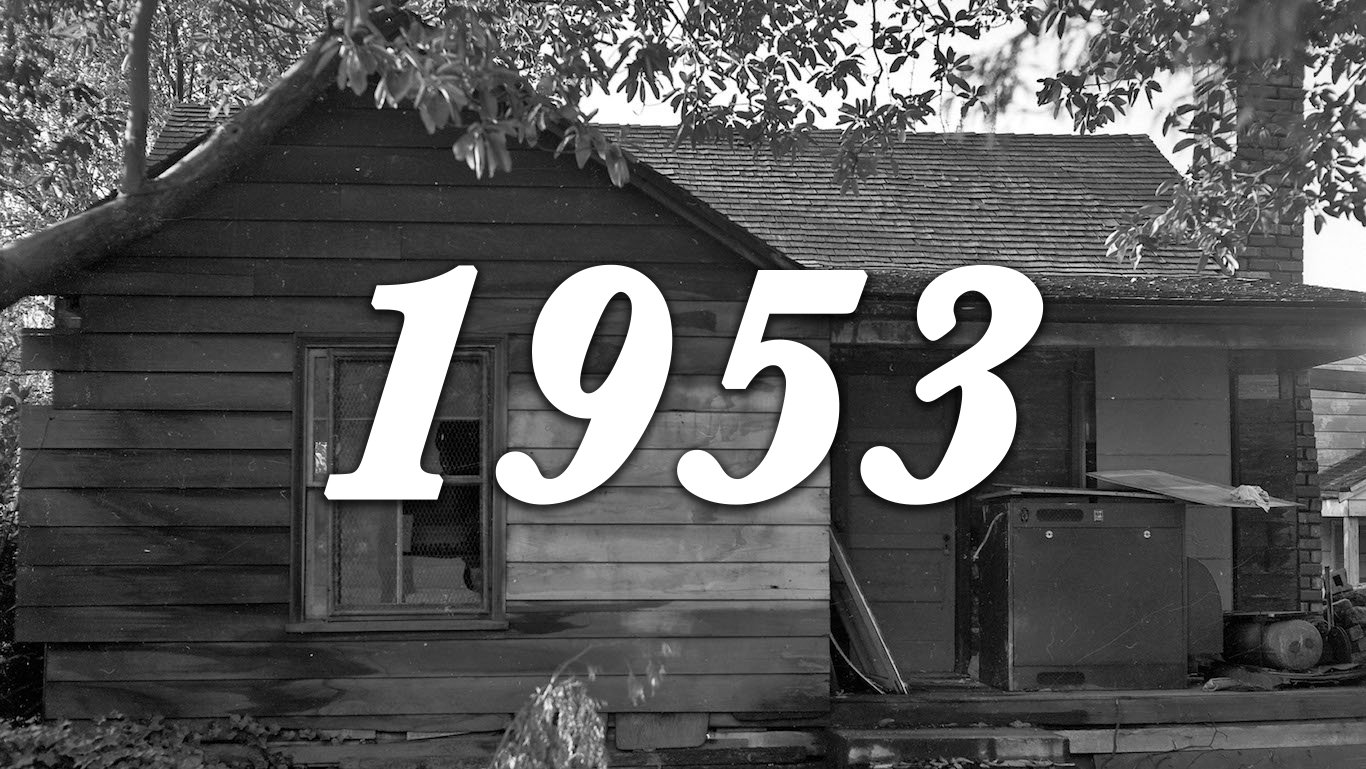
In 1920, just 9.2% of the population lived in the suburbs. By 1950, that figure had more than doubled to 23.3%, and by 2000 half of all Americans lived in the suburbs. One of the largest 10-year growth periods in home size occurred between 1953 to 1963. During that decade alone, the average size of a new single-family home grew by roughly 60%.
Americans actually have more room than their rising home sizes suggests because at the same time, the average number of occupants in a house declined, providing home dwellers with more space per person. The average household size has declined steadily from 4.34 people in 1920 to 2.54 people today, a historical low. So while the size of an average home has roughly doubled since 1920, the average square footage per person has more than quadrupled.
One major cause of the of the falling number of people in a household is the changing composition of the American family. Marriage rates are low, and many more children are growing up in one-parent households than ever before. The share of one-parent families with children under the age of 18 has grown from 7.4% of all families with children in 1950 to 31.3% in 2015. Similarly, more adults are living alone than ever before. The single-person occupancy rate increased from 7.7% in 1940 to 26.7% in 2010.
To determine the average size of a newly constructed single-family home between 1971 and 2014, 24/7 Wall St. used survey data from the Census Bureau’s American Housing Survey. For years between 1963 and 1970, we used data from the Census Bureau’s U.S. Department of Housing and Urban Development’s 1969 “Characteristics of New One-Family Homes” construction report. For the years 1940, 1950, and 1954 to 1956, we used the Bureau of Labor Statistics New Housing and its Materials 1940-56 report. For all other years, we estimated the average size of a newly constructed home using construction data on residential housing starts and total residential floor space constructed in a given year from the Census Bureau’s annual “Statistical Abstracts of the United States” and its “Historical Statistics of the United States, Colonial Times to 1970” report. We took the quotient of total residential floor space and total residential housing starts and made adjustments to account for the inclusion of multi-family housing units and exclusion of various states in the national tally of total floor space constructed. We also adjusted housing starts to better approximate housing completions. Average household size also came from the Census Bureau. GDP per capita figures for years 1929 to 2014 are from the Bureau of Economic Analysis. GDP per capita figures for years 1920 to 1928, which were not available from the BEA, came from estimates by the Maddison Project.
This is the average size of a home from 1920 to 2014.
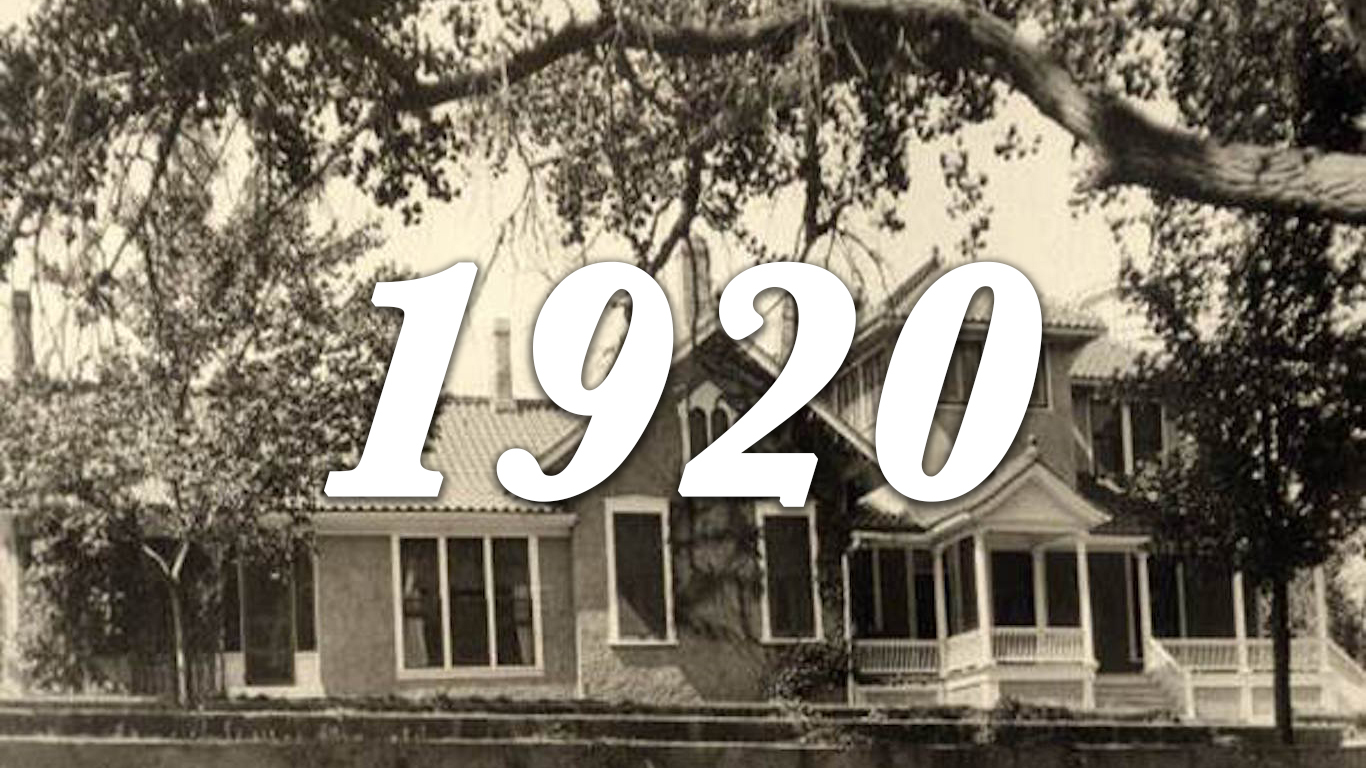
> Avg. floor area of a new single-family home: 1,048 sq ft
> Avg. floor area per person: 242 sq ft
> New homes started: 247,000
> GDP per capita: $10,164
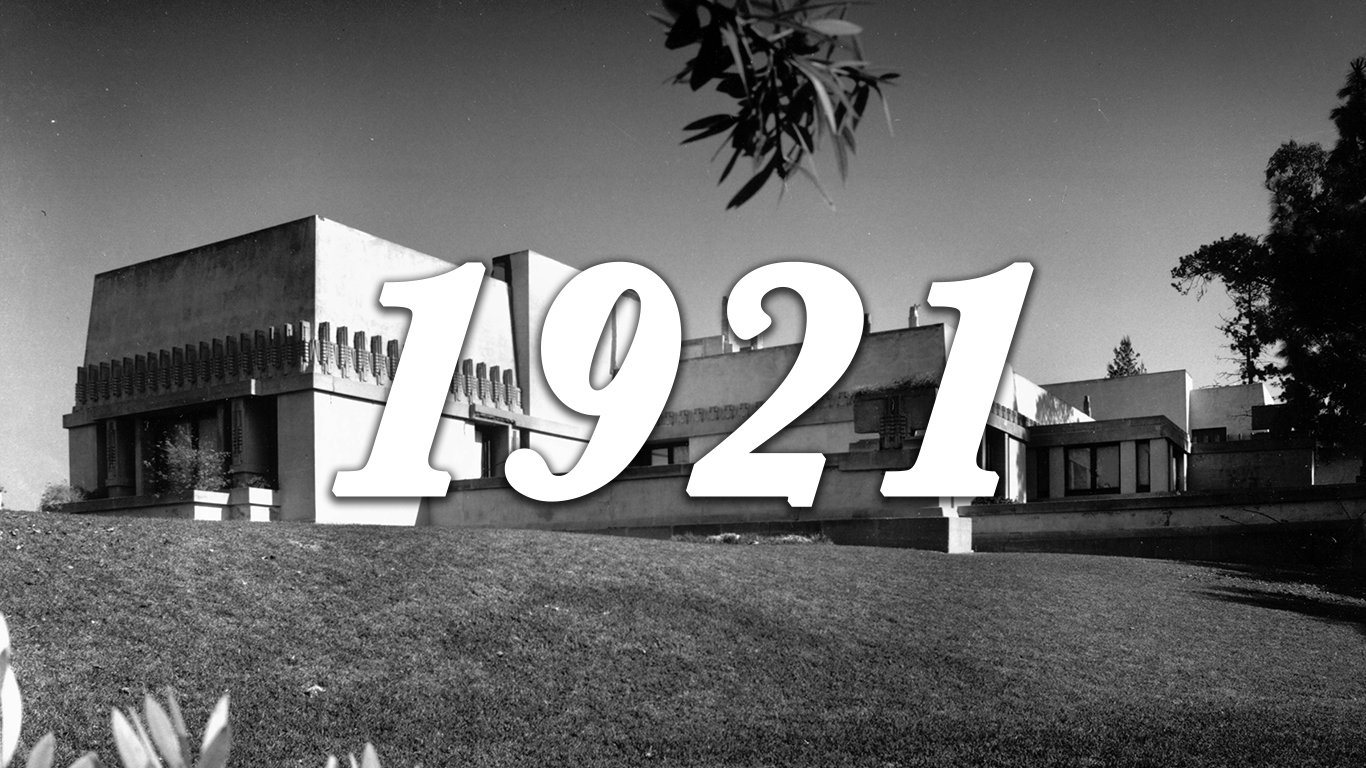
> Avg. floor area of a new single-family home: 1,011 sq ft
> Avg. floor area per person: 233 sq ft
> New homes started: 449,000
> GDP per capita: $9,743
[nativounit]
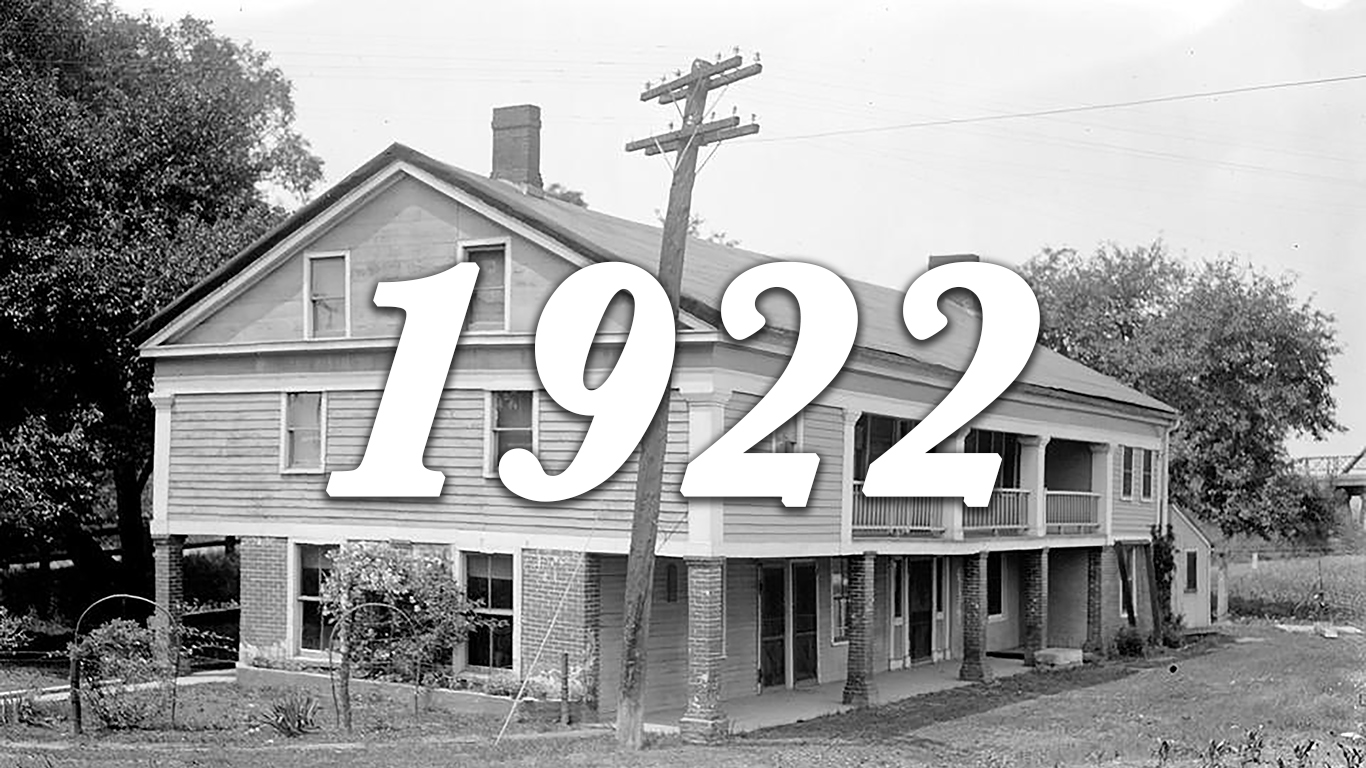
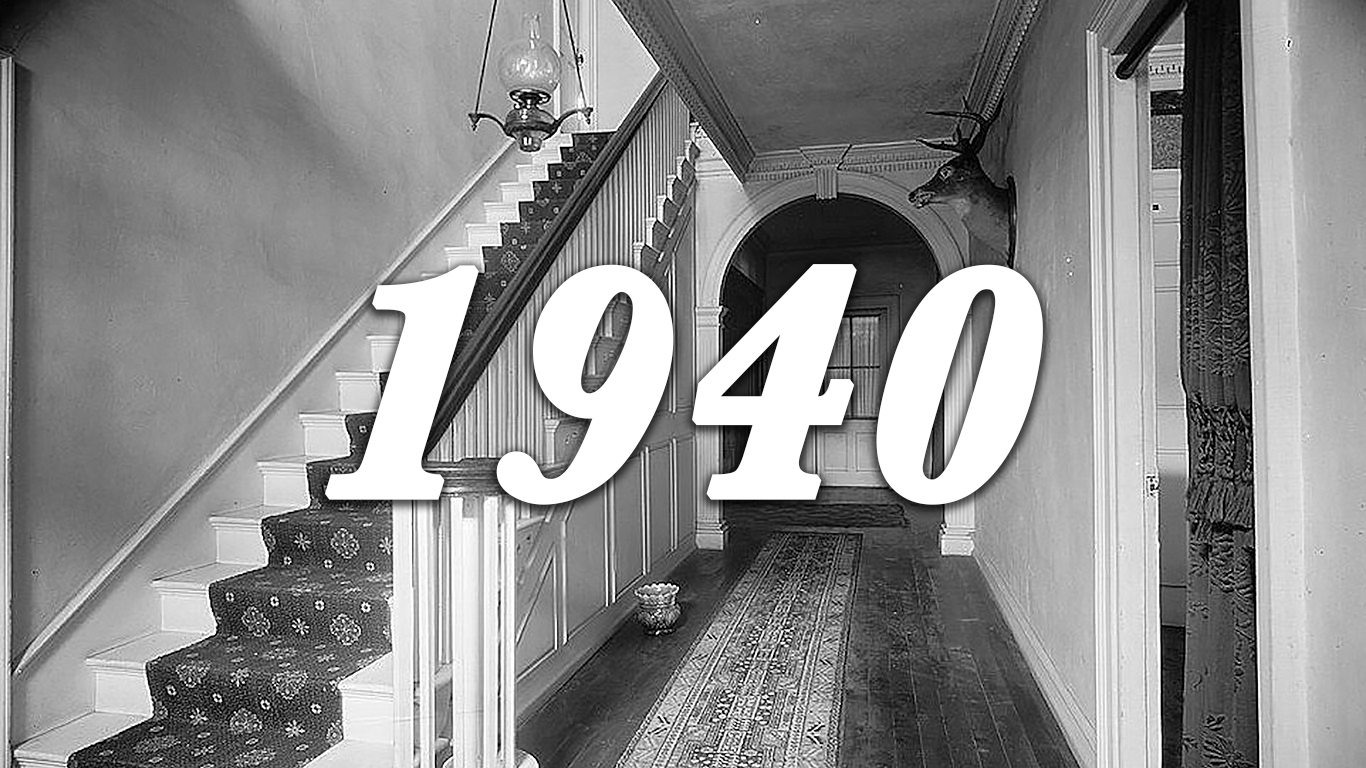
> Avg. floor area of a new single-family home: 818 sq ft
> Avg. floor area per person: 188 sq ft
> New homes started: 716,000
> GDP per capita: $10,141

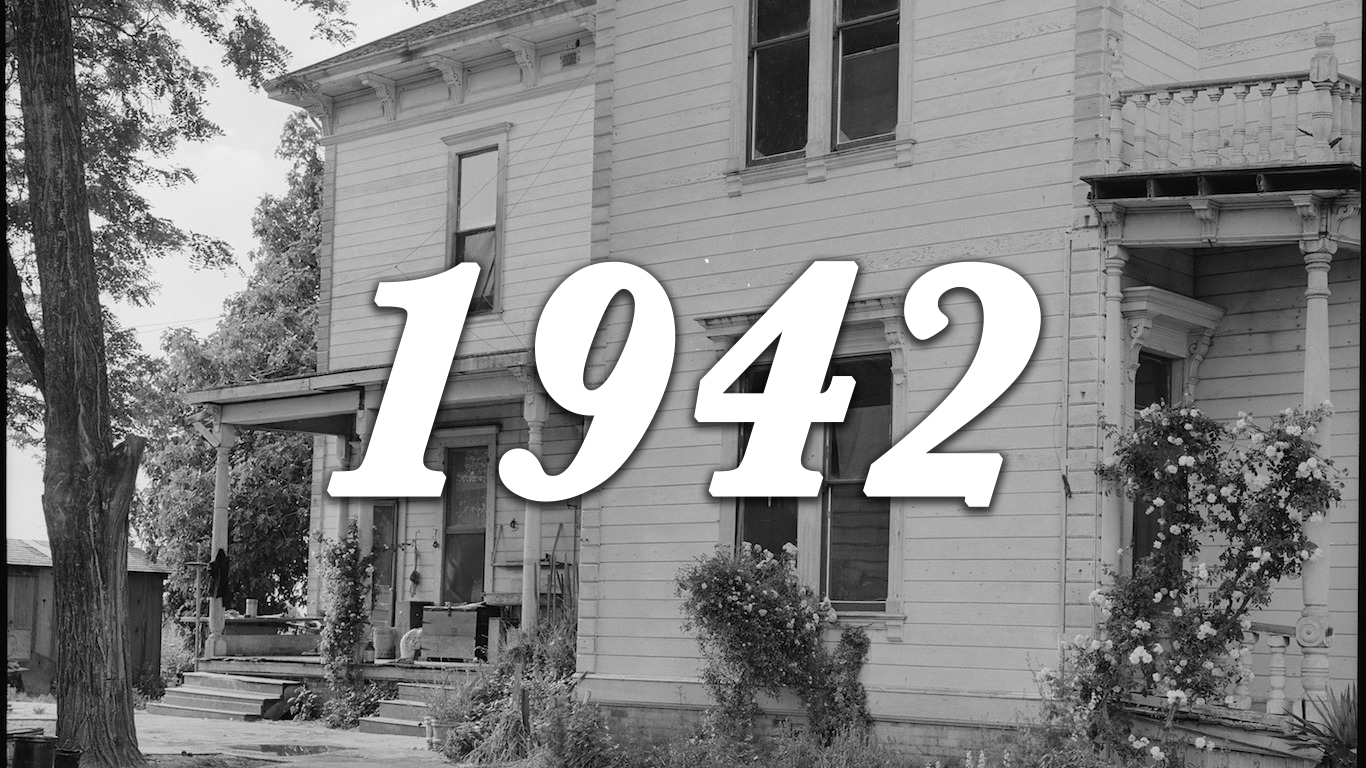
> Avg. floor area of a new single-family home: 742 sq. ft
> Avg. floor area per person: 171 sq. ft
> New homes started: 871,000
> GDP per capita: $11,284
[recirclink id=333406]

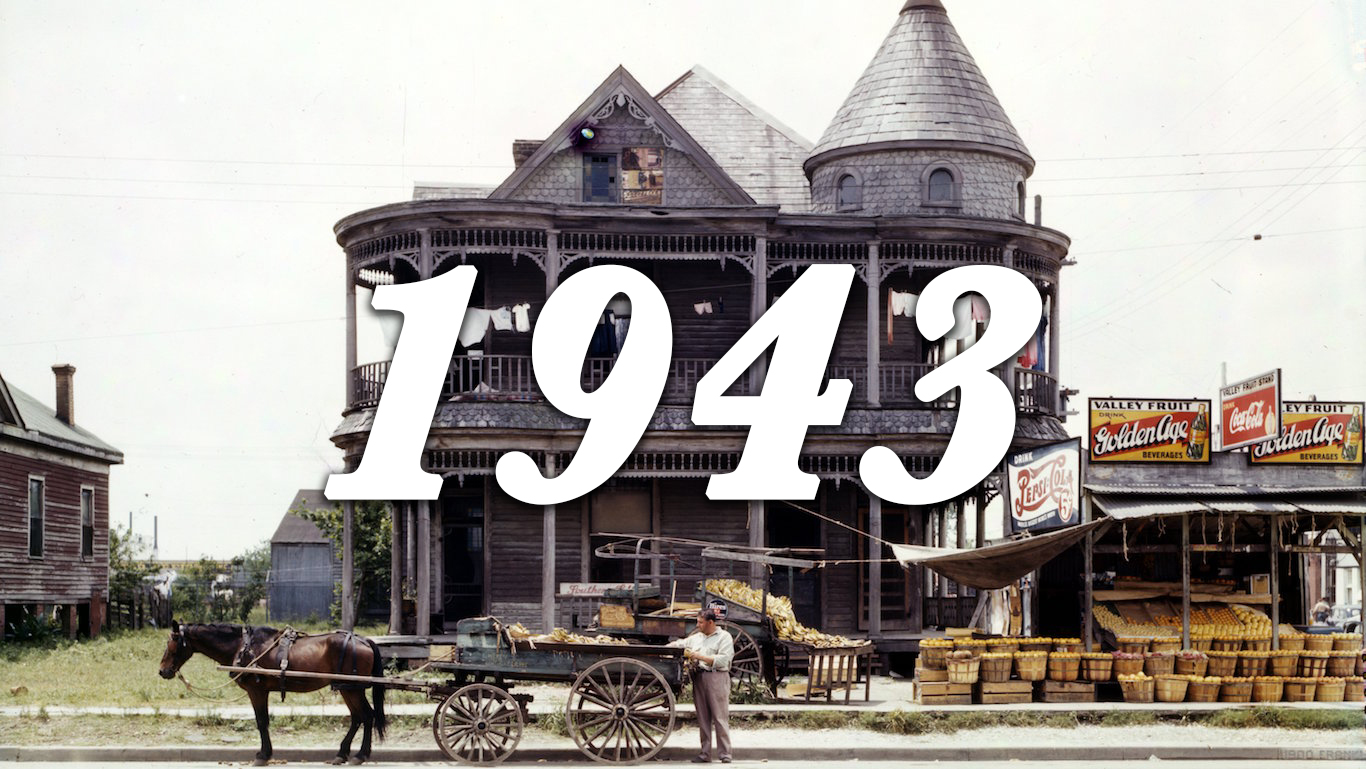
> Avg. floor area of a new single-family home: 777 sq ft
> Avg. floor area per person: 179 sq ft
> New homes started: 893,000
> GDP per capita: $11,409
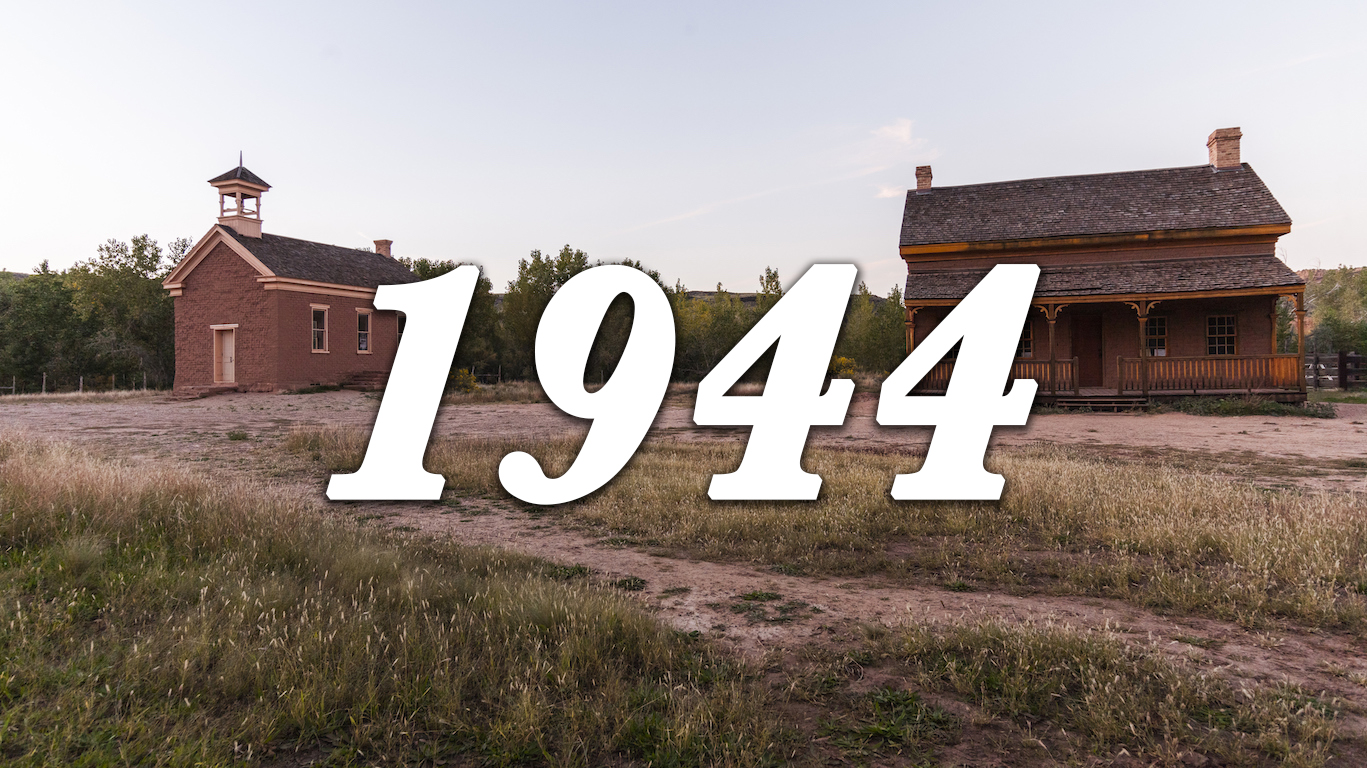
> Avg. floor area of a new single-family home: 967 sq ft
> Avg. floor area per person: 223 sq ft
> New homes started: 937,000
> GDP per capita: $11,500
> Avg. floor area of a new single-family home: 994 sq ft
> Avg. floor area per person: 229 sq ft
> New homes started: 849,000
> GDP per capita: $12,086
[nativounit]
> Avg. floor area of a new single-family home: 989 sq ft
> Avg. floor area per person: 228 sq ft
> New homes started: 810,000
> GDP per capita: $12,038
> Avg. floor area of a new single-family home: 1,222 sq ft
> Avg. floor area per person: 282 sq ft
> New homes started: 753,000
> GDP per capita: $12,025
[wallst_email_signup]
> Avg. floor area of a new single-family home: 1,233 sq ft
> Avg. floor area per person: 284 sq ft
> New homes started: 509,000
> GDP per capita: $9,668
> Avg. floor area of a new single-family home: 1,129 sq ft
> Avg. floor area per person: 275 sq ft
> New homes started: 330,000
> GDP per capita: $8,751

> Avg. floor area of a new single-family home: 1,213 sq ft
> Avg. floor area per person: 295 sq ft
> New homes started: 254,000
> GDP per capita: $8,128
[recirclink id=333029]

> Avg. floor area of a new single-family home: 889 sq ft
> Avg. floor area per person: 216 sq ft
> New homes started: 134,000
> GDP per capita: $7,035
> Avg. floor area of a new single-family home: 1,267 sq ft
> Avg. floor area per person: 308 sq ft
> New homes started: 93,000
> GDP per capita: $6,906
[nativounit]
> Avg. floor area of a new single-family home: 826 sq ft
> Avg. floor area per person: 201 sq ft
> New homes started: 126,000
> GDP per capita: $7,603
> Avg. floor area of a new single-family home: 992 sq ft
> Avg. floor area per person: 241 sq ft
> New homes started: 221,000
> GDP per capita: $8,223
> Avg. floor area of a new single-family home: 1,129 sq ft
> Avg. floor area per person: 275 sq ft
> New homes started: 319,000
> GDP per capita: $9,226
[wallst_email_signup]
> Avg. floor area of a new single-family home: 1,135 sq ft
> Avg. floor area per person: 276 sq ft
> New homes started: 336,000
> GDP per capita: $9,639
> Avg. floor area of a new single-family home: 959 sq ft
> Avg. floor area per person: 233 sq ft
> New homes started: 406,000
> GDP per capita: $9,248
[nativounit]
> Avg. floor area of a new single-family home: 1,046 sq ft
> Avg. floor area per person: 254 sq ft
> New homes started: 515,000
> GDP per capita: $9,904
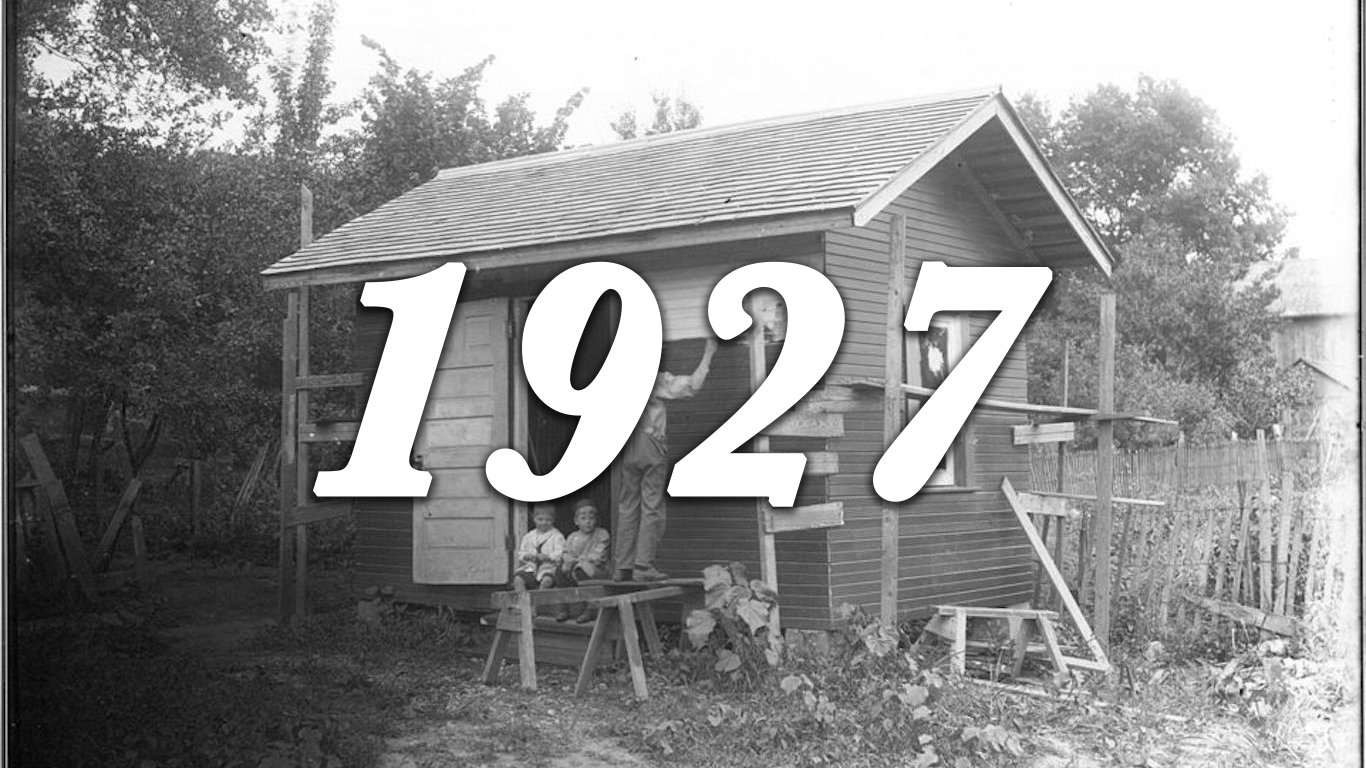
> Avg. floor area of a new single-family home: 1,177 sq ft
> Avg. floor area per person: 321 sq ft
> New homes started: 603,000
> GDP per capita: $10,687

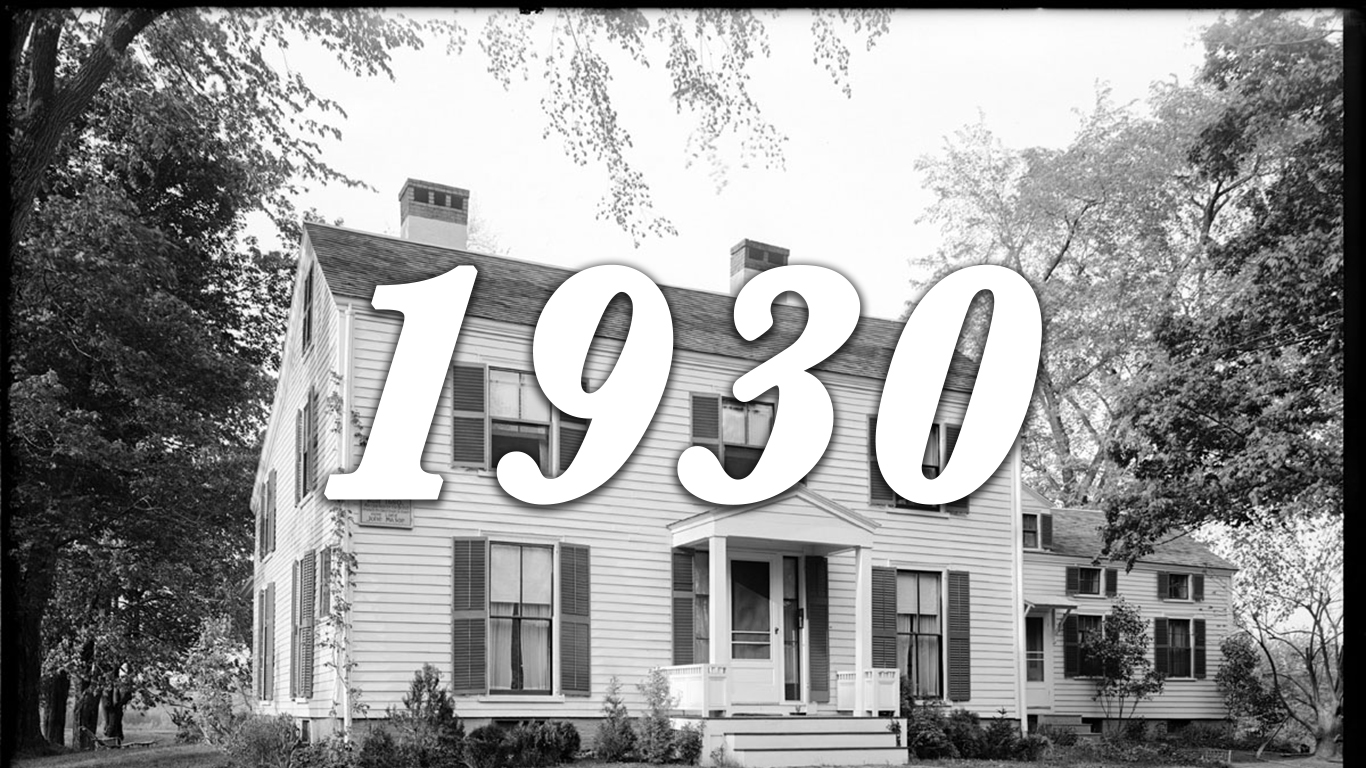
> Avg. floor area of a new single-family home: 1,153 sq ft
> Avg. floor area per person: 314 sq ft
> New homes started: 706,000
> GDP per capita: $12,458
[nativounit]
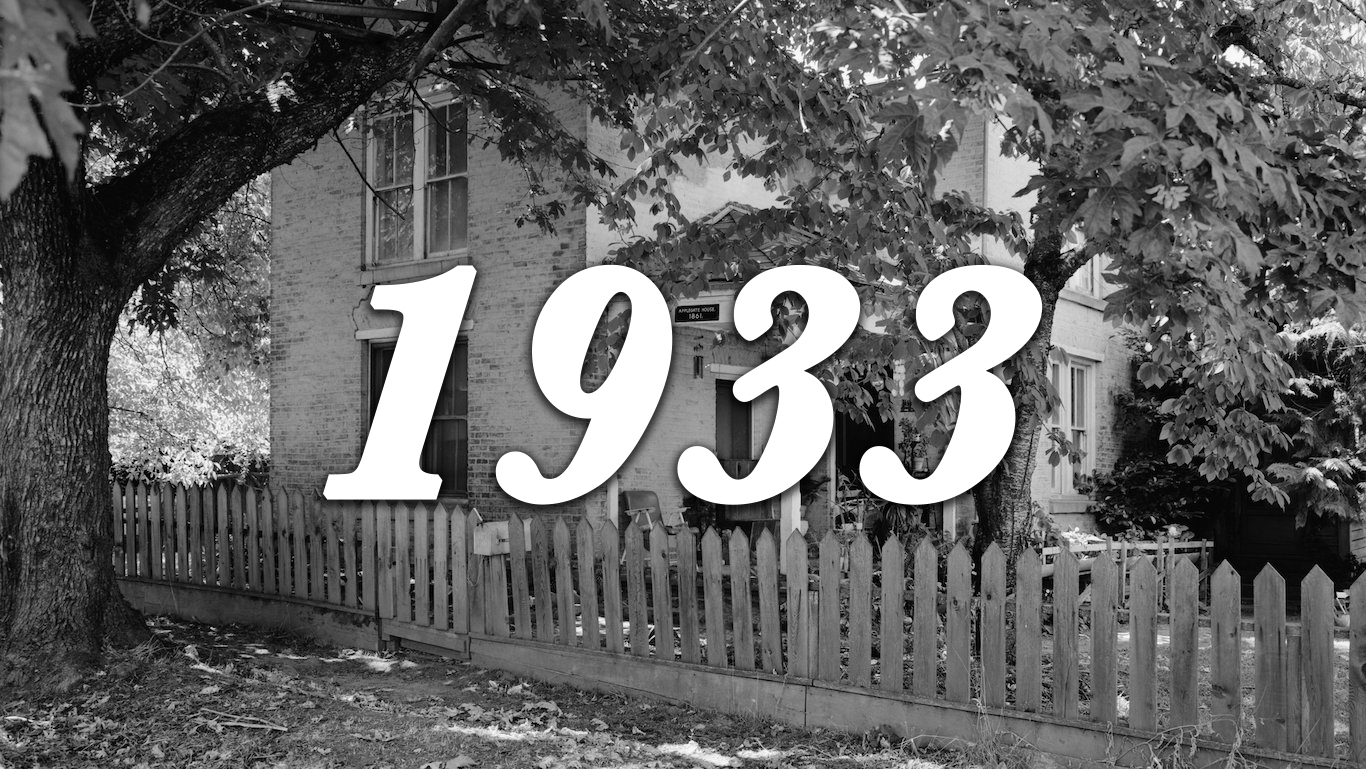
> Avg. floor area of a new single-family home: 2,044 sq ft
> Avg. floor area per person: 557 sq ft
> New homes started: 356,000
> GDP per capita: $14,652
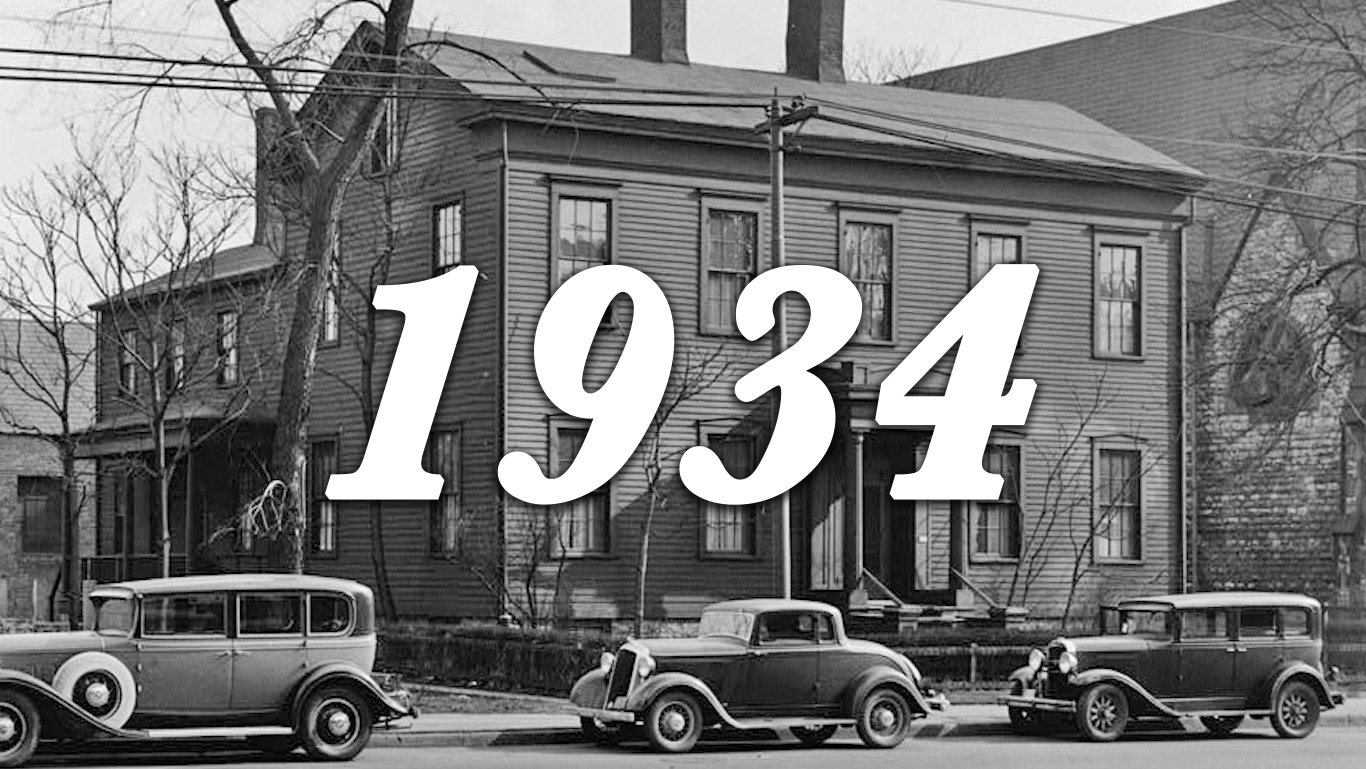
> Avg. floor area of a new single-family home: 1,692 sq ft
> Avg. floor area per person: 461 sq ft
> New homes started: 191,000
> GDP per capita: $16,914
[recirclink id=333601]
> Avg. floor area of a new single-family home: 837 sq ft
> Avg. floor area per person: 228 sq ft
> New homes started: 142,000
> GDP per capita: $18,046
> Avg. floor area of a new single-family home: 797 sq ft
> Avg. floor area per person: 217 sq ft
> New homes started: 326,000
> GDP per capita: $17,677

> Avg. floor area of a new single-family home: 817 sq ft
> Avg. floor area per person: 223 sq ft
> New homes started: 1.02 million
> GDP per capita: $15,467
[nativounit]
> Avg. floor area of a new single-family home: 903 sq ft
> Avg. floor area per person: 254 sq ft
> New homes started: 1.27 million
> GDP per capita: $15,008
> Avg. floor area of a new single-family home: 800 sq ft
> Avg. floor area per person: 229 sq ft
> New homes started: 1.36 million
> GDP per capita: $15,364
[wallst_email_signup]
> Avg. floor area of a new single-family home: 767 sq ft
> Avg. floor area per person: 224 sq ft
> New homes started: 1.47 million
> GDP per capita: $15,018
> Avg. floor area of a new single-family home: 983 sq ft
> Avg. floor area per person: 292 sq ft
> New homes started: 1.95 million
> GDP per capita: $16,057
> Avg. floor area of a new single-family home: 874 sq ft
> Avg. floor area per person: 262 sq ft
> New homes started: 1.49 million
> GDP per capita: $17,059
[nativounit]
> Avg. floor area of a new single-family home: 910 sq ft
> Avg. floor area per person: 274 sq ft
> New homes started: 1.50 million
> GDP per capita: $17,452
> Avg. floor area of a new single-family home: 917 sq ft
> Avg. floor area per person: 279 sq ft
> New homes started: 1.44 million
> GDP per capita: $17,972
[recirclink id=332982]
> Avg. floor area of a new single-family home: 1,140 sq ft
> Avg. floor area per person: 341 sq ft
> New homes started: 1.55 million
> GDP per capita: $17,560
> Avg. floor area of a new single-family home: 1,170 sq ft
> Avg. floor area per person: 351 sq ft
> New homes started: 1.65 million
> GDP per capita: $18,483
> Avg. floor area of a new single-family home: 1,230 sq ft
> Avg. floor area per person: 370 sq ft
> New homes started: 1.35 million
> GDP per capita: $18,547
[wallst_email_signup]
> Avg. floor area of a new single-family home: 1,305 sq ft
> Avg. floor area per person: 392 sq ft
> New homes started: 1.22 million
> GDP per capita: $18,599
> Avg. floor area of a new single-family home: 1,289 sq ft
> Avg. floor area per person: 386 sq ft
> New homes started: 1.38 million
> GDP per capita: $18,158
[nativounit]
> Avg. floor area of a new single-family home: 1,300 sq ft
> Avg. floor area per person: 389 sq ft
> New homes started: 1.55 million
> GDP per capita: $19,084
> Avg. floor area of a new single-family home: 1,289 sq ft
> Avg. floor area per person: 387 sq ft
> New homes started: 1.30 million
> GDP per capita: $19,180
> Avg. floor area of a new single-family home: 1,284 sq ft
> Avg. floor area per person: 382 sq ft
> New homes started: 1.37 million
> GDP per capita: $19,351
[recirclink id=332714]
> Avg. floor area of a new single-family home: 1,309 sq ft
> Avg. floor area per person: 396 sq ft
> New homes started: 1.49 million
> GDP per capita: $20,220
> Avg. floor area of a new single-family home: 1,450 sq ft
> Avg. floor area per person: 435 sq ft
> New homes started: 1.64 million
> GDP per capita: $20,799
[nativounit]
> Avg. floor area of a new single-family home: 1,470 sq ft
> Avg. floor area per person: 441 sq ft
> New homes started: 1.56 million
> GDP per capita: $21,698
> Avg. floor area of a new single-family home: 1,525 sq ft
> Avg. floor area per person: 461 sq ft
> New homes started: 1.51 million
> GDP per capita: $22,820

> Avg. floor area of a new single-family home: 1,570 sq ft
> Avg. floor area per person: 476 sq ft
> New homes started: 1.20 million
> GDP per capita: $24,046
[nativounit]
> Avg. floor area of a new single-family home: 1,610 sq ft
> Avg. floor area per person: 491 sq ft
> New homes started: 1.32 million
> GDP per capita: $24,438
> Avg. floor area of a new single-family home: 1,665 sq ft
> Avg. floor area per person: 515 sq ft
> New homes started: 1.55 million
> GDP per capita: $25,383
[wallst_email_signup]

> Avg. floor area of a new single-family home: 1,640 sq ft
> Avg. floor area per person: 514 sq ft
> New homes started: 1.50 million
> GDP per capita: $25,923
> Avg. floor area of a new single-family home: 1,500 sq ft
> Avg. floor area per person: 478 sq ft
> New homes started: 1.47 million
> GDP per capita: $25,677
> Avg. floor area of a new single-family home: 1,520 sq ft
> Avg. floor area per person: 489 sq ft
> New homes started: 2.05 million
> GDP per capita: $26,192
[nativounit]
> Avg. floor area of a new single-family home: 1,555 sq ft
> Avg. floor area per person: 508 sq ft
> New homes started: 2.36 million
> GDP per capita: $27,277
> Avg. floor area of a new single-family home: 1,660 sq ft
> Avg. floor area per person: 551 sq ft
> New homes started: 2.05 million
> GDP per capita: $28,542
[recirclink id=332343]
> Avg. floor area of a new single-family home: 1,695 sq ft
> Avg. floor area per person: 571 sq ft
> New homes started: 1.34 million
> GDP per capita: $28,134
> Avg. floor area of a new single-family home: 1,645 sq ft
> Avg. floor area per person: 560 sq ft
> New homes started: 1.16 million
> GDP per capita: $27,807
> Avg. floor area of a new single-family home: 1,700 sq ft
> Avg. floor area per person: 588 sq ft
> New homes started: 1.54 million
> GDP per capita: $29,023
[wallst_email_signup]
> Avg. floor area of a new single-family home: 1,720 sq ft
> Avg. floor area per person: 601 sq ft
> New homes started: 1.99 million
> GDP per capita: $30,057
> Avg. floor area of a new single-family home: 1,755 sq ft
> Avg. floor area per person: 625 sq ft
> New homes started: 2.02 million
> GDP per capita: $31,395
[nativounit]
> Avg. floor area of a new single-family home: 1,760 sq ft
> Avg. floor area per person: 633 sq ft
> New homes started: 1.75 million
> GDP per capita: $32,035
> Avg. floor area of a new single-family home: 1,740 sq ft
> Avg. floor area per person: 630 sq ft
> New homes started: 1.29 million
> GDP per capita: $31,589
> Avg. floor area of a new single-family home: 1,720 sq ft
> Avg. floor area per person: 630 sq ft
> New homes started: 1.08 million
> GDP per capita: $32,088
[recirclink id=332391]
> Avg. floor area of a new single-family home: 1,710 sq ft
> Avg. floor area per person: 629 sq ft
> New homes started: 1.06 million
> GDP per capita: $31,174
> Avg. floor area of a new single-family home: 1,725 sq ft
> Avg. floor area per person: 632 sq ft
> New homes started: 1.70 million
> GDP per capita: $32,324
[nativounit]
> Avg. floor area of a new single-family home: 1,780 sq ft
> Avg. floor area per person: 657 sq ft
> New homes started: 1.75 million
> GDP per capita: $34,368
> Avg. floor area of a new single-family home: 1,785 sq ft
> Avg. floor area per person: 664 sq ft
> New homes started: 1.74 million
> GDP per capita: $35,508
> Avg. floor area of a new single-family home: 1,825 sq ft
> Avg. floor area per person: 684 sq ft
> New homes started: 1.81 million
> GDP per capita: $36,423
[nativounit]
> Avg. floor area of a new single-family home: 1,905 sq ft
> Avg. floor area per person: 716 sq ft
> New homes started: 1.62 million
> GDP per capita: $37,348
> Avg. floor area of a new single-family home: 1,995 sq ft
> Avg. floor area per person: 756 sq ft
> New homes started: 1.49 million
> GDP per capita: $38,566
[wallst_email_signup]
> Avg. floor area of a new single-family home: 2,035 sq ft
> Avg. floor area per person: 777 sq ft
> New homes started: 1.38 million
> GDP per capita: $39,610
> Avg. floor area of a new single-family home: 2,080 sq ft
> Avg. floor area per person: 791 sq ft
> New homes started: 1.19 million
> GDP per capita: $39,919
> Avg. floor area of a new single-family home: 2,075 sq ft
> Avg. floor area per person: 789 sq ft
> New homes started: 1.01 million
> GDP per capita: $39,363
[nativounit]
> Avg. floor area of a new single-family home: 2,095 sq ft
> Avg. floor area per person: 800 sq ft
> New homes started: 1.20 million
> GDP per capita: $40,225
> Avg. floor area of a new single-family home: 2,095 sq ft
> Avg. floor area per person: 788 sq ft
> New homes started: 1.29 million
> GDP per capita: $40,796
[recirclink id=332010]
> Avg. floor area of a new single-family home: 2,100 sq ft
> Avg. floor area per person: 787 sq ft
> New homes started: 1.46 million
> GDP per capita: $41,931
> Avg. floor area of a new single-family home: 2,095 sq ft
> Avg. floor area per person: 791 sq ft
> New homes started: 1.35 million
> GDP per capita: $42,566
> Avg. floor area of a new single-family home: 2,120 sq ft
> Avg. floor area per person: 800 sq ft
> New homes started: 1.48 million
> GDP per capita: $43,668
[wallst_email_signup]
> Avg. floor area of a new single-family home: 2,150 sq ft
> Avg. floor area per person: 814 sq ft
> New homes started: 1.47 million
> GDP per capita: $45,086
> Avg. floor area of a new single-family home: 2,190 sq ft
> Avg. floor area per person: 836 sq ft
> New homes started: 1.62 million
> GDP per capita: $46,547
[nativounit]
> Avg. floor area of a new single-family home: 2,223 sq ft
> Avg. floor area per person: 852 sq ft
> New homes started: 1.64 million
> GDP per capita: $48,174
> Avg. floor area of a new single-family home: 2,266 sq ft
> Avg. floor area per person: 865 sq ft
> New homes started: 1.57 million
> GDP per capita: $49,600
2001
> Avg. floor area of a new single-family home: 2,324 sq ft
> Avg. floor area per person: 901 sq ft
> New homes started: 1.60 million
> GDP per capita: $49,588
[recirclink id=331922]
> Avg. floor area of a new single-family home: 2,320 sq ft
> Avg. floor area per person: 899 sq ft
> New homes started: 1.70 million
> GDP per capita: $49,995
> Avg. floor area of a new single-family home: 2,330 sq ft
> Avg. floor area per person: 907 sq ft
> New homes started: 1.85 million
> GDP per capita: $50,927
[nativounit]
> Avg. floor area of a new single-family home: 2,349 sq ft
> Avg. floor area per person: 914 sq ft
> New homes started: 1.96 million
> GDP per capita: $52,380
> Avg. floor area of a new single-family home: 2,434 sq ft
> Avg. floor area per person: 947 sq ft
> New homes started: 2.07 million
> GDP per capita: $53,632
> Avg. floor area of a new single-family home: 2,469 sq ft
> Avg. floor area per person: 961 sq ft
> New homes started: 1.80 million
> GDP per capita: $54,541
[nativounit]
> Avg. floor area of a new single-family home: 2,521 sq ft
> Avg. floor area per person: 985 sq ft
> New homes started: 1.35 million
> GDP per capita: $54,982
> Avg. floor area of a new single-family home: 2,519 sq ft
> Avg. floor area per person: 984 sq ft
> New homes started: 905,500
> GDP per capita: $54,309
[wallst_email_signup]
> Avg. floor area of a new single-family home: 2,438 sq ft
> Avg. floor area per person: 949 sq ft
> New homes started: 554,000
> GDP per capita: $52,338
> Avg. floor area of a new single-family home: 2,392 sq ft
> Avg. floor area per person: 924 sq ft
> New homes started: 586,900
> GDP per capita: $53,218
> Avg. floor area of a new single-family home: 2,480 sq ft
> Avg. floor area per person: 969 sq ft
> New homes started: 608,800
> GDP per capita: $53,662
[nativounit]
> Avg. floor area of a new single-family home: 2,505 sq ft
> Avg. floor area per person: 982 sq ft
> New homes started: 780,600
> GDP per capita: $54,451
> Avg. floor area of a new single-family home: 2,598 sq ft
> Avg. floor area per person: 1,023 sq ft
> New homes started: 924,900
> GDP per capita: $54,859
[recirclink id=331805]
> Avg. floor area of a new single-family home: 2,657 sq ft
> Avg. floor area per person: 1,046 sq ft
> New homes started: 1.0 million
> GDP per capita: $55,762
Contact [email protected] for any questions or corrections.