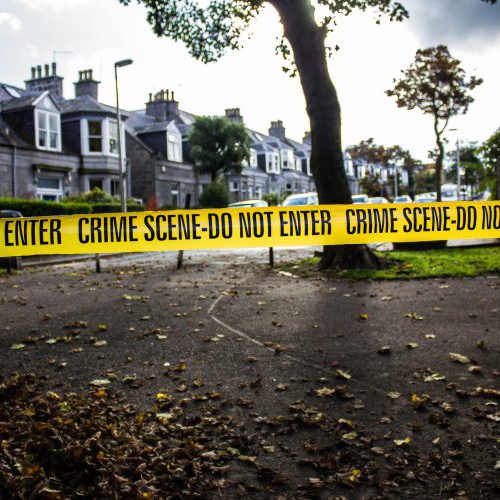
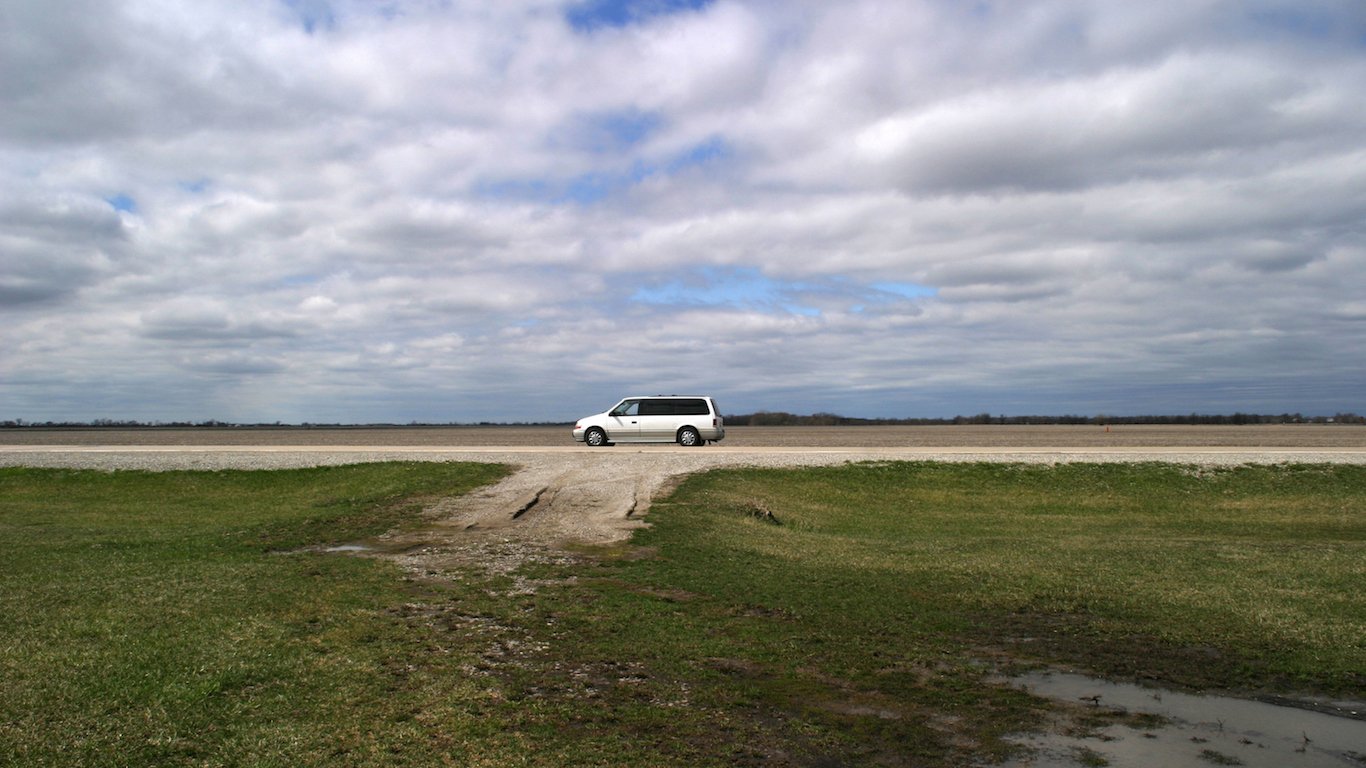
[cnxvideo id=”655420″ placement=”ros”]Police chases, as exciting as they are in movies, can result in accidents — sometimes fatal ones. The victims can be the perpetrator, an officer, or innocents. According to a report released May 9 by the U.S. Department of Justice, the 68,000 vehicle pursuits by state and local law enforcement agencies conducted in 2012 resulted in 351 fatalities.
The death rate in 2012 from such pursuits is in line with the historical average. The DOJ recorded more than 7,000 fatalities over the 20 years of data reviewed, an average of 355 deaths per year, or just about one death per day. The number of fatalities peaked at more than 400 annual fatalities in 2006 and 2007.
Police chases appear more dangerous in some states than in others. Police pursuits are the most deadly in Alabama, where the police chase-related fatality rate of 5.3 deaths per 100,000 people is highest of all states. In Hawaii, there has only been five deaths related to police chases in the last 20 years, or 0.4 per 100,000 people annually, each the lowest such figure nationwide.
Click here to see the states where you are most likely to die in a police chase.
Click here to read the methodology.
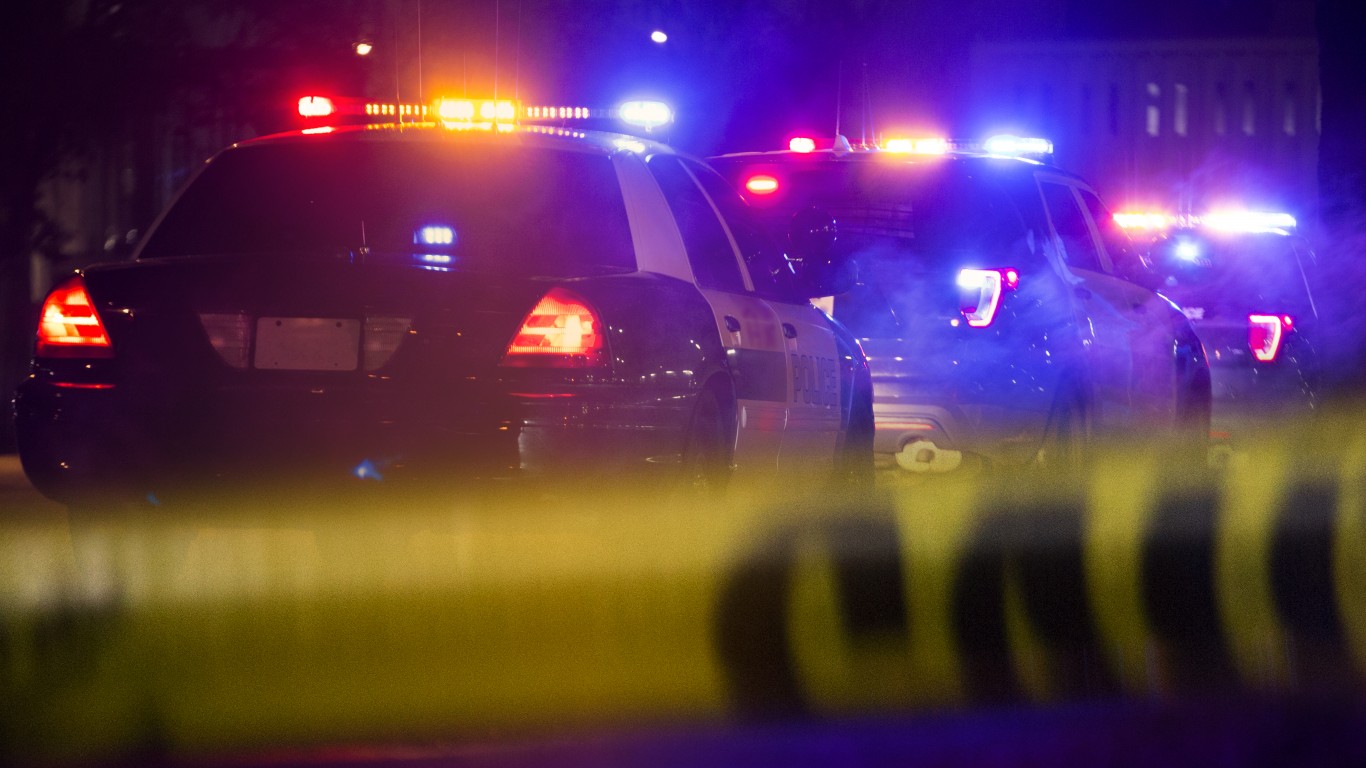
Most agencies have adopted vehicle pursuit policies. In such cases, specific criteria like speed, type of offense, and surrounding conditions help officers determine when a pursuit is permissible. Such policies, as well as their content, significantly affect the likelihood of fatal accidents.
All state police and highway patrol agencies and 97% of local police departments have a written pursuit policy.
Police chases are relatively more common in smaller police departments serving fewer than 10,000 residents. In these jurisdictions, 4% of local police departments and 10% of sheriff’s offices do not have a written policy.
In general, the rate of vehicle pursuits — and the likelihood of fatal accidents — is highest in departments that leave pursuit decisions to officer discretion.
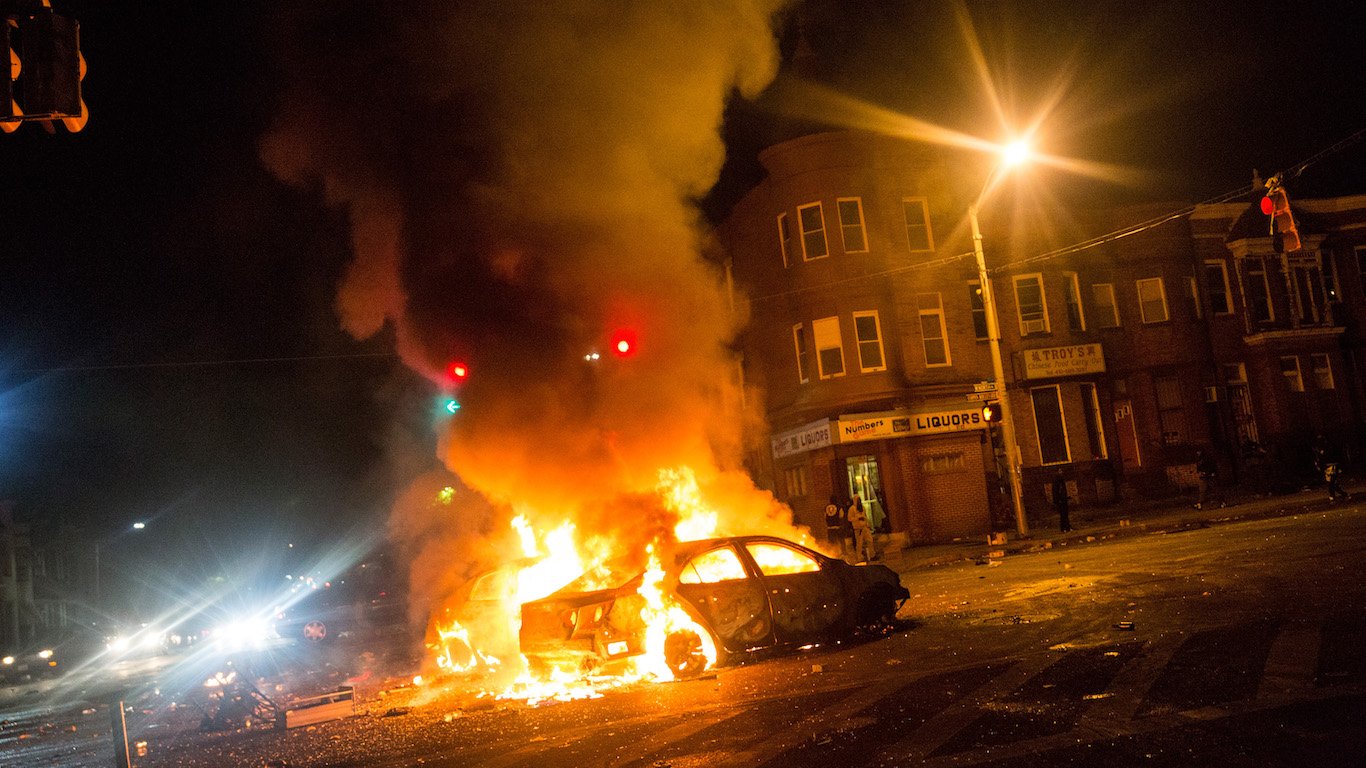
The DOJ does not report the justifications for each pursuit. However, violent crime levels tend to be higher in states with more fatal police chases. In 16 of the 25 states with the highest rates of pursuit-related fatalities the violent crime rates exceed the national rate of 372.6 incidents per 100,000 people.
Victims of fatal pursuit-related vehicle accidents include police officers, occupants of the chased vehicle, occupants of other vehicles, and pedestrians. Occupants of the vehicles being pursued are the most likely to die in police chases. One-third of deaths in fatal police chase accidents are innocent bystanders not related to the pursuit.
These are the states with the deadliest police chases.
50. Hawaii
> Pursuit-related deaths per 100K: 0.4
> Pursuit-related deaths (1996-2015): 5 (the lowest)
> Violent crimes per 100K (2015): 293.4 (20th lowest)
> Bystander deaths (1996-2015): 1 (the lowest)
[in-text-ad]

49. New York
> Pursuit-related deaths per 100K: 0.5
> Pursuit-related deaths (1996-2015): 94 (25th highest)
> Violent crimes per 100K (2015): 379.7 (23rd highest)
> Bystander deaths (1996-2015): 47 (18th highest)
[recirclink id=387609]
48. Iowa
> Pursuit-related deaths per 100K: 1.3
> Pursuit-related deaths (1996-2015): 39 (tied-14th lowest)
> Violent crimes per 100K (2015): 286.1 (18th lowest)
> Bystander deaths (1996-2015): 3 (2nd lowest)
47. Mississippi
> Pursuit-related deaths per 100K: 1.3
> Pursuit-related deaths (1996-2015): 39 (tied-14th lowest)
> Violent crimes per 100K (2015): 275.8 (16th lowest)
> Bystander deaths (1996-2015): 7 (tied-6th lowest)
[in-text-ad-2]
46. New Jersey
> Pursuit-related deaths per 100K: 1.3
> Pursuit-related deaths (1996-2015): 113 (21st highest)
> Violent crimes per 100K (2015): 255.4 (13th lowest)
> Bystander deaths (1996-2015): 60 (14th highest)
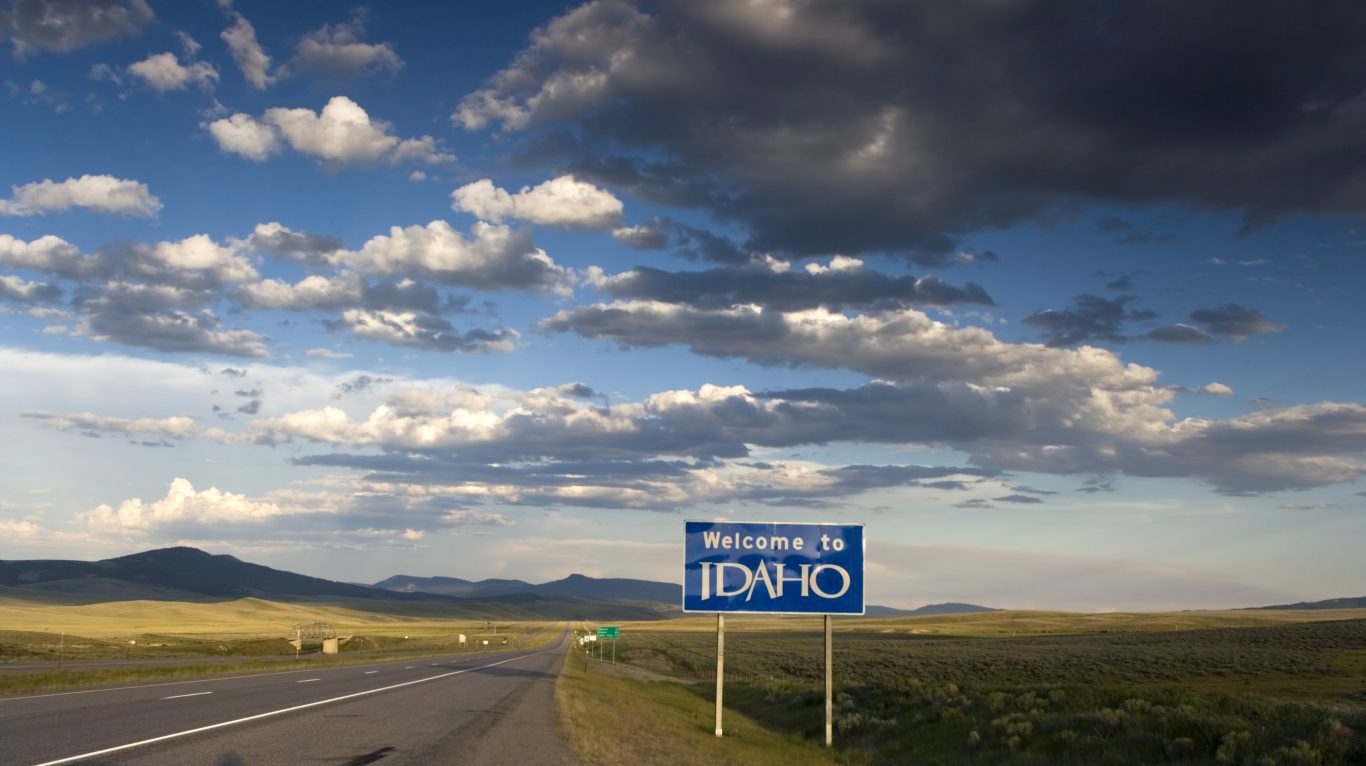
45. Idaho
> Pursuit-related deaths per 100K: 1.4
> Pursuit-related deaths (1996-2015): 20 (4th lowest)
> Violent crimes per 100K (2015): 215.6 (5th lowest)
> Bystander deaths (1996-2015): 6 (5th lowest)
[in-text-ad]

44. Maryland
> Pursuit-related deaths per 100K: 1.4
> Pursuit-related deaths (1996-2015): 81 (23rd lowest)
> Violent crimes per 100K (2015): 457.2 (12th highest)
> Bystander deaths (1996-2015): 34 (23rd highest)
[recirclink id=391571]

43. Minnesota
> Pursuit-related deaths per 100K: 1.4
> Pursuit-related deaths (1996-2015): 72 (20th lowest)
> Violent crimes per 100K (2015): 242.6 (12th lowest)
> Bystander deaths (1996-2015): 28 (24th lowest)
42. Nebraska
> Pursuit-related deaths per 100K: 1.6
> Pursuit-related deaths (1996-2015): 29 (9th lowest)
> Violent crimes per 100K (2015): 274.9 (15th lowest)
> Bystander deaths (1996-2015): 7 (tied-6th lowest)
[in-text-ad-2]
41. Utah
> Pursuit-related deaths per 100K: 1.6
> Pursuit-related deaths (1996-2015): 39 (tied-14th lowest)
> Violent crimes per 100K (2015): 236.0 (9th lowest)
> Bystander deaths (1996-2015): 16 (18th lowest)
40. Washington
> Pursuit-related deaths per 100K: 1.6
> Pursuit-related deaths (1996-2015): 102 (22nd highest)
> Violent crimes per 100K (2015): 284.4 (17th lowest)
> Bystander deaths (1996-2015): 25 (tied-22nd lowest)
[in-text-ad]

39. Connecticut
> Pursuit-related deaths per 100K: 1.7
> Pursuit-related deaths (1996-2015): 58 (19th lowest)
> Violent crimes per 100K (2015): 218.5 (6th lowest)
> Bystander deaths (1996-2015): 23 (tied-19th lowest)
[recirclink id=387256]
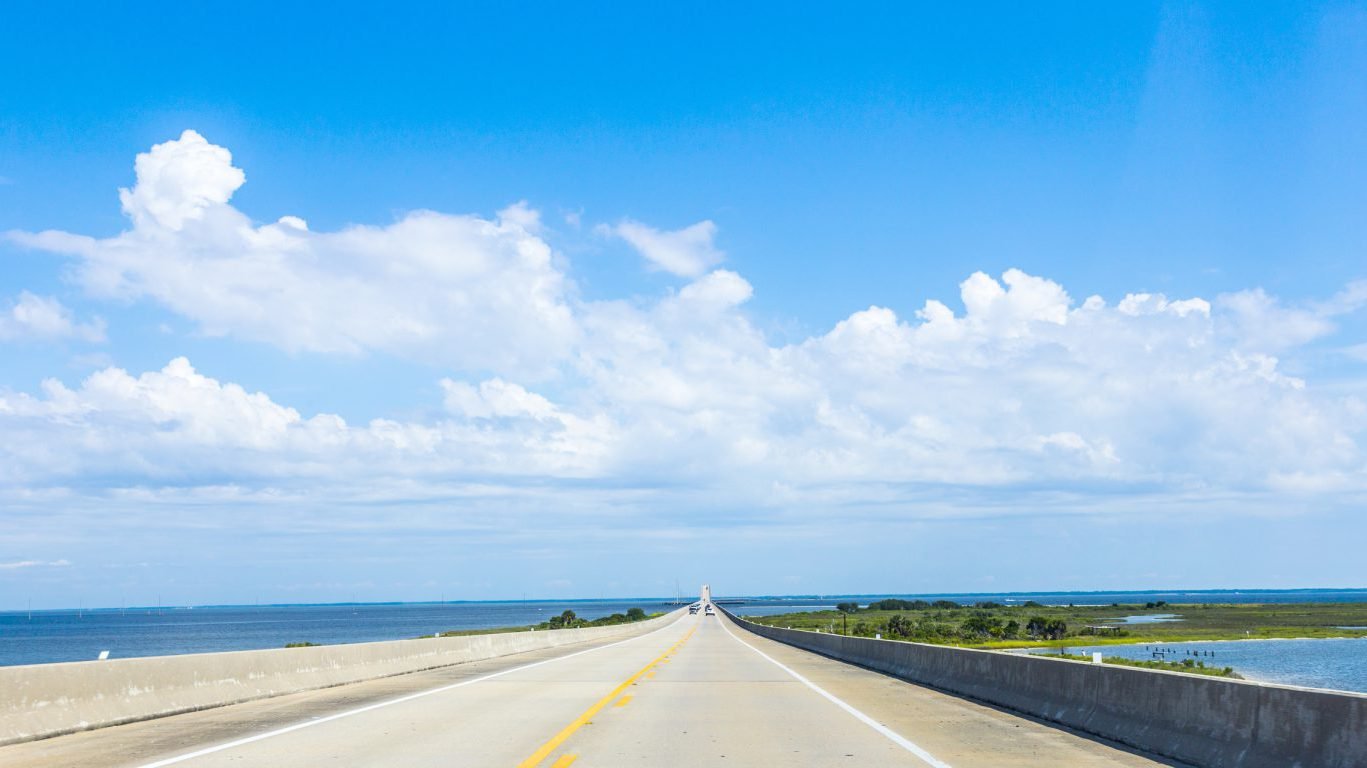
38. Florida
> Pursuit-related deaths per 100K: 1.7
> Pursuit-related deaths (1996-2015): 311 (4th highest)
> Violent crimes per 100K (2015): 461.9 (11th highest)
> Bystander deaths (1996-2015): 113 (5th highest)

37. Massachusetts
> Pursuit-related deaths per 100K: 1.8
> Pursuit-related deaths (1996-2015): 114 (tied-19th highest)
> Violent crimes per 100K (2015): 390.9 (18th highest)
> Bystander deaths (1996-2015): 44 (20th highest)
[in-text-ad-2]
36. Wisconsin
> Pursuit-related deaths per 100K: 1.8
> Pursuit-related deaths (1996-2015): 100 (23rd highest)
> Violent crimes per 100K (2015): 305.8 (21st lowest)
> Bystander deaths (1996-2015): 30 (tied-24th highest)

35. Illinois
> Pursuit-related deaths per 100K: 1.9
> Pursuit-related deaths (1996-2015): 244 (8th highest)
> Violent crimes per 100K (2015): 383.8 (21st highest)
> Bystander deaths (1996-2015): 98 (7th highest)
[in-text-ad]
34. Kentucky
> Pursuit-related deaths per 100K: 1.9
> Pursuit-related deaths (1996-2015): 80 (tied-21st lowest)
> Violent crimes per 100K (2015): 218.7 (7th lowest)
> Bystander deaths (1996-2015): 23 (tied-19th lowest)
[recirclink id=391571]
33. North Dakota
> Pursuit-related deaths per 100K: 1.9
> Pursuit-related deaths (1996-2015): 12 (2nd lowest)
> Violent crimes per 100K (2015): 239.4 (10th lowest)
> Bystander deaths (1996-2015): 5 (4th lowest)

32. Ohio
> Pursuit-related deaths per 100K: 2.0
> Pursuit-related deaths (1996-2015): 231 (11th highest)
> Violent crimes per 100K (2015): 291.9 (19th lowest)
> Bystander deaths (1996-2015): 130 (3rd highest)
[in-text-ad-2]

31. Pennsylvania
> Pursuit-related deaths per 100K: 2.1
> Pursuit-related deaths (1996-2015): 267 (7th highest)
> Violent crimes per 100K (2015): 315.1 (22nd lowest)
> Bystander deaths (1996-2015): 69 (12th highest)
30. Alaska
> Pursuit-related deaths per 100K: 2.2
> Pursuit-related deaths (1996-2015): 15 (3rd lowest)
> Violent crimes per 100K (2015): 730.2 (the highest)
> Bystander deaths (1996-2015): 7 (tied-6th lowest)
[in-text-ad]
29. California
> Pursuit-related deaths per 100K: 2.3
> Pursuit-related deaths (1996-2015): 827 (the highest)
> Violent crimes per 100K (2015): 426.3 (13th highest)
> Bystander deaths (1996-2015): 299 (the highest)
[recirclink id=387044]

28. Nevada
> Pursuit-related deaths per 100K: 2.3
> Pursuit-related deaths (1996-2015): 55 (18th lowest)
> Violent crimes per 100K (2015): 695.9 (2nd highest)
> Bystander deaths (1996-2015): 25 (tied-22nd lowest)

27. Virginia
> Pursuit-related deaths per 100K: 2.3
> Pursuit-related deaths (1996-2015): 178 (16th highest)
> Violent crimes per 100K (2015): 195.6 (3rd lowest)
> Bystander deaths (1996-2015): 62 (13th highest)
[in-text-ad-2]
26. West Virginia
> Pursuit-related deaths per 100K: 2.4
> Pursuit-related deaths (1996-2015): 43 (17th lowest)
> Violent crimes per 100K (2015): 337.9 (24th lowest)
> Bystander deaths (1996-2015): 15 (17th lowest)
25. Colorado
> Pursuit-related deaths per 100K: 2.5
> Pursuit-related deaths (1996-2015): 114 (tied-19th highest)
> Violent crimes per 100K (2015): 321.0 (23rd lowest)
> Bystander deaths (1996-2015): 30 (tied-24th highest)
[in-text-ad]
24. Oregon
> Pursuit-related deaths per 100K: 2.5
> Pursuit-related deaths (1996-2015): 90 (25th lowest)
> Violent crimes per 100K (2015): 259.8 (14th lowest)
> Bystander deaths (1996-2015): 30 (tied-24th highest)
[recirclink id=391571]
23. Rhode Island
> Pursuit-related deaths per 100K: 2.5
> Pursuit-related deaths (1996-2015): 27 (8th lowest)
> Violent crimes per 100K (2015): 242.5 (11th lowest)
> Bystander deaths (1996-2015): 8 (12th lowest)
22. Delaware
> Pursuit-related deaths per 100K: 2.6
> Pursuit-related deaths (1996-2015): 22 (5th lowest)
> Violent crimes per 100K (2015): 499.0 (8th highest)
> Bystander deaths (1996-2015): 7 (tied-6th lowest)
[in-text-ad-2]
21. Maine
> Pursuit-related deaths per 100K: 2.7
> Pursuit-related deaths (1996-2015): 36 (tied-12th lowest)
> Violent crimes per 100K (2015): 130.1 (2nd lowest)
> Bystander deaths (1996-2015): 11 (tied-14th lowest)
20. New Hampshire
> Pursuit-related deaths per 100K: 2.8
> Pursuit-related deaths (1996-2015): 36 (tied-12th lowest)
> Violent crimes per 100K (2015): 199.3 (4th lowest)
> Bystander deaths (1996-2015): 7 (tied-6th lowest)
[in-text-ad]
19. North Carolina
> Pursuit-related deaths per 100K: 2.8
> Pursuit-related deaths (1996-2015): 240 (10th highest)
> Violent crimes per 100K (2015): 347.0 (25th lowest)
> Bystander deaths (1996-2015): 93 (8th highest)
[recirclink id=386791]

18. Louisiana
> Pursuit-related deaths per 100K: 2.9
> Pursuit-related deaths (1996-2015): 132 (17th highest)
> Violent crimes per 100K (2015): 539.7 (5th highest)
> Bystander deaths (1996-2015): 51 (17th highest)

17. Kansas
> Pursuit-related deaths per 100K: 3.0
> Pursuit-related deaths (1996-2015): 83 (24th lowest)
> Violent crimes per 100K (2015): 389.9 (19th highest)
> Bystander deaths (1996-2015): 42 (21st highest)
[in-text-ad-2]
16. Michigan
> Pursuit-related deaths per 100K: 3.0
> Pursuit-related deaths (1996-2015): 300 (5th highest)
> Violent crimes per 100K (2015): 415.5 (15th highest)
> Bystander deaths (1996-2015): 114 (4th highest)
15. Tennessee
> Pursuit-related deaths per 100K: 3.0
> Pursuit-related deaths (1996-2015): 182 (14th highest)
> Violent crimes per 100K (2015): 612.1 (4th highest)
> Bystander deaths (1996-2015): 46 (19th highest)
[in-text-ad]
14. Indiana
> Pursuit-related deaths per 100K: 3.1
> Pursuit-related deaths (1996-2015): 192 (13th highest)
> Violent crimes per 100K (2015): 387.5 (20th highest)
> Bystander deaths (1996-2015): 56 (15th highest)
[recirclink id=391571]

13. Texas
> Pursuit-related deaths per 100K: 3.3
> Pursuit-related deaths (1996-2015): 762 (2nd highest)
> Violent crimes per 100K (2015): 412.2 (16th highest)
> Bystander deaths (1996-2015): 177 (2nd highest)
12. Montana
> Pursuit-related deaths per 100K: 3.4
> Pursuit-related deaths (1996-2015): 32 (10th lowest)
> Violent crimes per 100K (2015): 349.6 (25th highest)
> Bystander deaths (1996-2015): 10 (13th lowest)
[in-text-ad-2]
11. Arkansas
> Pursuit-related deaths per 100K: 3.5
> Pursuit-related deaths (1996-2015): 98 (24th highest)
> Violent crimes per 100K (2015): 521.3 (6th highest)
> Bystander deaths (1996-2015): 24 (21st lowest)

10. Oklahoma
> Pursuit-related deaths per 100K: 3.5
> Pursuit-related deaths (1996-2015): 123 (18th highest)
> Violent crimes per 100K (2015): 422.0 (14th highest)
> Bystander deaths (1996-2015): 14 (16th lowest)
[in-text-ad]
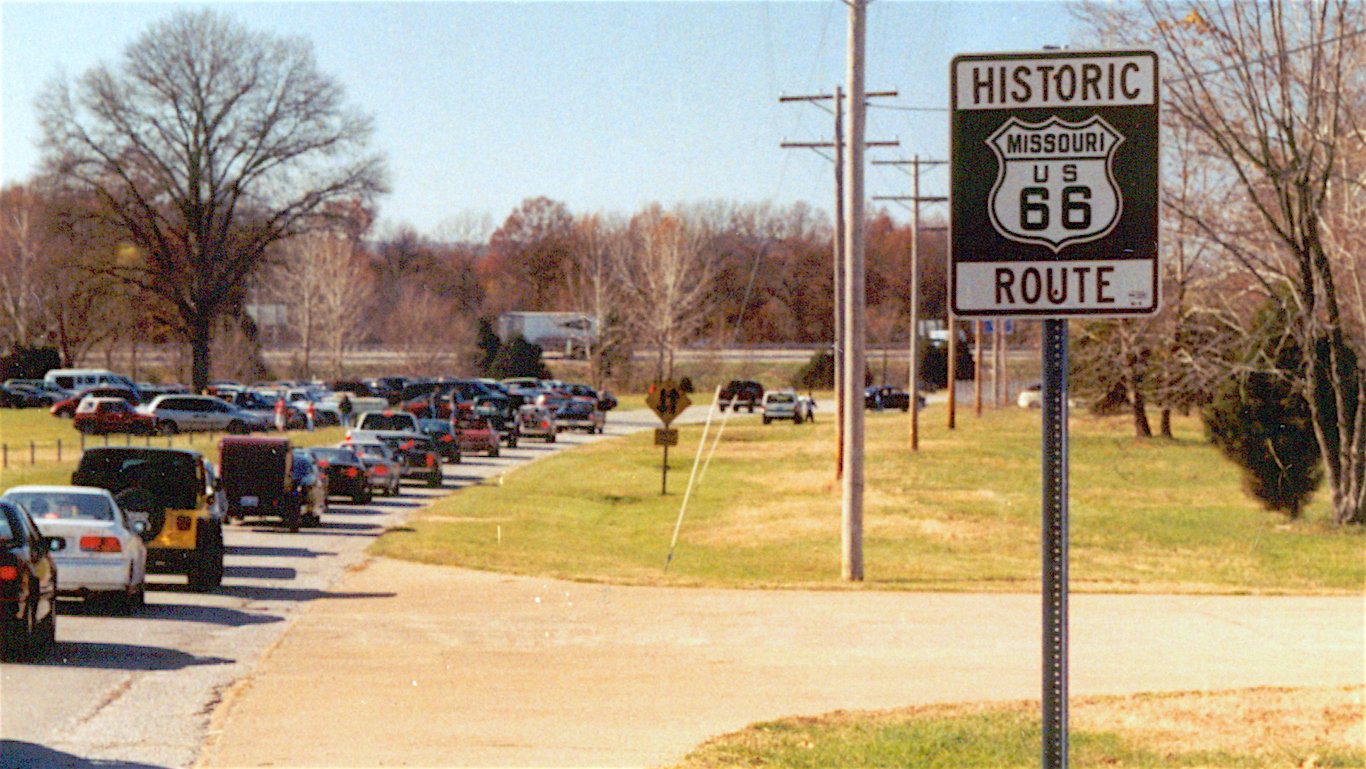
9. Missouri
> Pursuit-related deaths per 100K: 3.6
> Pursuit-related deaths (1996-2015): 206 (12th highest)
> Violent crimes per 100K (2015): 497.4 (9th highest)
> Bystander deaths (1996-2015): 79 (10th highest)
[recirclink id=386628]
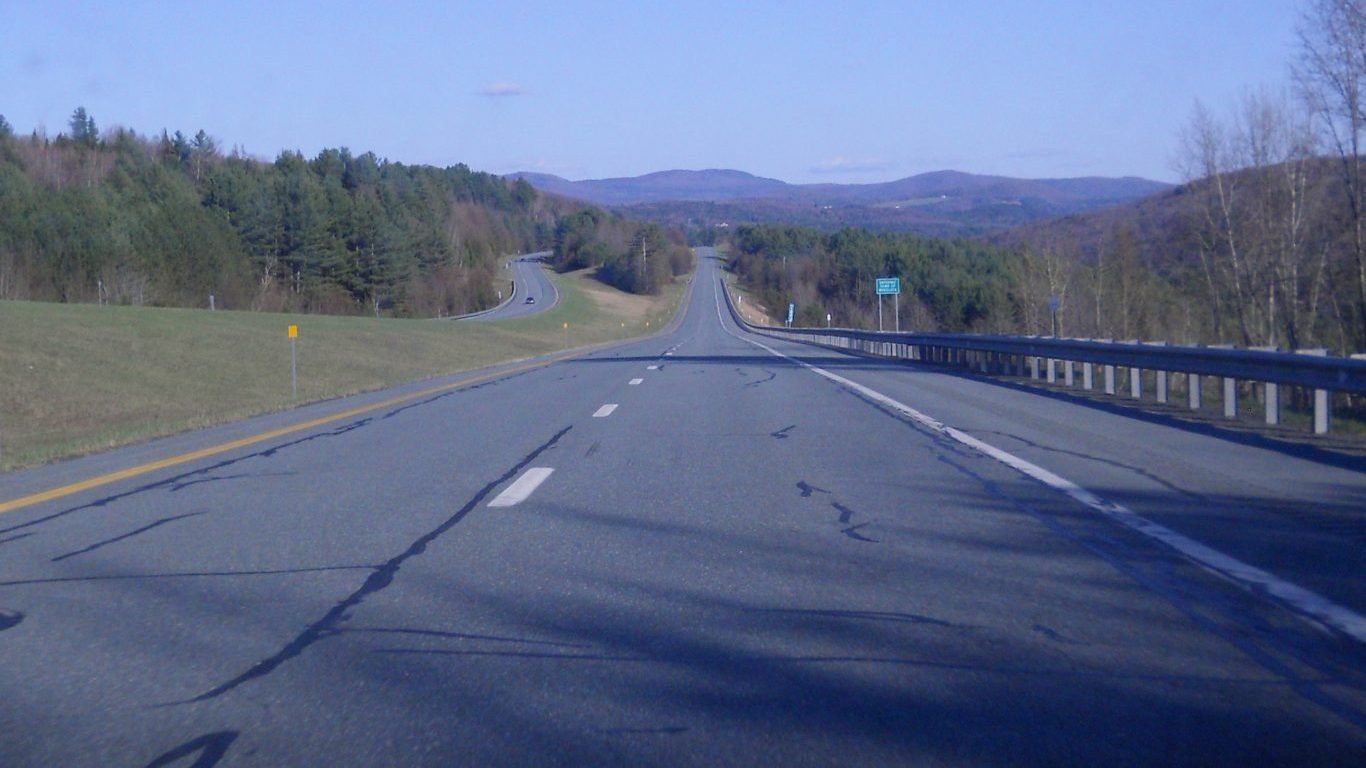
8. Vermont
> Pursuit-related deaths per 100K: 3.7
> Pursuit-related deaths (1996-2015): 23 (tied-6th lowest)
> Violent crimes per 100K (2015): 118.0 (the lowest)
> Bystander deaths (1996-2015): 11 (tied-14th lowest)
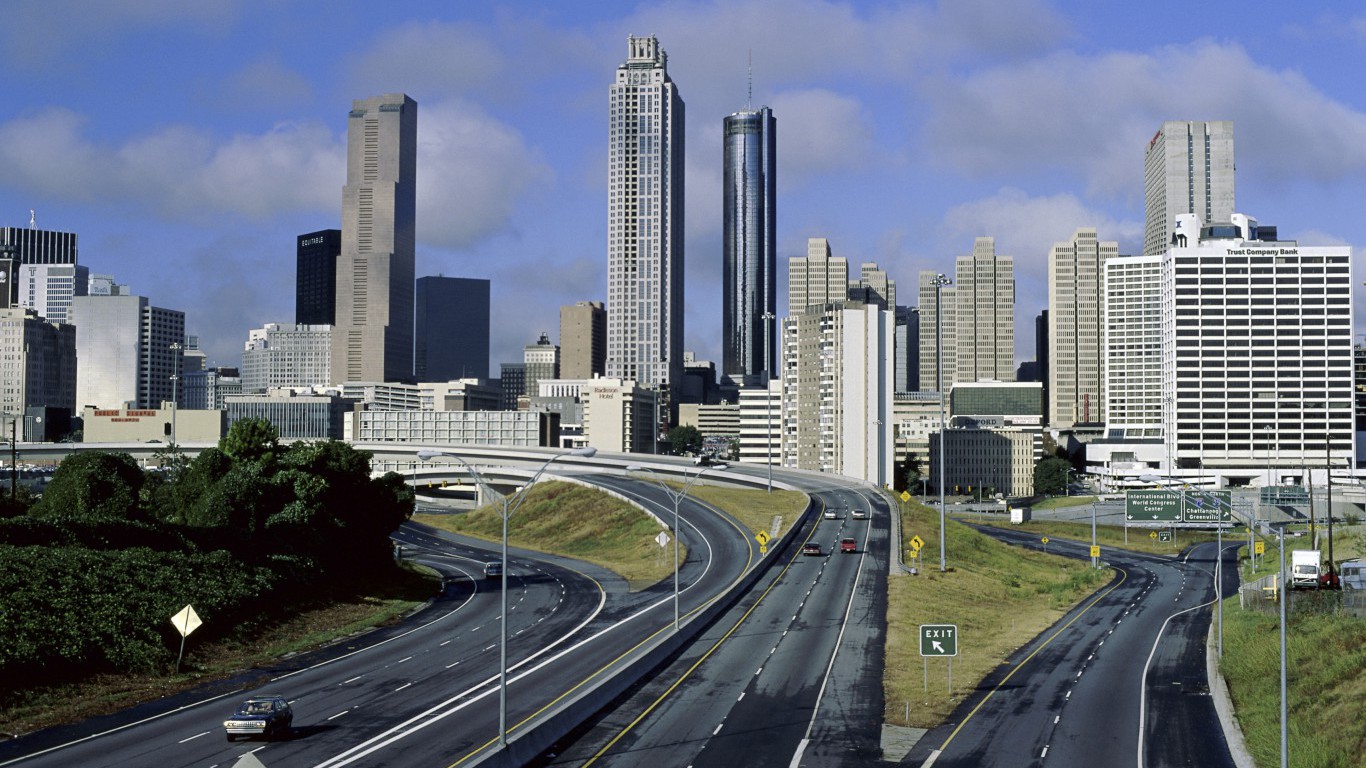
7. Georgia
> Pursuit-related deaths per 100K: 4.1
> Pursuit-related deaths (1996-2015): 369 (3rd highest)
> Violent crimes per 100K (2015): 378.3 (24th highest)
> Bystander deaths (1996-2015): 76 (11th highest)
[in-text-ad-2]
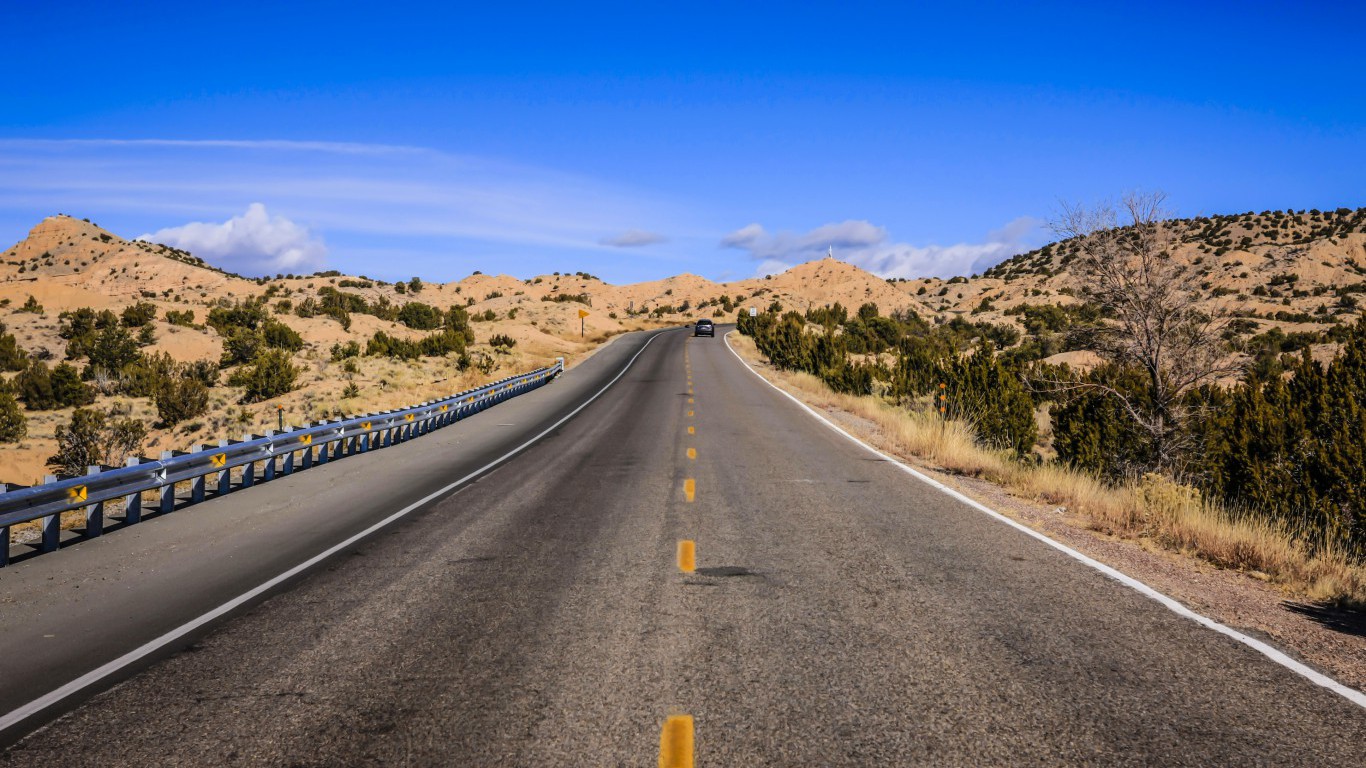
6. New Mexico
> Pursuit-related deaths per 100K: 4.1
> Pursuit-related deaths (1996-2015): 80 (tied-21st lowest)
> Violent crimes per 100K (2015): 656.1 (3rd highest)
> Bystander deaths (1996-2015): 37 (22nd highest)
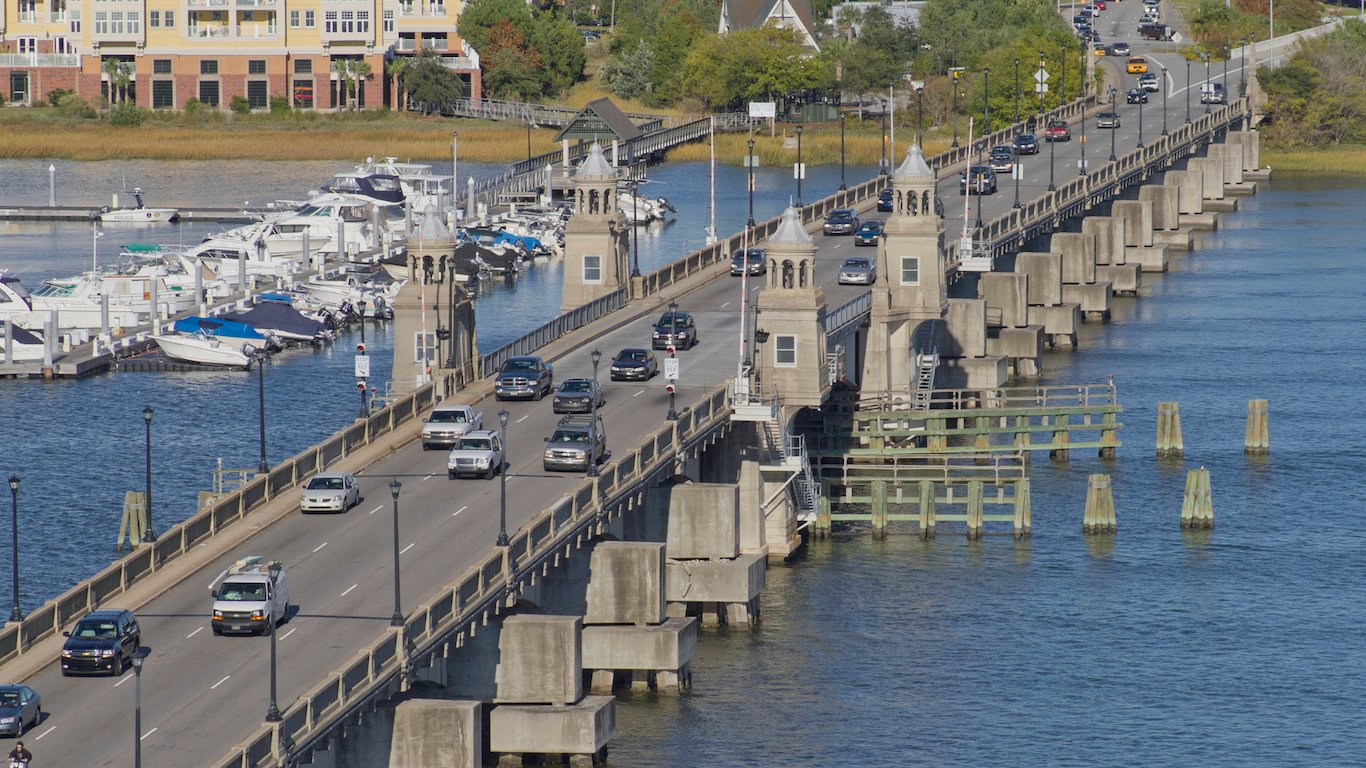
5. South Carolina
> Pursuit-related deaths per 100K: 4.2
> Pursuit-related deaths (1996-2015): 180 (15th highest)
> Violent crimes per 100K (2015): 504.5 (7th highest)
> Bystander deaths (1996-2015): 85 (9th highest)
[in-text-ad]
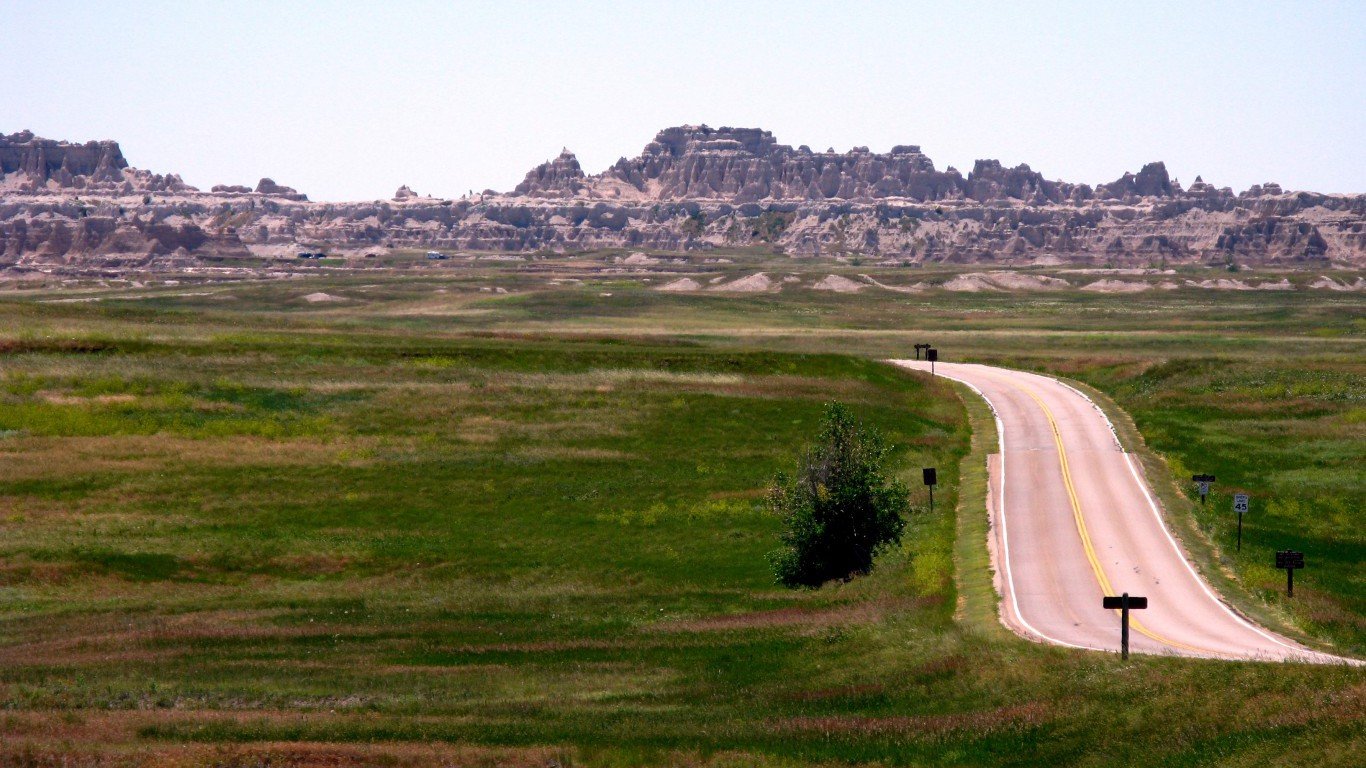
4. South Dakota
> Pursuit-related deaths per 100K: 4.5
> Pursuit-related deaths (1996-2015): 35 (11th lowest)
> Violent crimes per 100K (2015): 383.1 (22nd highest)
> Bystander deaths (1996-2015): 7 (tied-6th lowest)
[recirclink id=391571]
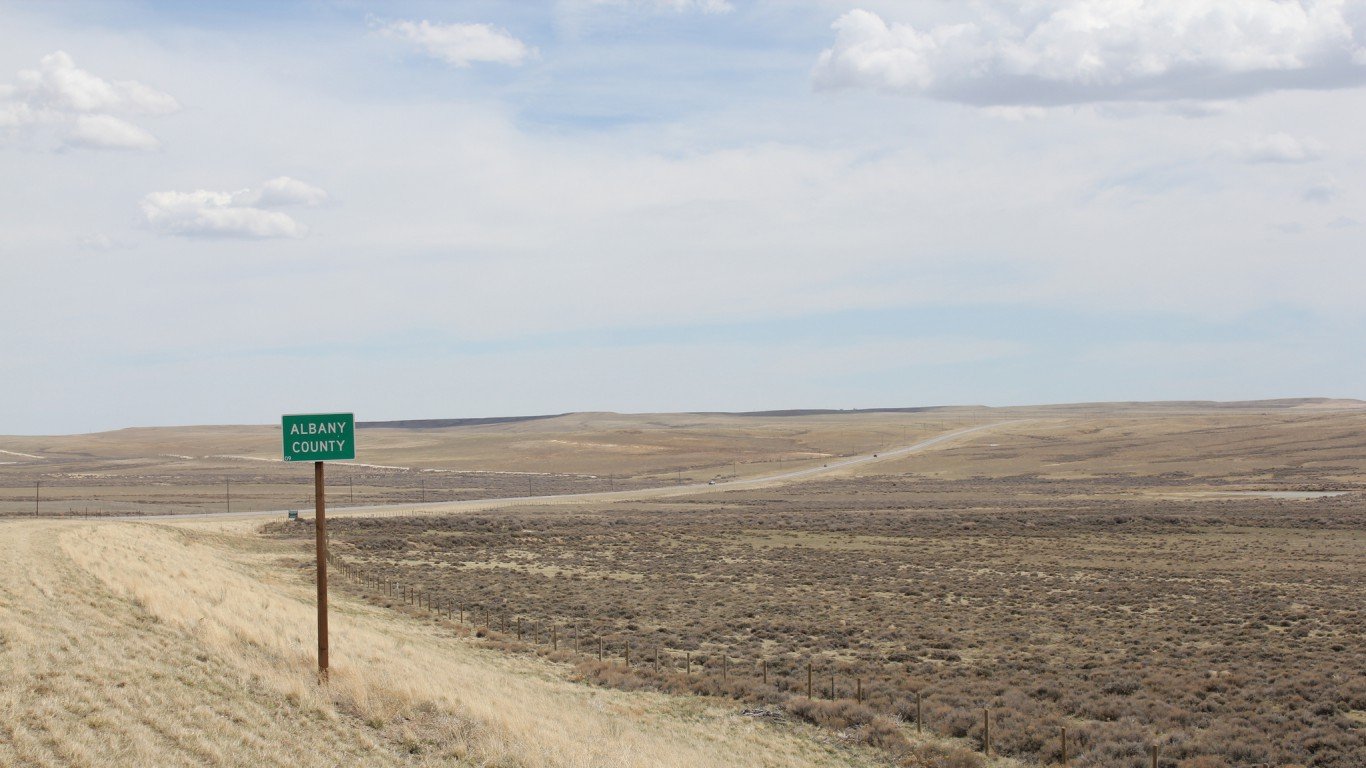
3. Wyoming
> Pursuit-related deaths per 100K: 4.5
> Pursuit-related deaths (1996-2015): 23 (tied-6th lowest)
> Violent crimes per 100K (2015): 222.1 (8th lowest)
> Bystander deaths (1996-2015): 4 (3rd lowest)
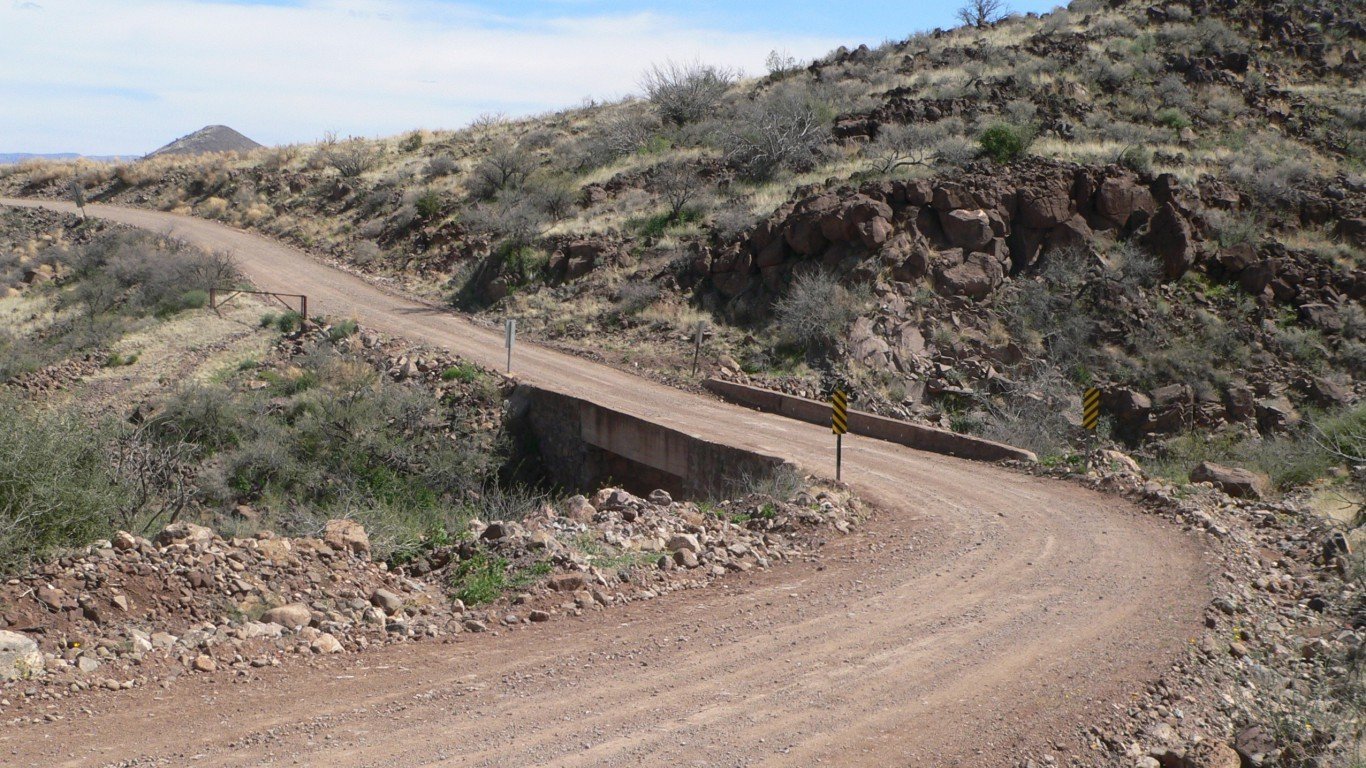
2. Arizona
> Pursuit-related deaths per 100K: 4.7
> Pursuit-related deaths (1996-2015): 272 (6th highest)
> Violent crimes per 100K (2015): 410.2 (17th highest)
> Bystander deaths (1996-2015): 103 (6th highest)
[in-text-ad-2]
1. Alabama
> Pursuit-related deaths per 100K: 5.3
> Pursuit-related deaths (1996-2015): 243 (9th highest)
> Violent crimes per 100K (2015): 472.4 (10th highest)
> Bystander deaths (1996-2015): 55 (16th highest)
Methodology
To identify the states with the deadliest police chases, 24/7 Wall St. reviewed the number of deaths in police pursuit-related crashes per 100,000 state residents in each state from “Police Vehicle Pursuits, 2012-2013,” a report released May 9 by the Bureau of Justice Statistics, a division of the U.S. Department of Justice. For state data, the report used pursuit-related fatalities from National Highway Traffic Safety Administration, Fatality Analysis Reporting System, 1996–2015. Characteristics of police agencies are based on the Law Enforcement Management and Administrative Statistics (LEMAS) survey, conducted 2012-2013.
Fatalities among police vehicle occupants, chased vehicle occupants, occupants of other vehicles, and non occupants in each state also came data published in the DOJ’s report. We combined deaths of occupants of other vehicles and of non occupants to determine the number of bystander fatalities.
The number of violent crimes per 100,000 people in each state came from the Federal Bureau of Investigation’s 2015 Uniform Crime Report.
Contact [email protected] for any questions or corrections.