[cnxvideo id=”655379″ placement=”ros”]The U.S. unemployment rate is currently 4.4%, nearly its lowest point in a decade. While the unemployment rate reflects the millions of Americans who are out of work and actively seeking employment, the measure does not fully capture the degree to which Americans are unable to find the jobs they want.
In addition to those seven million Americans captured by the traditional unemployment rate, there are millions more who are working part-time jobs because they could not find full-time employment, as well a large share of workers who have recently given up on their job search altogether and are now marginally attached to the workforce.
The underemployment rate — a combination of unemployed job seekers, discouraged and other marginally attached workers, and people settling for part-time jobs as a share of the labor force — is a more comprehensive measure of labor underutilization, and this measure varies considerably across the country.
To determine the easiest and hardest states to find full-time work, 24/7 Wall St. reviewed underemployment rates in all 50 states with data from the Bureau of Labor Statistics. The underemployment rate ranges from below 7% in some states to over 11% in others.
Click here to see the easiest and hardest states to find full-time work.
Click here to see our detailed findings and methodology.
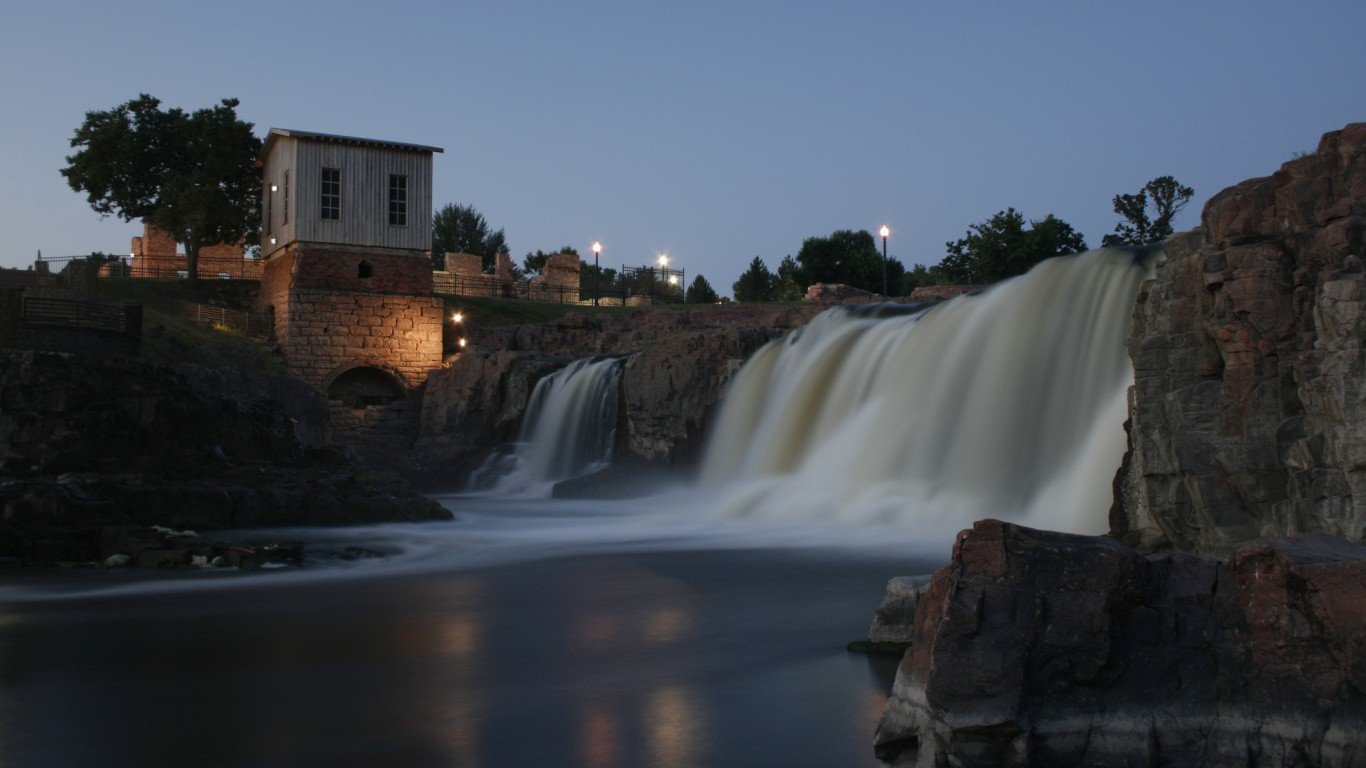
50. South Dakota
> Underemployment rate: 5.7%
> June unemployment rate: 3.0% (tied –6th lowest)
> Average wage: $41,177 (4th lowest)
> Labor force growth: 0.5% (17th smallest increase)
Just 5.7% of the South Dakota labor force are underemployed. In addition to those counted in the traditional unemployment measure, some workers are either working a part-time job when they would prefer full-time employment or have been recently discouraged from participating in the workforce altogether. The state’s underemployment rate is the smallest of any state. One factor partly responsible for South Dakota’s healthy job market is the state’s growing retail sector, which contributed more to statewide GDP growth in 2016 than any sector other than education and health services. An estimated 12.4% of South Dakota workers are employed in retail, the fifth largest share of any state.
[in-text-ad]
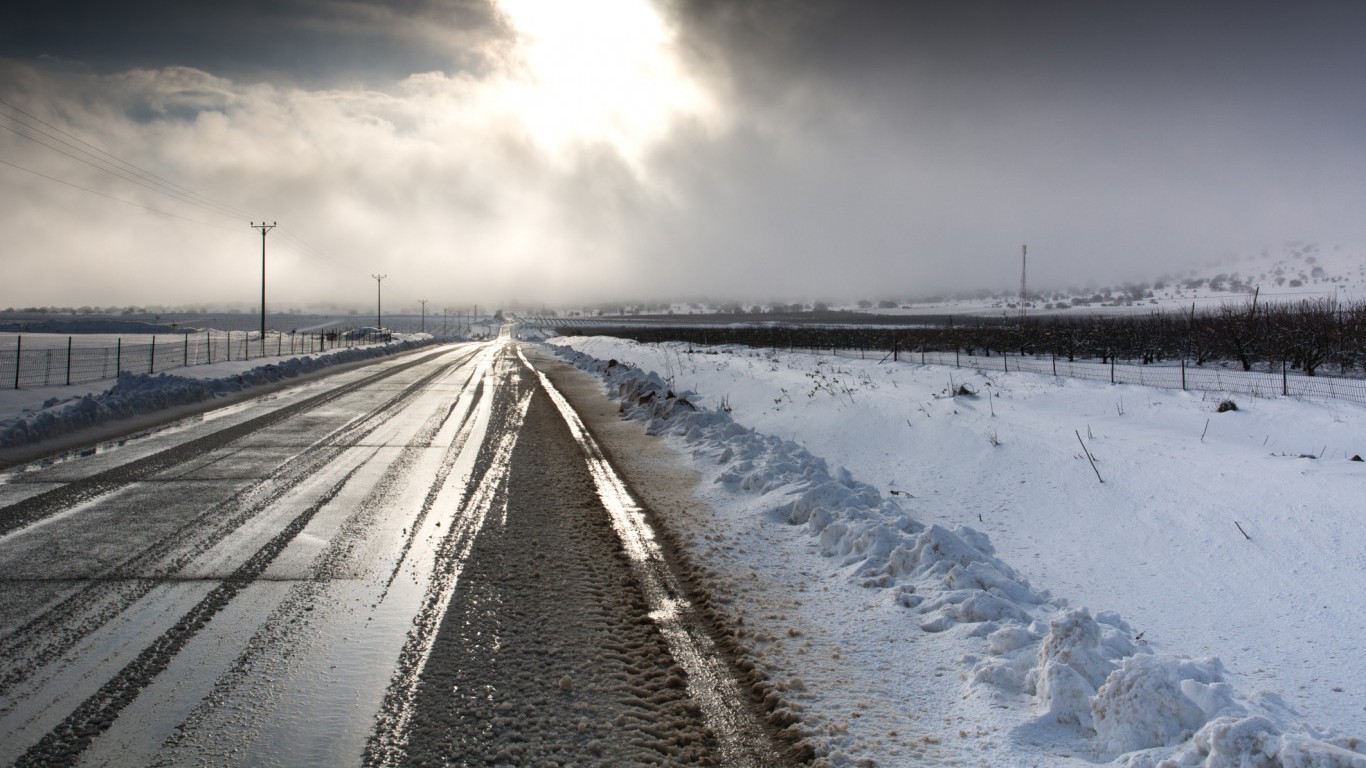
49. North Dakota
> Underemployment rate: 6.2%
> June unemployment rate: 2.3% (tied –the lowest)
> Average wage: $48,873 (21st highest)
> Labor force growth: 0.5% (18th smallest increase)
After the discovery of the Parshall Oil Field on the Bakken formation in 2006, North Dakota experienced an oil boom that led to low unemployment and nation-leading GDP growth. The state’s crude oil production increased more than tenfold over the past decade, from 108,000 barrels a day in 2006 to a peak of 1.2 million in 2015.
After the price of oil plummeted in 2014, however, the state’s economy began to falter. In 2016, the state GDP declined by a nation-worst 6.5%. Still, just 6.2% of the North Dakota workforce are currently underemployed — either looking for work and unable to find it, unable to find full-time employment and settling for a part-time job, or too discouraged to continue looking for work — tied with Nebraska for the second smallest share nationwide.
[recirclink id=404060]
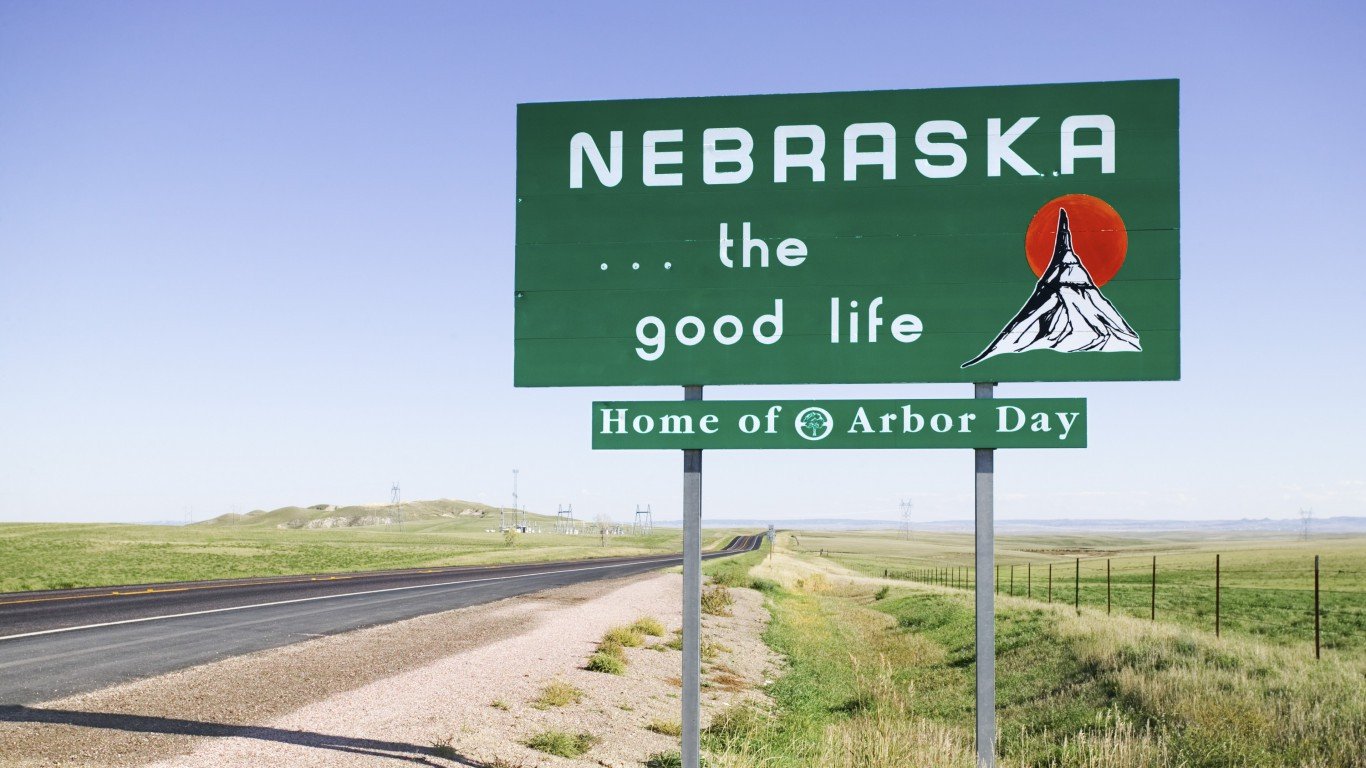
48. Nebraska
> Underemployment rate: 6.2%
> June unemployment rate: 2.9% (tied –4th lowest)
> Average wage: $43,606 (10th lowest)
> Labor force growth: 0.3% (14th smallest increase)
Only 6.2% of the Nebraska labor force are out of a job or underemployed — the second smallest share of any state. The state has a strong job market despite below average employment growth. Employment in the state increased by only 0.1% last year and by an annual average of 1.4% over each of the last five years. In comparison, nationwide employment grew by 1.7% and 1.9%, respectively.
As evidence of the state’s strong job market, just 0.1% of the labor force has given up looking for work recently. Nebraska is one of only six states with such a proportionally small group of discouraged ex-job seekers.
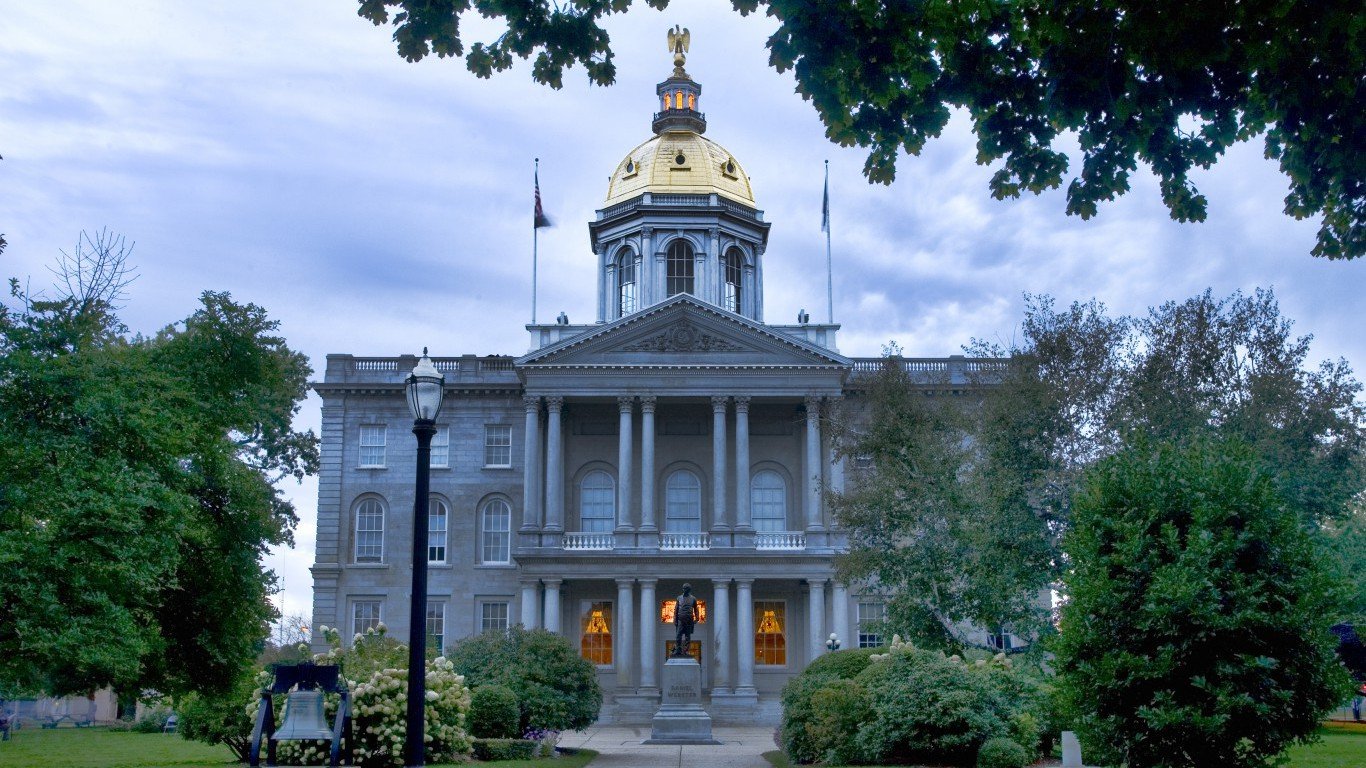
47. New Hampshire
> Underemployment rate: 6.4%
> June unemployment rate: 2.9% (tied –4th lowest)
> Average wage: $53,559 (15th highest)
> Labor force growth: 0.8% (25th largest increase)
In New Hampshire, 35.7% of adults have a bachelor’s degree or higher, one of the largest shares of any state. A highly educated workforce often coincide with a healthier job market, and only 6.4% of New Hampshire’s labor force are underemployed — well below the 9.5% nationwide underemployment rate.
As is the case with those who are part of the traditional unemployment rate, those who need full-time work but are unable to find it and those who have given up looking for work are often at greater risk of facing serious financial hardship. Only 8.2% of New Hampshire’s population live below the poverty line, the smallest share of any state.
[in-text-ad-2]
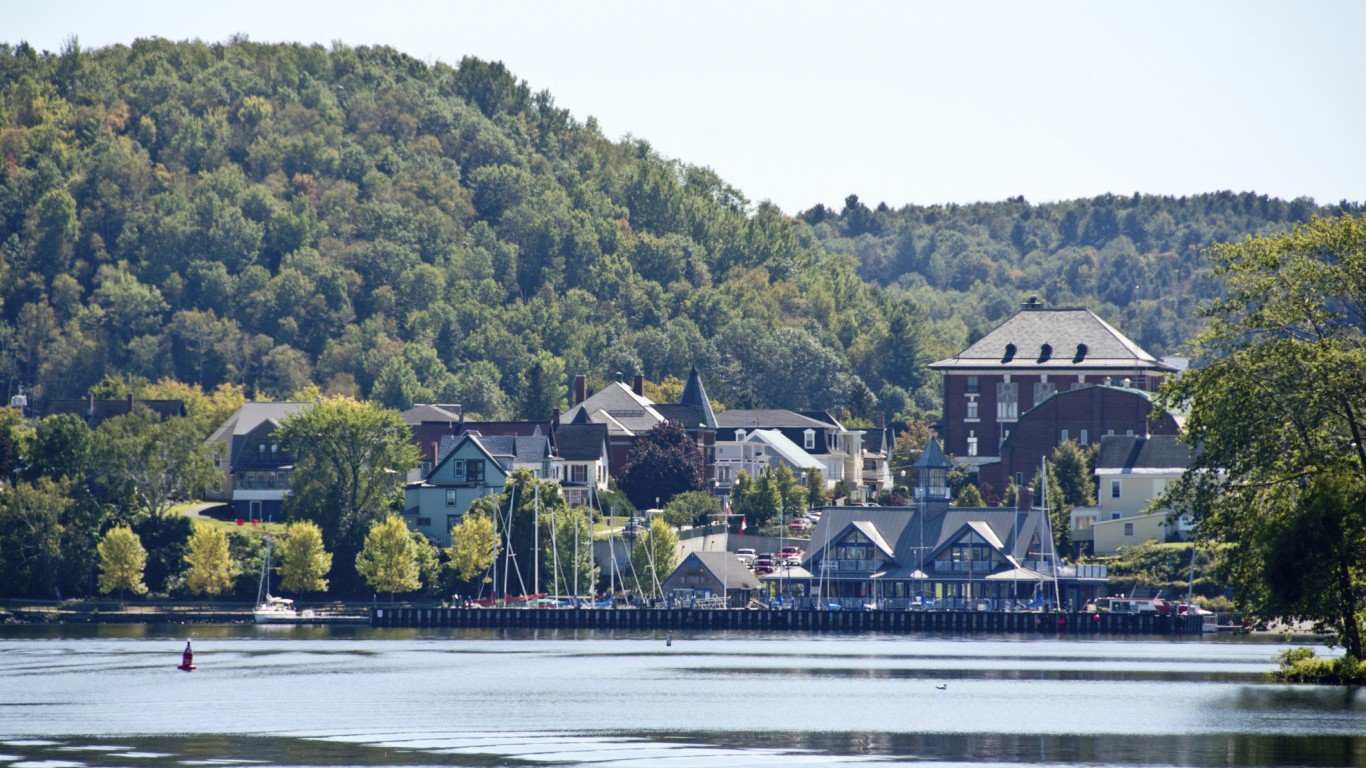
46. Vermont
> Underemployment rate: 6.8%
> June unemployment rate: 3.2% (tied –10th lowest)
> Average wage: $45,037 (18th lowest)
> Labor force growth: -0.2% (7th largest decline)
Similar to neighboring New Hampshire, Vermont has one of the strongest job markets of any state. Only 6.8% of the state’s labor force are underemployed — well below the comparable 9.5% share nationwide.
Strong employment across the state is partially attributable to economic growth and a shrinking labor force. In the last year, the size of the labor force in the state fell by 0.2% as employment climbed by 0.2%. Economic growth in the Green Mountain State was driven by the education and health care as well as the leisure and hospitality sectors. As was the case across the United States, durable goods manufacturing was a drag on Vermont’s economy.
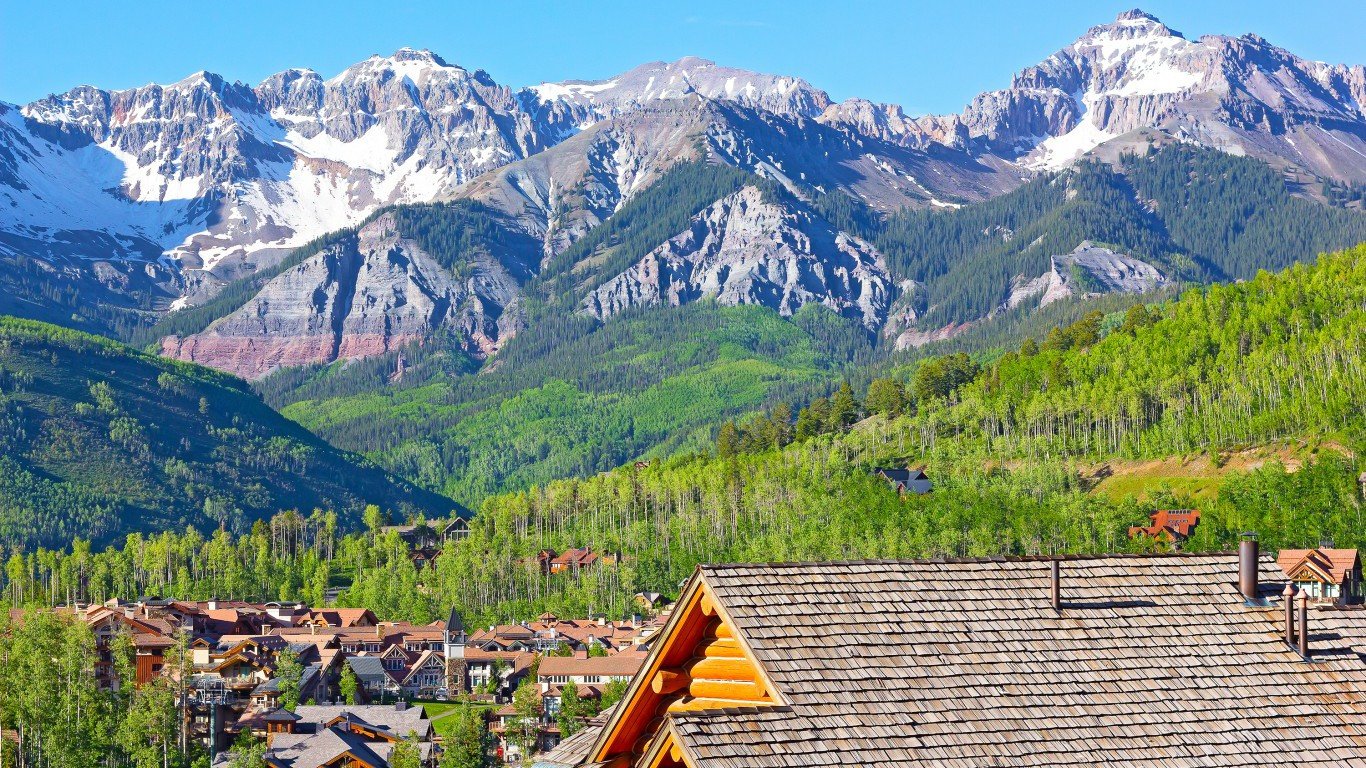
45. Colorado
> Underemployment rate: 6.9%
> June unemployment rate: 2.3% (tied –the lowest)
> Average wage: $54,669 (10th highest)
> Labor force growth: 2.0% (10th largest increase)
Colorado’s unemployment rate is tied with North Dakota’s as the lowest in the country. Just 2.3% of the state’s labor force are looking for work but are unable to find it. When including other groups, such as those who have given up looking for work and those who have been forced into part-time jobs because they could not find full-time work, the state’s underemployment rate climbs to 6.9%. Still, the state’s underemployment rate is lower than the vast majority of states, as well as the 9.5% underemployment rate nationwide. Those with college degrees are more likely to find full-time employment, and Colorado’s adult college attainment rate of 39.2% is second highest among states.
[in-text-ad]
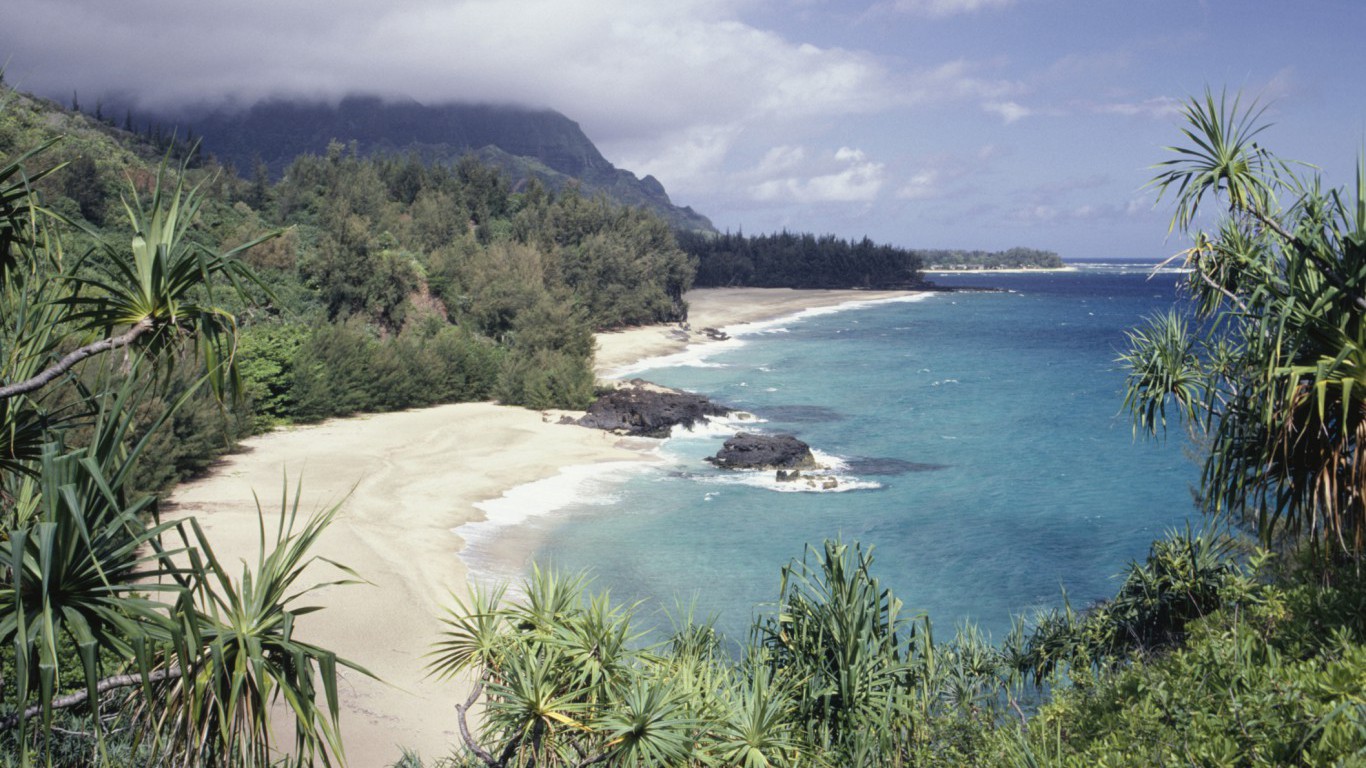
44. Hawaii
> Underemployment rate: 7.1%
> June unemployment rate: 2.7% (3rd lowest)
> Average wage: $48,184 (23rd highest)
> Labor force growth: 1.6% (14th largest increase)
Just 7.1% of the Hawaii labor force is underemployed, significantly less than the 9.5% national underemployment rate. One factor contributing to Hawaii’s healthy job market is the state’s flourishing leisure and hospitality industry, which contributed more to Hawaii’s GDP growth in 2016 than any other sector. The number of annual visitors to the state hit a record 8.9 million last year, and they spent a record total of $15.6 billion. Some 18.3% of workers in Hawaii are employed in leisure and hospitality, the largest share of any state other than Nevada.
[recirclink id=404324]
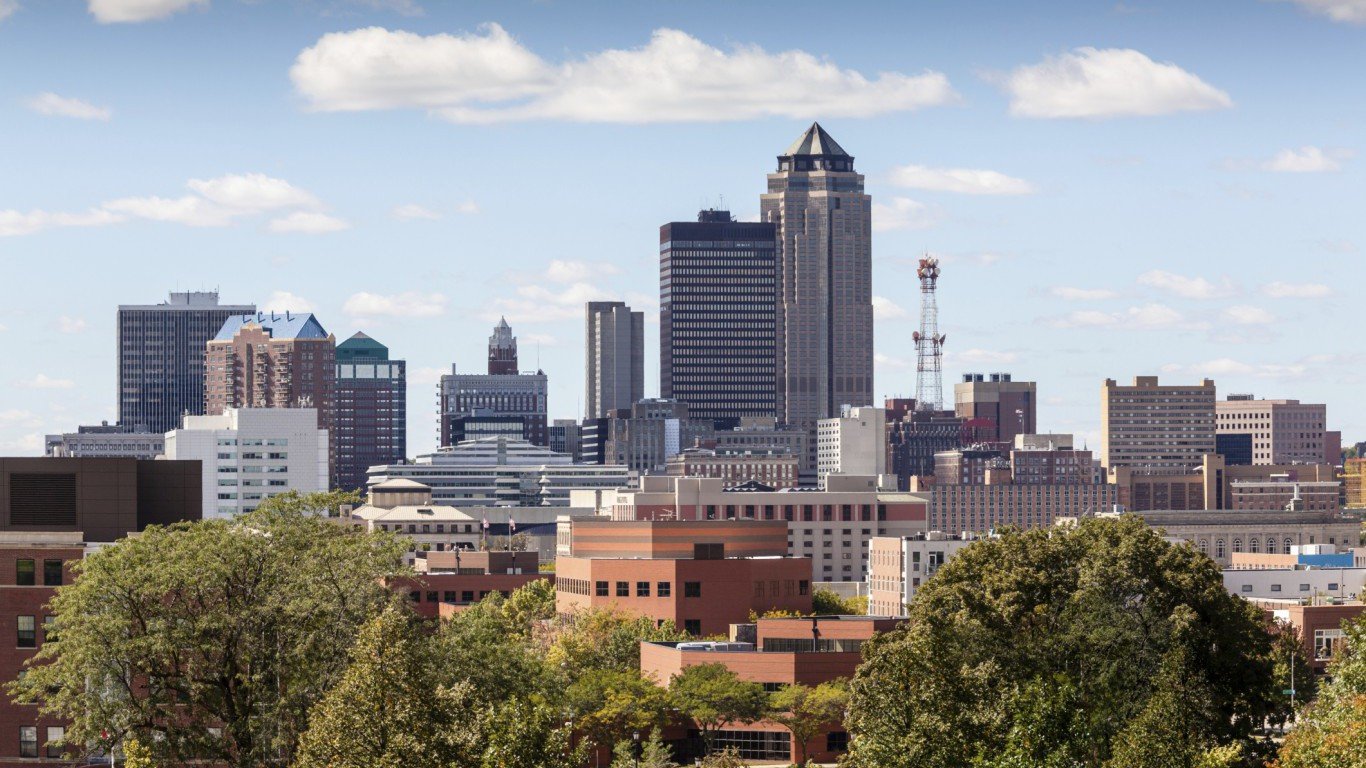
43. Iowa
> Underemployment rate: 7.1%
> June unemployment rate: 3.2% (tied –10th lowest)
> Average wage: $44,910 (16th lowest)
> Labor force growth: -0.1% (9th largest decline)
In some states, a large share of the labor force gives up looking for work because they believe no jobs are available for them. In Iowa, however, just 0.1% of the labor force has recently given up looking for jobs, tied with several other states as the lowest share in the country. Iowa has maintained one of the most stable job markets in the country. While the U.S. unemployment rate peaked at 10% due to the recession, Iowa’s jobless rate has not exceeded 6.6% over the past decade.
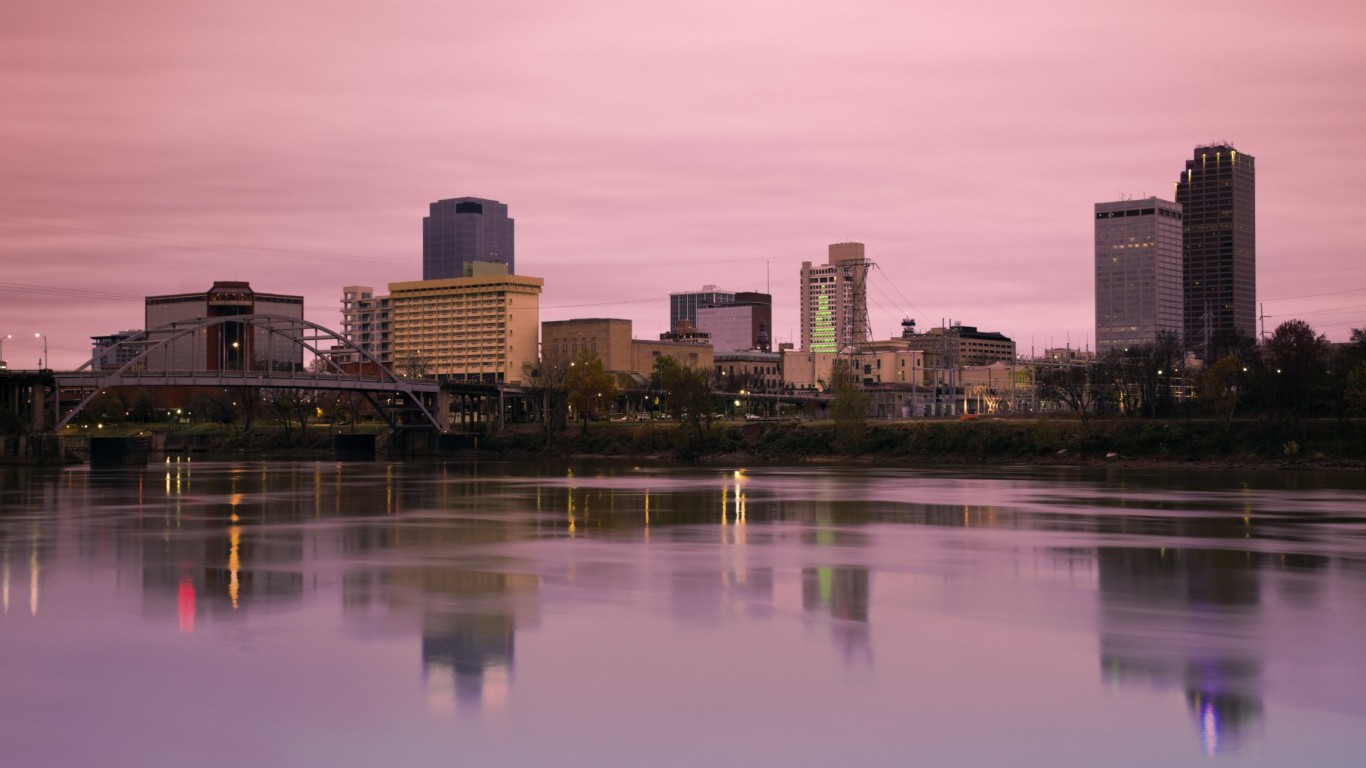
42. Arkansas
> Underemployment rate: 7.2%
> June unemployment rate: 3.4% (tied –12th lowest)
> Average wage: $41,571 (5th lowest)
> Labor force growth: 0.8% (25th smallest increase)
Only 7.2% of Arkansas’ workers are unemployed, marginally attached, or working part-time in lieu of full-time work — well below the nationwide 9.5% underemployment rate. The state’s 1.9% job growth over the last year outpaced the 1.7% job growth nationwide. Growth was driven largely by Arkansas’ education and health care and professional and business sectors.
While there are enough jobs, many are not especially high paying. The average wage in Arkansas is less than $42,000 a year, well below what the average wage in the majority of states.
[in-text-ad-2]
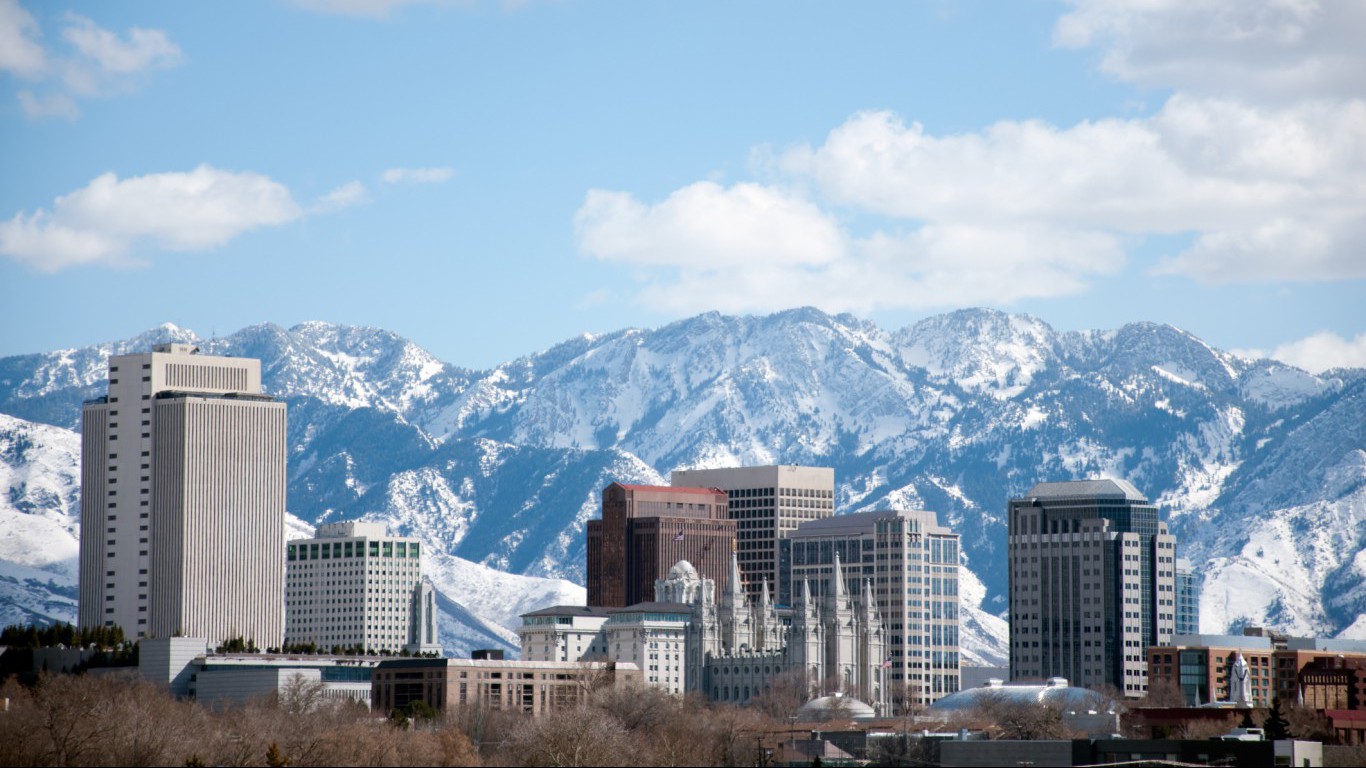
41. Utah
> Underemployment rate: 7.4%
> June unemployment rate: 3.4% (tied –12th lowest)
> Average wage: $45,249 (19th lowest)
> Labor force growth: 3.1% (2nd largest increase)
Utah has led the nation in job growth over the past five years, at an average rate of 3.4% per year. Even as the labor force increased by 3.1% people in 2016 — the second most of any state when adjusted for population — the number of unemployed workers fell slightly. Like the nation as a whole, GDP growth in the state in 2016 was led by the education and health services and professional and business services sectors.
Utah has also had significant growth in its technology sector, as more startups move to the tech cluster known as the Silicon Slopes in the Salt Lake City metropolitan area. A strong economy may have helped boost optimism among job-seekers in the state and has likely kept some unemployed workers from dropping out of the labor force. Just 0.1% of Utah’s labor force has given up on looking for employment in the past four weeks because they felt no jobs were available for them, one of the smallest shares of any state.
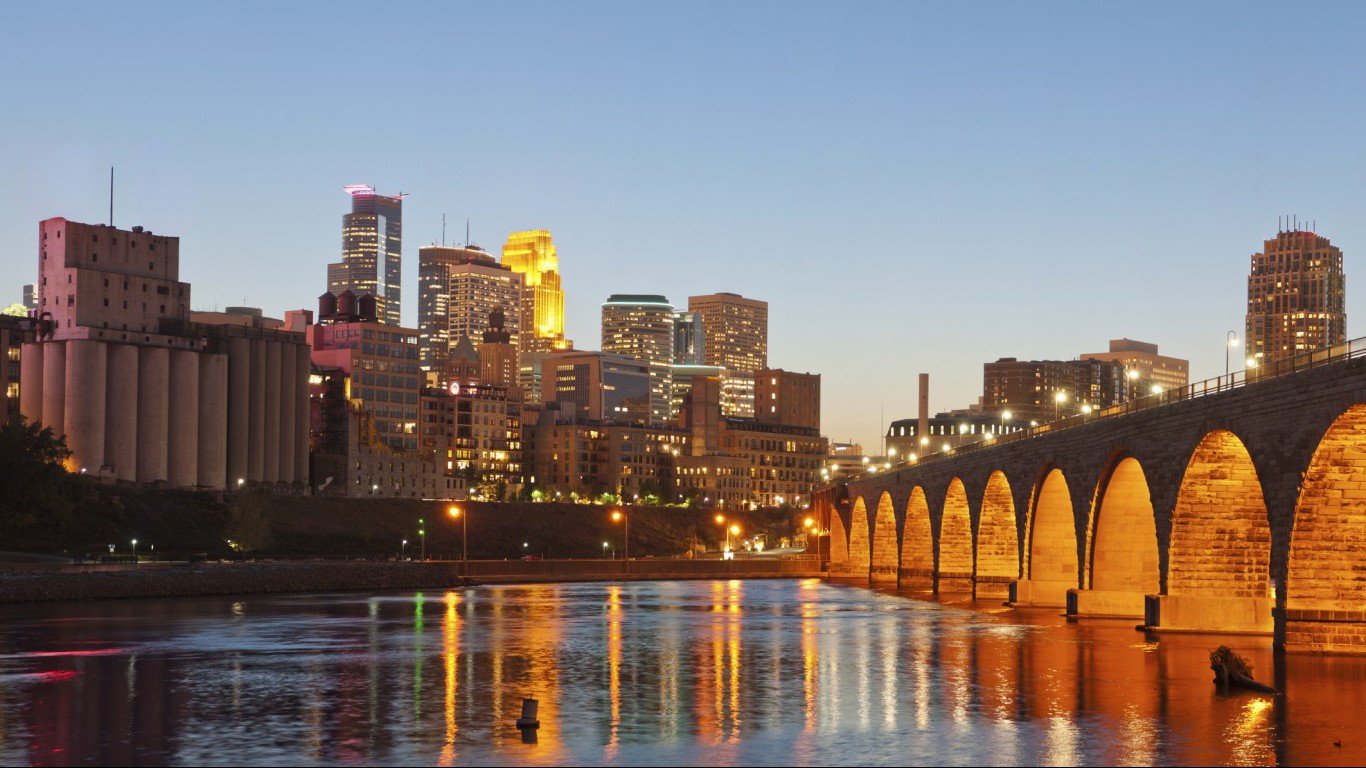
40. Minnesota
> Underemployment rate: 7.7%
> June unemployment rate: 3.7% (tied –16th lowest)
> Average wage: $54,270 (12th highest)
> Labor force growth: 0.9% (22nd largest increase)
In Minnesota, 7.7% of the labor force are either working part-time instead of full-time, are jobless and looking for work, or have recently given up the search for employment altogether — a relatively low share compared to the 9.5% national figure. Minnesota’s strong job market may be partially due to the state’s highly educated workforce. An estimated 34.7% of adults in the state have at least a bachelor’s degree, one of the largest shares of any state. The healthy job market may also help many residents stay out of poverty, as the state’s poverty rate of 10.2% is the fourth smallest of any state.
[in-text-ad]
39. Wisconsin
> Underemployment rate: 7.7%
> June unemployment rate: 3.1% (tied –8th lowest)
> Average wage: $46,009 (21st lowest)
> Labor force growth: 0.8% (24th largest increase)
Wisconsin is one of three Midwestern states in which 7.7% of the labor force are underemployed. Like the other two states, Indiana and Minnesota, Wisconsin has a relatively strong manufacturing sector. Major manufacturers in the state include Briggs & Stratton, Harley Davidson, and Johnson Controls. Some 9.6% of workers in the state are employed in durable goods manufacturing, and another 6.3% in nondurable goods manufacturing, each roughly double the comparable shares nationwide. However, in keeping with the broader national trend, durable goods manufacturing was a drag on the state’s economy last year.
[recirclink id=403601]
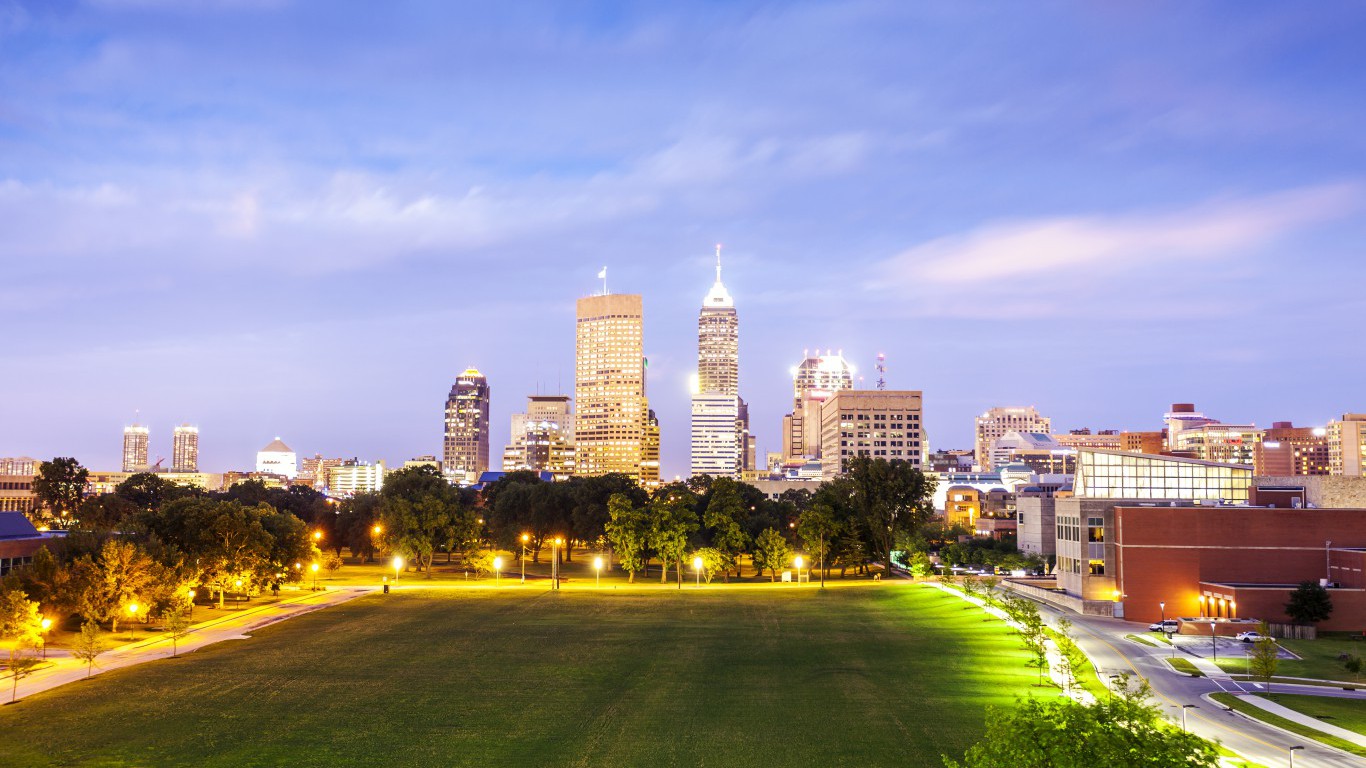
38. Indiana
> Underemployment rate: 7.7%
> June unemployment rate: 3.0% (tied –6th lowest)
> Average wage: $44,594 (14th lowest)
> Labor force growth: 1.7% (12th largest increase)
Some 7.7% of Indiana’s workforce are underemployed. Still the state’s job market is healthier than that of most states and the nation’s as a whole. The number of jobs in Indiana climbed 2.1% last year, outpacing the 1.7% nationwide growth.
In a break from the broader national trend, Indiana’s durable goods manufacturing sector was a boon to the state economy in 2016. Some 12.2% of the state’s labor force works in the sector, the largest such share of any state in the country. Major manufacturers in the state include Rolls Royce, Raytheon, and Toyota.
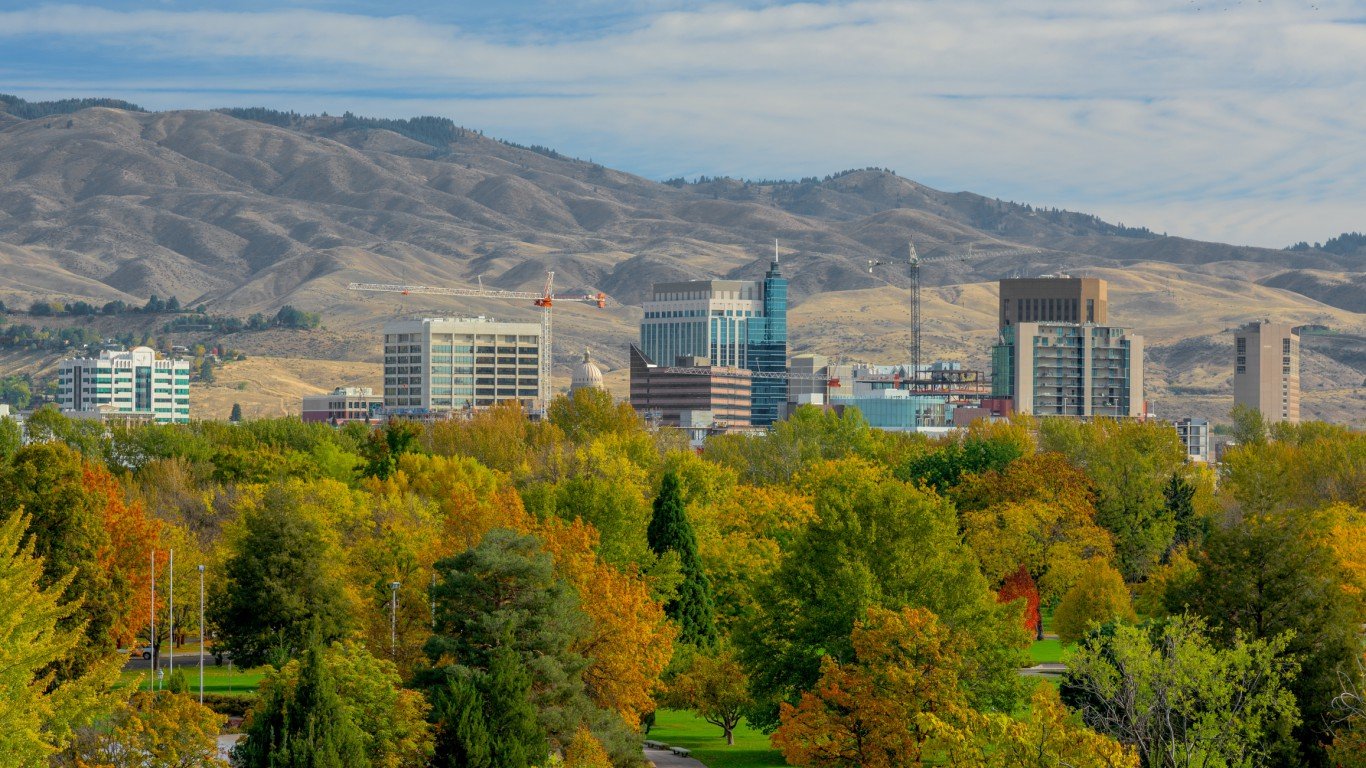
37. Idaho
> Underemployment rate: 7.7%
> June unemployment rate: 3.1% (tied –8th lowest)
> Average wage: $39,632 (2nd lowest)
> Labor force growth: 2.2% (8th largest increase)
Idaho has one of the lower underemployment rates in the country, and this is likely due in part to its considerable job growth in recent years. Over the last five years, employment in the state has grown by an average of 2.5% annually, eighth most in the country. While Idaho workers are more likely to find full-time work, their pay can leave something to be desired. The state’s average annual wage of $39,632 is the second lowest in the country.
[in-text-ad-2]
![]()
36. Massachusetts
> Underemployment rate: 7.8%
> June unemployment rate: 4.3% (tied — 20th highest)
> Average wage: $67,429 (2nd highest)
> Labor force growth: 0.2% (13th smallest increase)
In Massachusetts, 7.8% of the labor force is underemployed, well below the 9.5% national figure. One factor contributing to the healthy employment situation in Massachusetts is the state’s highly educated workforce. A college degree can increase the chance of finding full-time employment. An estimated 41.5% of adults in Massachusetts have at least a bachelor’s degree, the largest share nationwide.
While Massachusetts is one the easier states in which to find full-time employment, worker confidence is relatively low as of late. Some 1.3% of the Massachusetts labor force has given up looking for work in recent weeks, the largest share of any state with an unemployment rate below the U.S. rate and nearly the largest such share in the country.
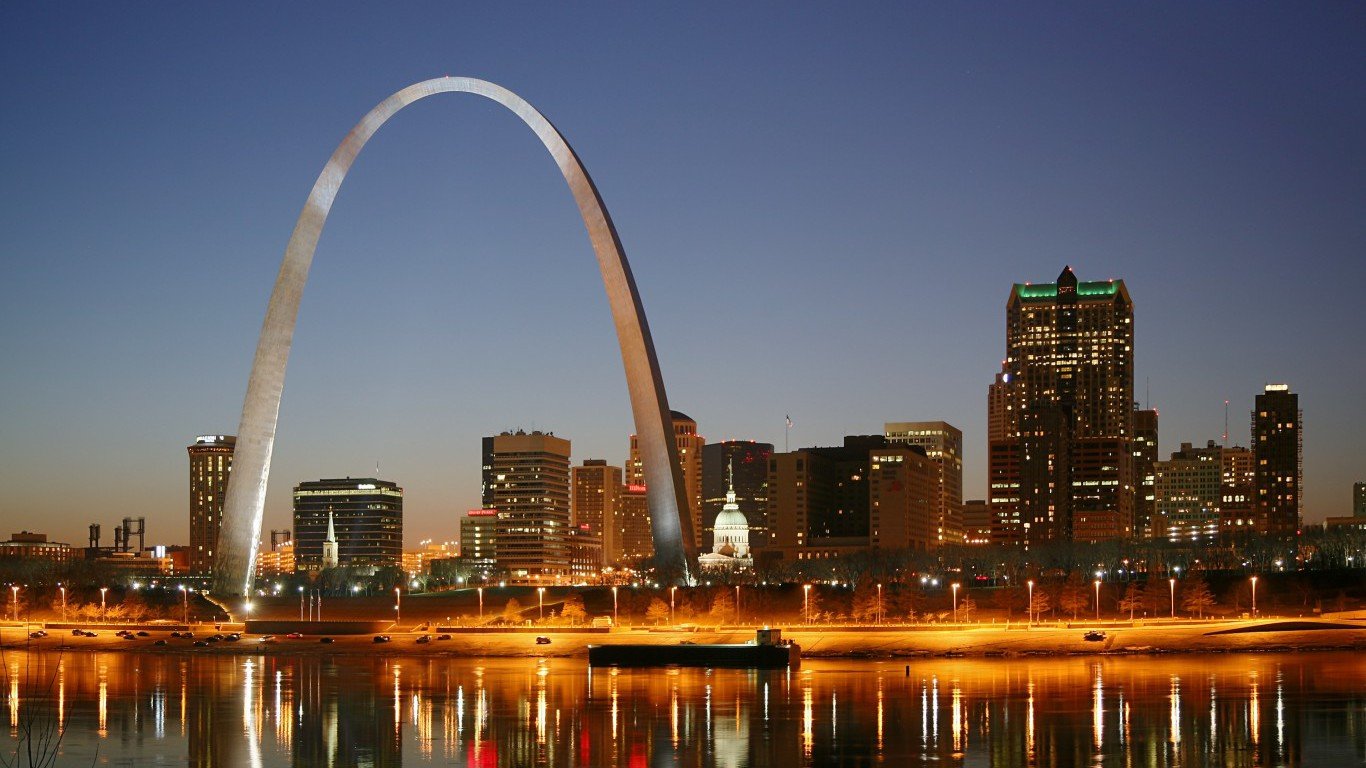
35. Missouri
> Underemployment rate: 7.8%
> June unemployment rate: 3.8% (tied –20th lowest)
> Average wage: $46,125 (22nd lowest)
> Labor force growth: 0.5% (19th smallest increase)
A smaller share of Missouri’s labor force is underemployed than is typical nationwide. Despite greater job availability, Missouri residents are just as likely to face serious financial hardship than the typical American. The state’s 14.8% poverty rate is in line with the 14.7% U.S. poverty rate. Jobs in the state also tend to be relatively low paying. The average annual wage in the state is only $46,125, well below the $53,611 average wage nationwide.
[in-text-ad]
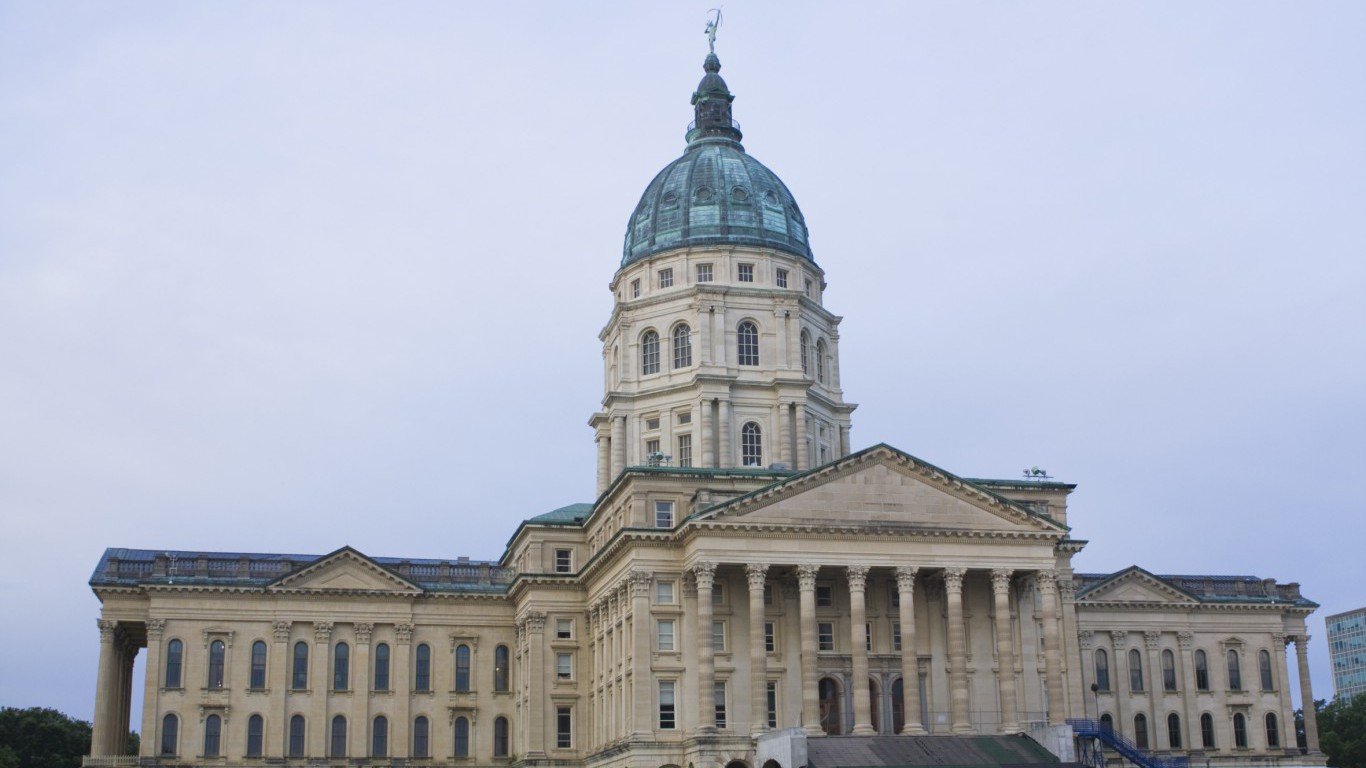
34. Kansas
> Underemployment rate: 8.1%
> June unemployment rate: 3.7% (tied –16th lowest)
> Average wage: $44,140 (13th lowest)
> Labor force growth: -0.3% (4th largest decline)
The job market in Kansas compares favorably to most other states and the country as a whole, with 8.1% of the state’s workers unable to find the work they want, compared to a national underemployment rate of 9.5%. However, the job market appears to have become slightly less favorable, as employment in Kansas contracted last year — one of only five states where this was the case. Still, the state’s underemployment rate has improved considerably from five years ago, when it was at 11.5%.
[recirclink id=404324]
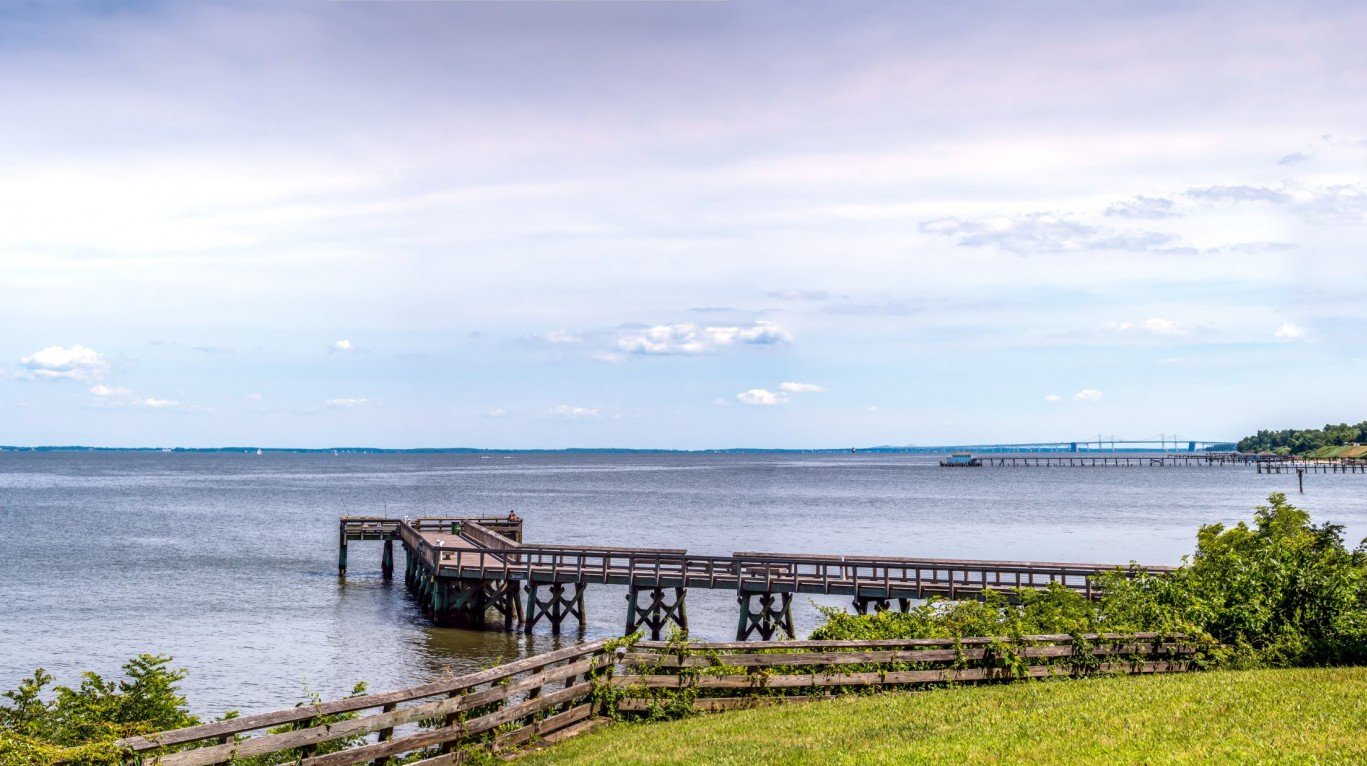
33. Maryland
> Underemployment rate: 8.3%
> June unemployment rate: 4.1% (tied — 24th highest)
> Average wage: $58,103 (7th highest)
> Labor force growth: 0.7% (22nd smallest increase)
Workers in Maryland are less likely to be underemployed and more likely to be highly compensated than the typical American worker. Some 8.3% of the labor force are underemployed, and the average annual wage across all industries is $58,103. Nationwide, 9.5% of the labor force is underemployed, and the average wage is $53,611.
The state’s better than average economic conditions are are partially attributable to the professional and business services sector, which employs 16.3% of Maryland’s workforce, the sector’s second highest concentration in any state. Professional and business services, a sector that tends to pay relatively well, was also the biggest driver of economic growth in Maryland in 2016.
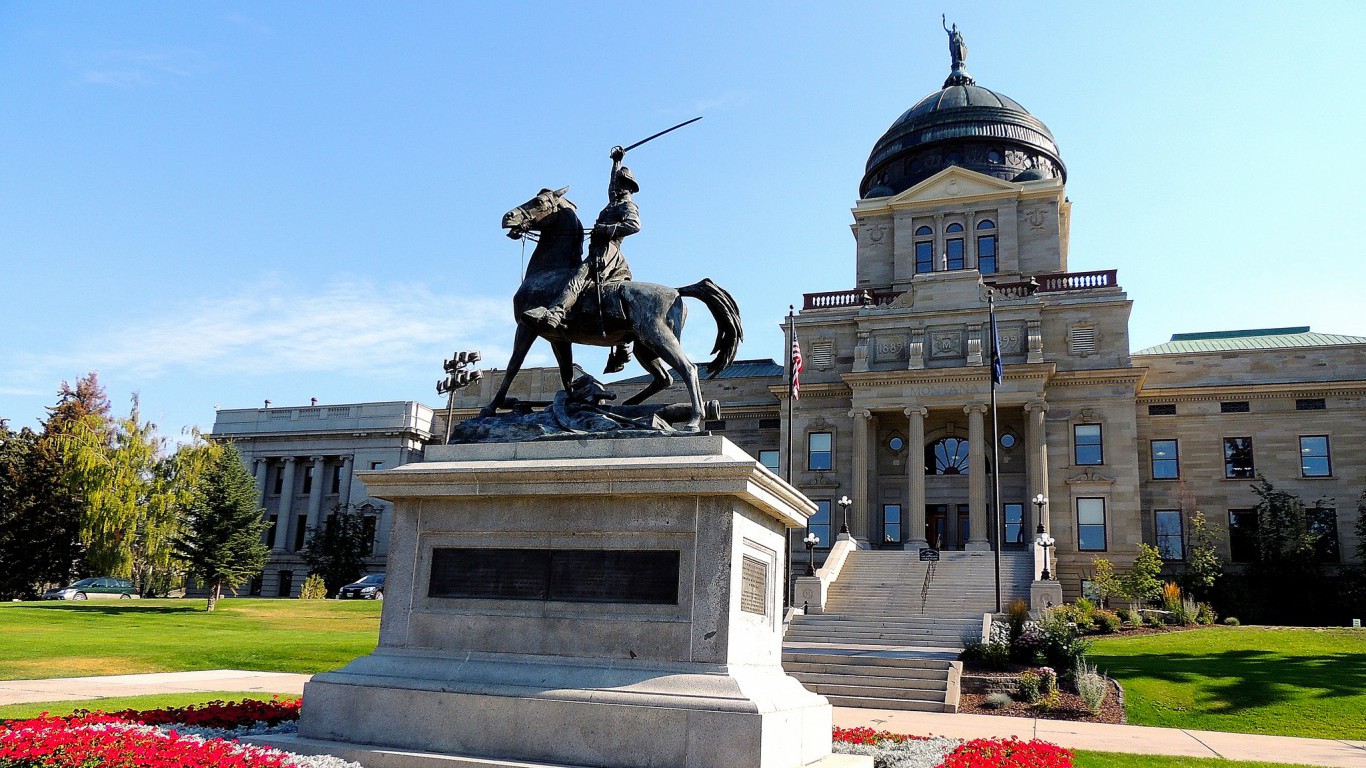
32. Montana
> Underemployment rate: 8.3%
> June unemployment rate: 3.9% (tied –22nd lowest)
> Average wage: $40,730 (3rd lowest)
> Labor force growth: 1.3% (16th largest increase)
Montana’s unemployment rate of 3.9% is slightly below the national rate of 4.4%. Similarly, the state’s underemployment rate of 8.3% is slightly more favorable than the national rate of 9.5%. Accounting for the bulk of the difference between Montana’s underemployment and unemployment rate is the 3.4% share of the workers currently employed in part-time jobs when they would prefer to have full-time jobs. Five years ago, Montana’s underemployment rate was 14.9%, compared to the U.S. underemployment rate of 15.6%.
[in-text-ad-2]
31. Maine
> Underemployment rate: 8.5%
> June unemployment rate: 3.5% (14th lowest)
> Average wage: $42,602 (8th lowest)
> Labor force growth: 1.2% (19th largest increase)
Maine’s 8.5% underemployment rate is slightly better than the 9.5% U.S. rate. The state’s largest industry by total employment — education and healthcare, which accounts for about 1 in every 5 jobs — was also the biggest driver of GDP growth in 2016. That year, Maine’s economy expanded by 1.4%, and employment expanded by 1.7%.
A healthy economy is often bolstered by a highly-skilled workforce. In Maine, 91.7% of adults have a high school diploma, one of the highest educational attainment rates of any state.
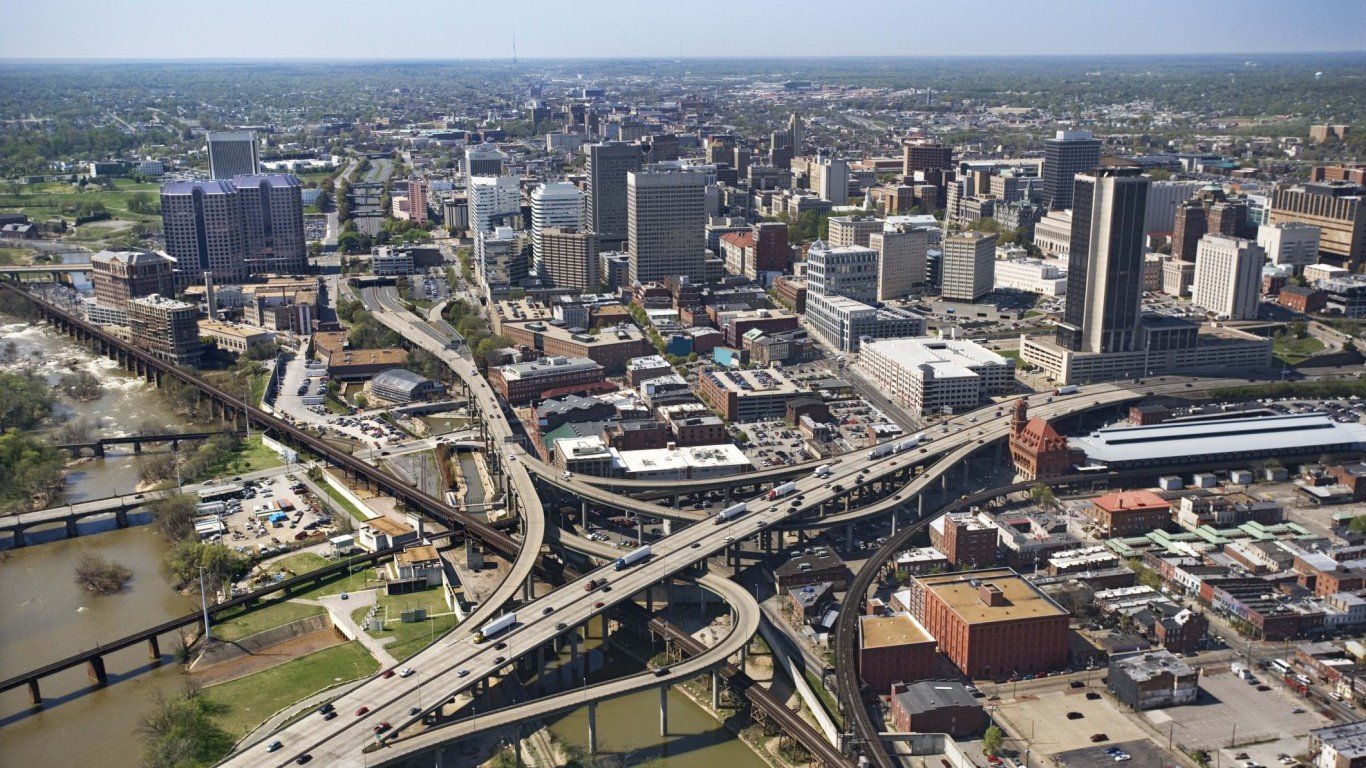
30. Virginia
> Underemployment rate: 8.6%
> June unemployment rate: 3.7% (tied –16th lowest)
> Average wage: $54,855 (9th highest)
> Labor force growth: 0.7% (21st smallest increase)
Like the U.S. as a whole, Virginia’s economy has largely recovered from the Great Recession.
The state’s current underemployment rate of 8.6% is far less than its 11.9% rate five years ago. One factor likely helping Virginia’s recovery from the recession may be the state’s highly educated labor force. An estimated 37.0% of adults in Virginia have a bachelor’s degree, the sixth largest share nationwide.
[in-text-ad]
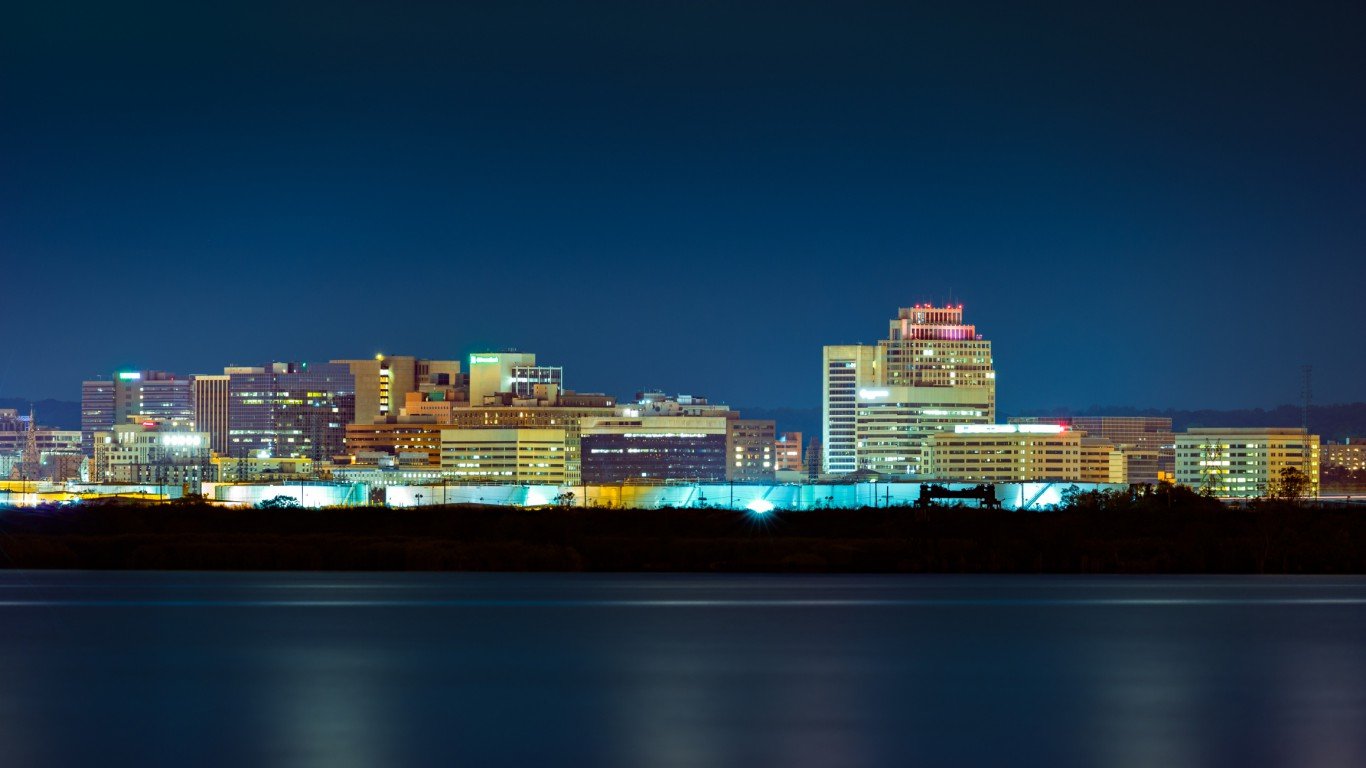
29. Delaware
> Underemployment rate: 8.8%
> June unemployment rate: 4.7% (tied — 11th highest)
> Average wage: $53,780 (13th highest)
> Labor force growth: 1.2% (18th largest increase)
At 4.7%, Delaware’s unemployment rate is above the 4.4% nationwide rate. Despite the higher unemployment rate, a slightly smaller than typical share of the state labor force are underemployed. Some 8.8% of workers in the state are working part-time when they would rather work full-time, are discouraged from finding work, or are unemployed — a slightly smaller share than the 9.5% U.S. underemployment rate.
Delaware’s economy expanded by 0.3% in 2016, much slower than the 1.5% GDP growth rate nationwide. At 1.7%, employment growth in Delaware matched the U.S. employment growth rate.
[recirclink id=403257]
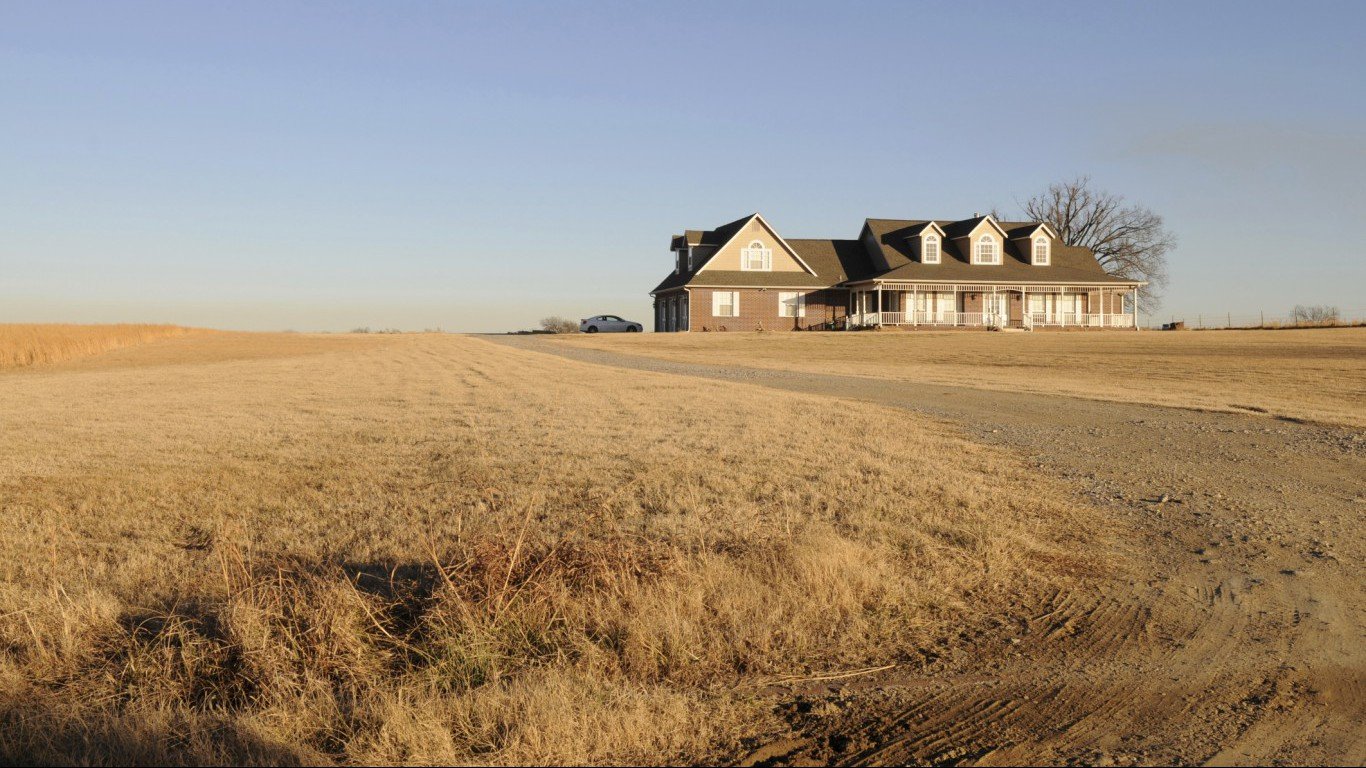
28. Oklahoma
> Underemployment rate: 8.8%
> June unemployment rate: 4.3% (tied — 20th highest)
> Average wage: $43,890 (11th lowest)
> Labor force growth: -0.3% (5th largest decline)
Both total employment and the labor force — which includes both active workers and those who are unemployed — fell in Oklahoma in 2016. The total labor force declined by 0.3%, while total employment fell by 0.8% — one of the steepest job declines of any state. The state’s GDP unsurprisingly also took a hit in 2016, contracting by 2.3% even as nationwide GDP expanded 1.5%.
Despite declines in a range of economic measures, only 8.8% of Oklahoma’s labor force is underemployed, a smaller share than the 9.5% of American workers.
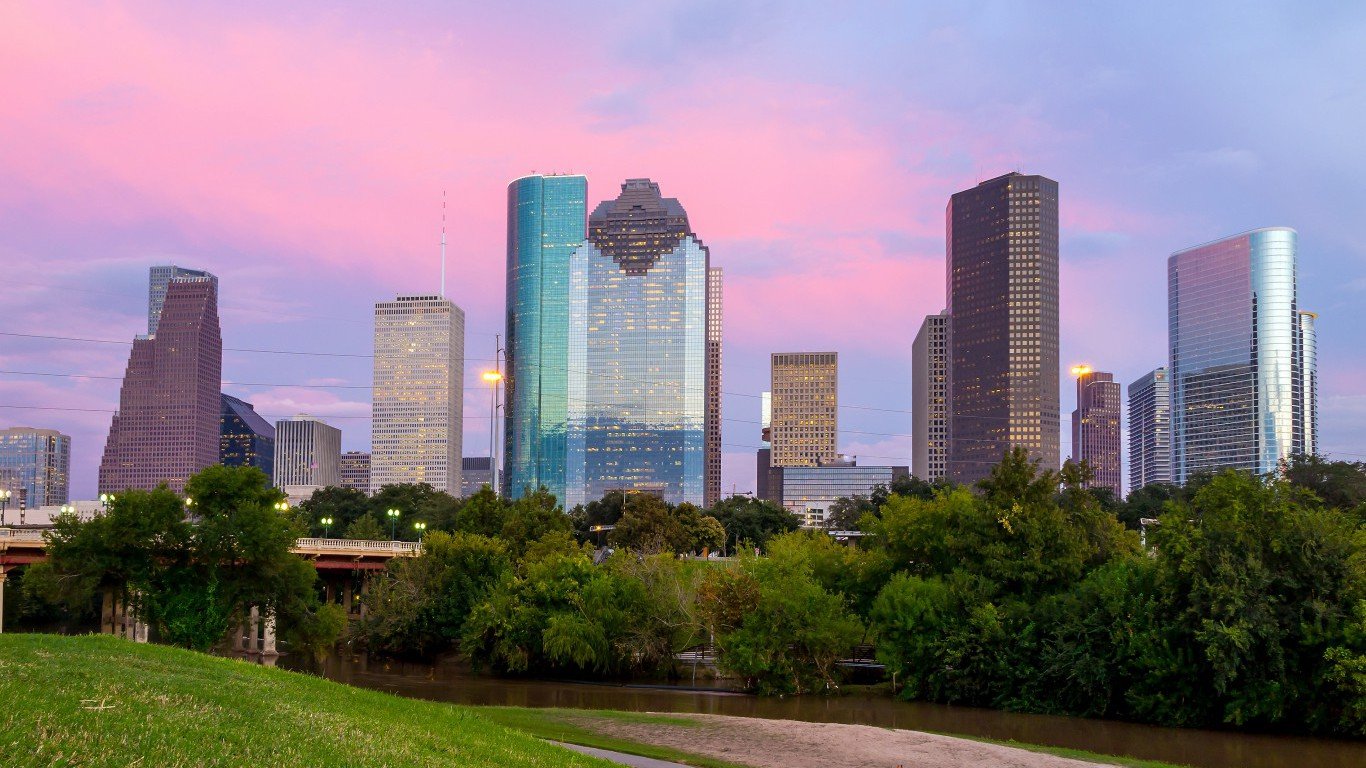
27. Texas
> Underemployment rate: 9.0%
> June unemployment rate: 4.6% (tied — 15th highest)
> Average wage: $54,302 (11th highest)
> Labor force growth: 1.8% (11th largest increase)
In Texas, 9.0% of the labor force is underemployed, less than the 9.5% national rate. One factor likely contributing to the state’s slightly better than average job market is steady employment growth. From 2011 to 2016, the number of jobs in Texas grew at an average of 2.5% a year, the seventh fastest job growth of any state. Like the United States as a whole, GDP growth in Texas in 2016 was led by the education and health services sector.
In recent years, falling oil prices have been a drag on the Texas economy. Roughly one-third of the nation’s mining and logging workers — which includes the oil extraction and refining industry — are employed in Texas. However, the sector detracted more from the state’s 2016 GDP growth than any other. The state’s underemployment rate rose from 8.3% a year ago to 9.0% today, one of the largest increases of any state.
[in-text-ad-2]
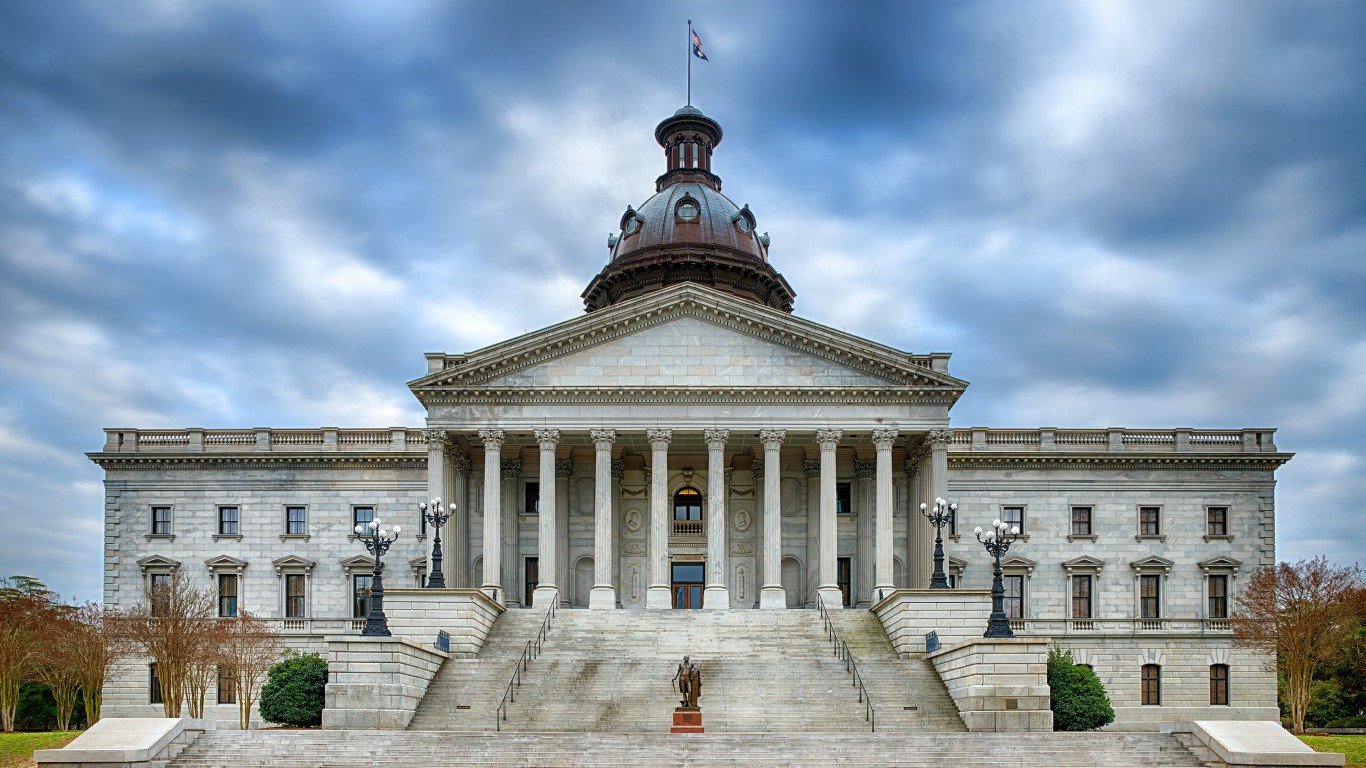
26. South Carolina
> Underemployment rate: 9.1%
> June unemployment rate: 4.0% (24th lowest)
> Average wage: $42,879 (9th lowest)
> Labor force growth: 1.2% (17th largest increase)
Some 9.1% of South Carolina’s labor force is either unemployed, marginally attached to the workforce, or have settled for working part-time jobs, lower than the 9.5% national rate. Over the past year, labor underutilization improved more in South Carolina than in any other state, falling 2.1 percentage points from 11.2% one year ago. It is currently lower than its pre-recessionary rate of 10.8% in 2006. The improvement coincides with strong economic growth in the state. South Carolina’s GDP increased 2.1% in 2016, far more than the 1.5% national rate. Growth was led by the state’s leisure and hospitality, construction, and education and health services sectors.

25. New York
> Underemployment rate: 9.2%
> June unemployment rate: 4.5% (tied — 18th highest)
> Average wage: $67,943 (the highest)
> Labor force growth: -0.1% (10th largest decline)
Some 9.2% of workers in New York are underemployed, a slightly smaller share than the 9.5% of workers nationwide. While underemployment is almost as common in New York as it is nationwide, many of those who are employed full-time in the state are well compensated. The average wage in the Empire State is nearly $68,000, the most of any state and about $14,300 more than the average wage nationwide. A far higher than typical 7.6% share of New York’s labor force works in finance, a relatively high-paying industry and economic pillar of New York City.
[in-text-ad]
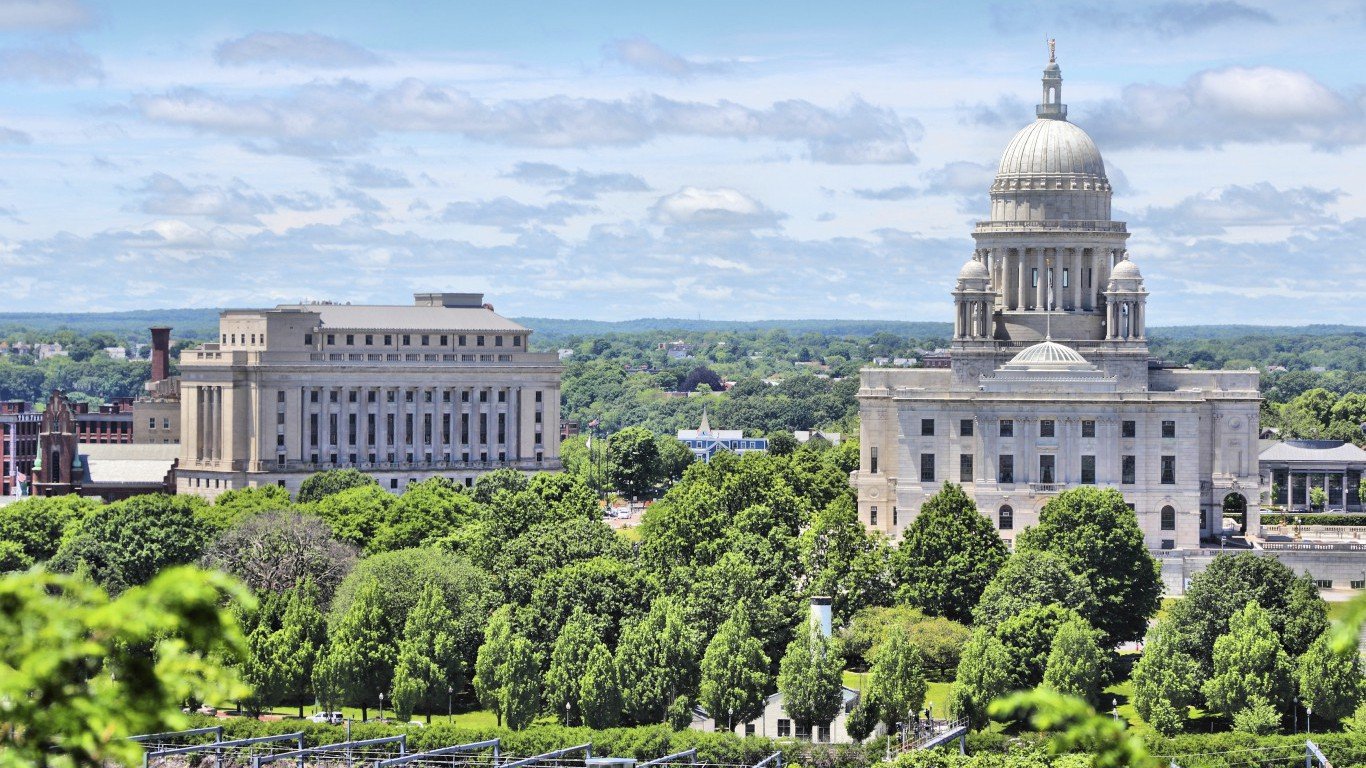
24. Rhode Island
> Underemployment rate: 9.2%
> June unemployment rate: 4.2% (tied — 22nd highest)
> Average wage: $51,446 (17th highest)
> Labor force growth: -0.3% (6th largest decline)
In Rhode Island, 9.2% of the labor force is underemployed, down considerably from the 11.0% share one year ago. The improvement was due to a drop in unemployment as well as in the share of discouraged and marginally attached workers, which fell from 1.1% to 0.8%.
Rhode Island’s relatively slow economic growth since the recession has likely contributed to the state’s slow employment growth, which at 1.1% from 2011 to 2016 was slower than the 1.9% nationwide growth. Despite this, unemployment declined considerably in the state. Rhode Island’s unemployment rate fell 0.7 percentage points to 5.3% in 2016, a greater improvement than the 0.4 percentage point decline nationwide.
[recirclink id=404324]
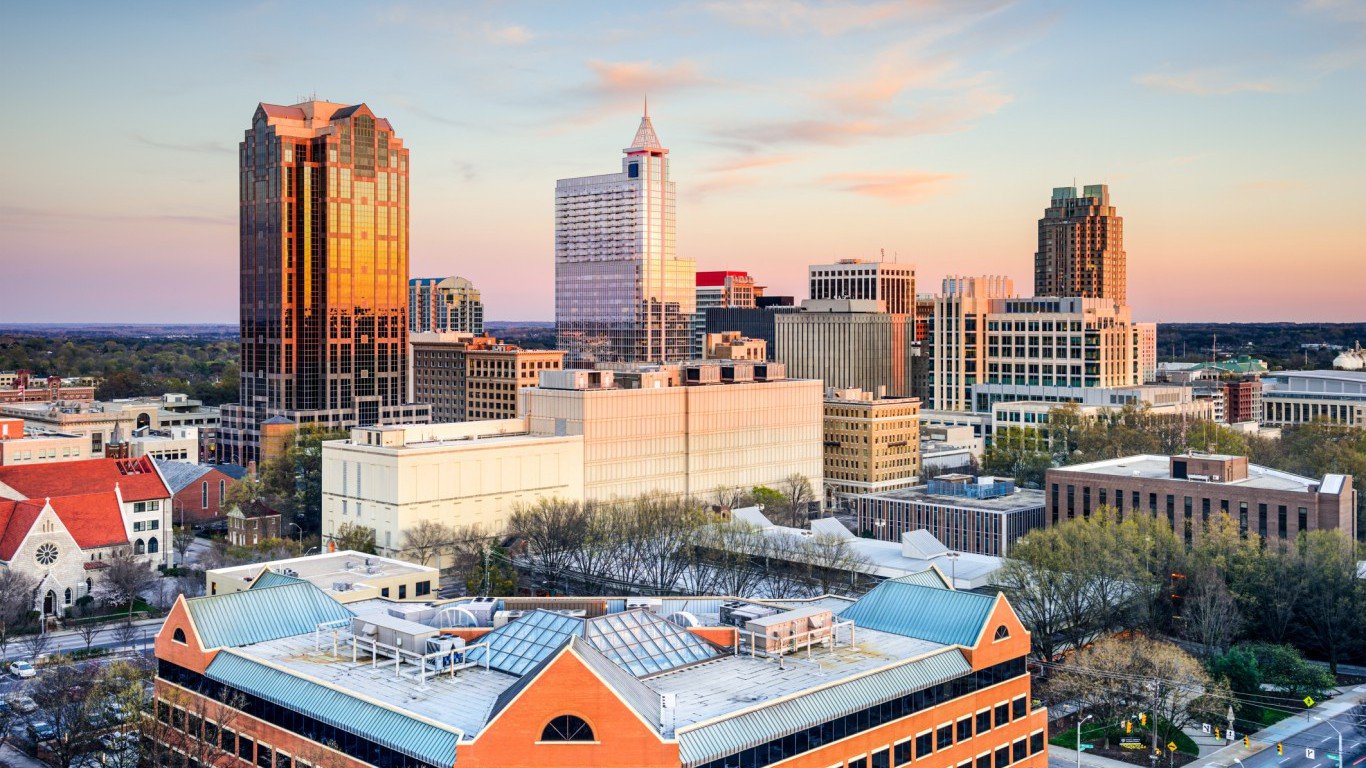
23. North Carolina
> Underemployment rate: 9.4%
> June unemployment rate: 4.2% (tied — 22nd highest)
> Average wage: $47,255 (25th lowest)
> Labor force growth: 2.3% (7th largest increase)
Since the recession, North Carolina active workforce has grown faster than most states. Employment in the state rose at an average annual rate of 2.1% between 2011 and 2016, faster than the 1.9% national figure. In 2016 alone, the number of employed workers in the state increased 3.0%, the fifth highest increase of any state.
Economic growth has also led to a decrease in labor underutilization. The share of underemployed workers is currently 9.4%, far less than the 11.0% share one year ago. While unemployment fell substantially over the past year, the share of failed job-seekers who had recently given up their search for employment remained at 1.2% of the labor force.
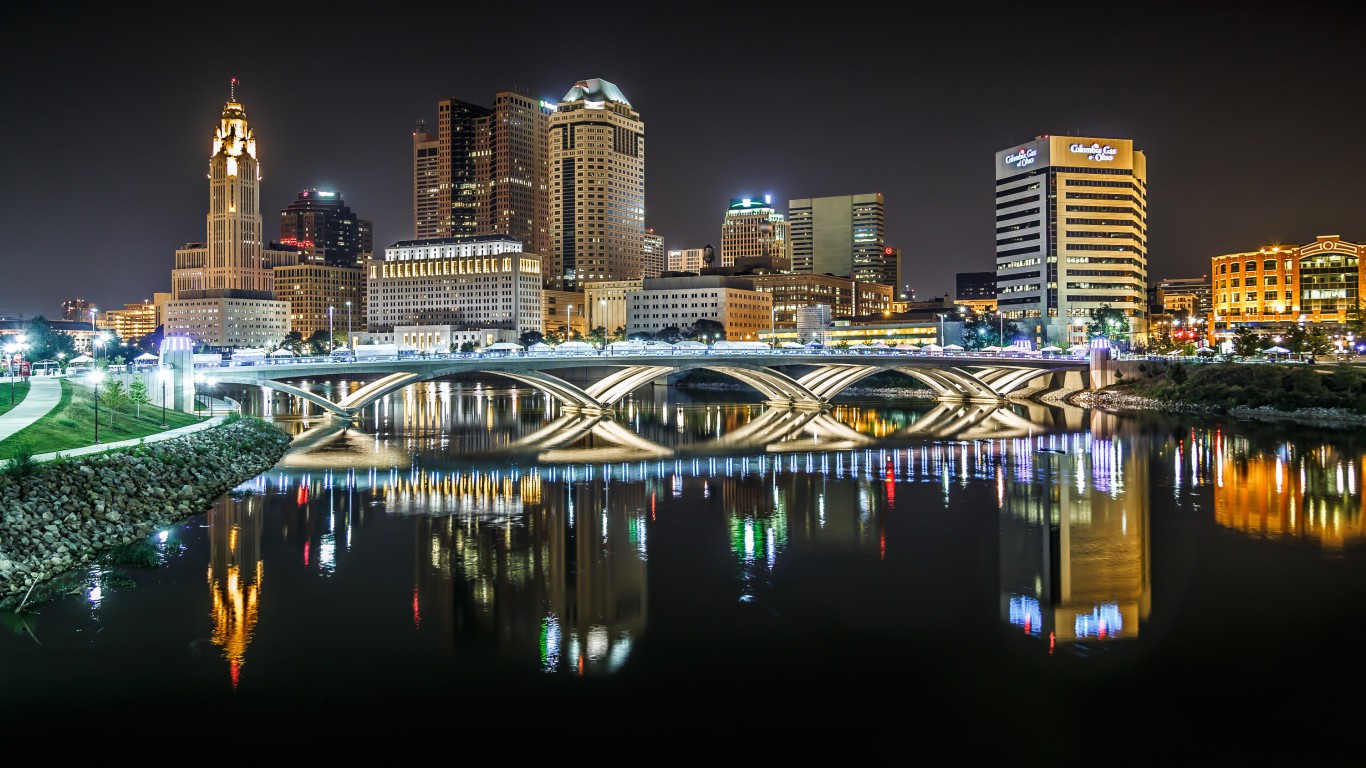
22. Ohio
> Underemployment rate: 9.5%
> June unemployment rate: 5.0% (tied — 6th highest)
> Average wage: $47,586 (24th highest)
> Labor force growth: 0.4% (16th smallest increase)
Some 9.5% of the Ohio labor force are underemployed, in line with the comparable share nationwide. The state’s labor underutilization is an improvement from one year ago, when 9.8% of the Ohio labor force were underemployed. While unemployment actually rose slightly from 4.8% to 5.0%, the share of workers who had withdrawn from the labor force fell substantially from 1.4% to 0.9% — accounting for the entirety of the decrease in the state’s labor underutilization rate. The number of employed workers in Ohio rose 0.3% in 2016, a fraction of the 1.7% increase nationwide.
[in-text-ad-2]
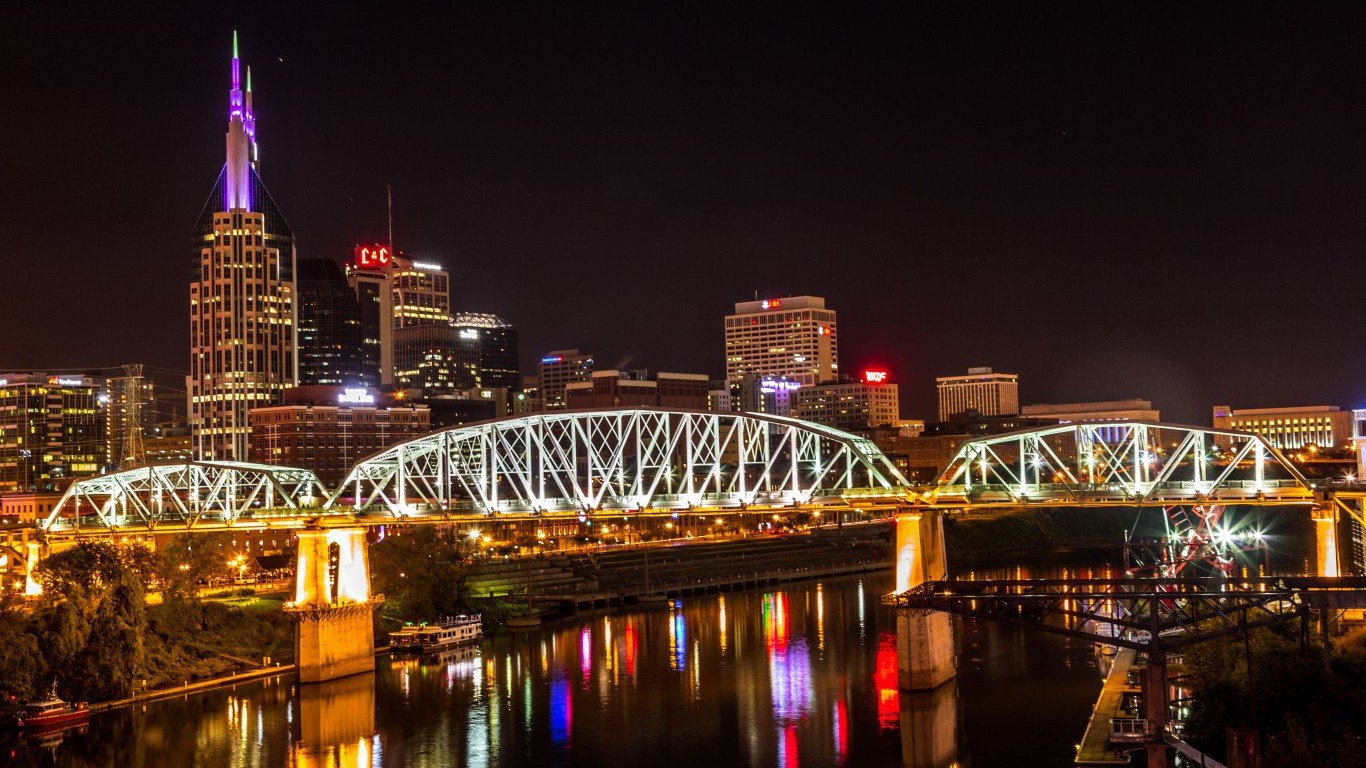
21. Tennessee
> Underemployment rate: 9.5%
> June unemployment rate: 3.6% (15th lowest)
> Average wage: $47,396 (25th highest)
> Labor force growth: 2.1% (9th largest increase)
Like many southeastern states, Tennessee has had rapid job growth since the recession. The number of employed workers in the state grew at an average annual rate of 2.1% between 2011 and 2016, slightly higher than the 1.9% national rate. In 2016 alone, employment in Tennessee rose 2.9%, the seventh most of any state. The professional and business services and leisure and hospitality sectors led economic growth for the year. The only sector with negative GDP growth in the state was mining and logging, which expanded in just three states. Economic growth has helped decrease labor underutilization in the state. Today, 9.5% of Tennessee’s labor force is unemployed or underemployed, an improvement from 10.2% one year ago.
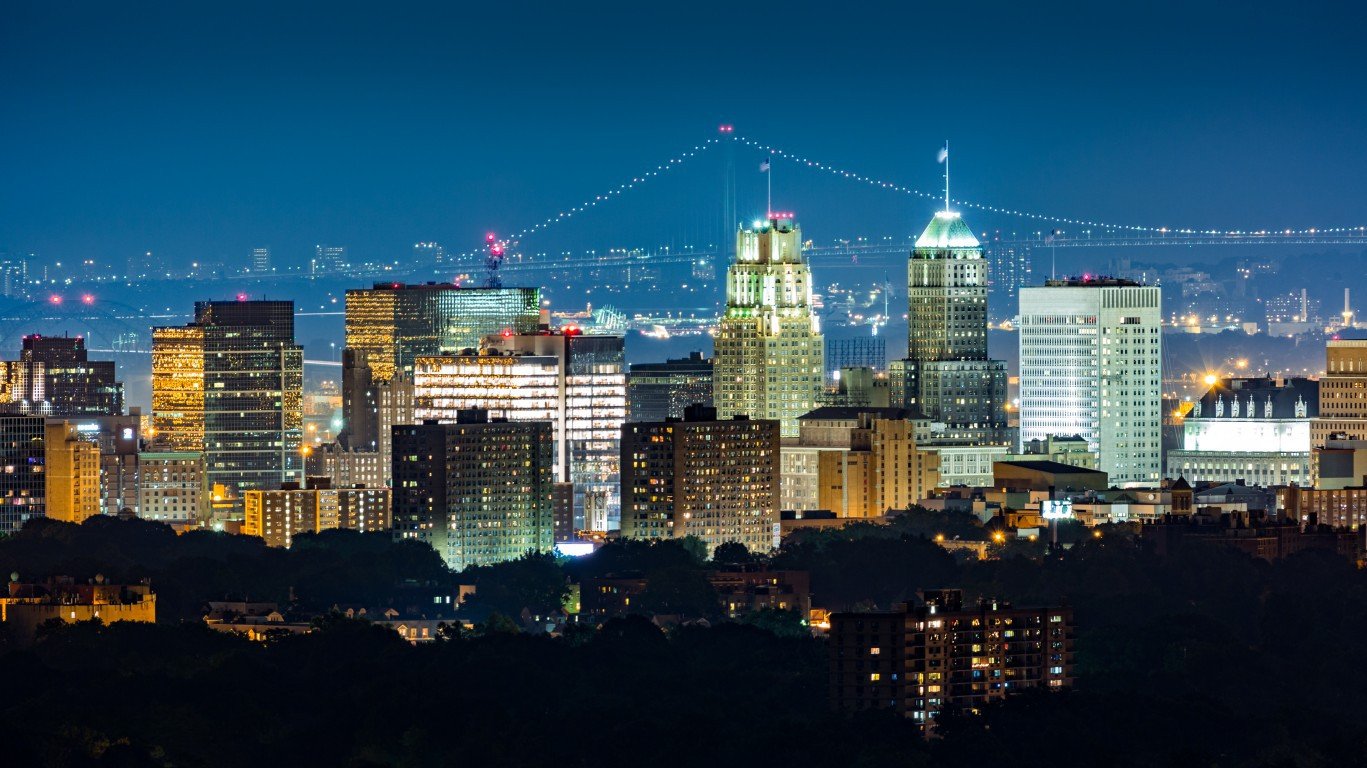
20. New Jersey
> Underemployment rate: 9.7%
> June unemployment rate: 4.1% (tied — 24th highest)
> Average wage: $62,772 (5th highest)
> Labor force growth: -0.1% (8th largest decline)
New Jersey is one of the only states where labor underutilization has increased over the past year. Currently, 9.7% of the state’s labor force are underemployed, up from 9.5% one year ago. The state’s underemployment rate rose above the national figure, which fell from 10.1% to 9.5% over the same period.
Job growth in New Jersey has largely trailed the nation since the recession. The number of employed workers in the state rose at an average annual rate of 1.1% from 2011 to 2016, slower than the 1.9% national pace. Despite the sluggish growth, New Jersey’s 4.1% unemployment rate is currently at a 16-year low.
[in-text-ad]
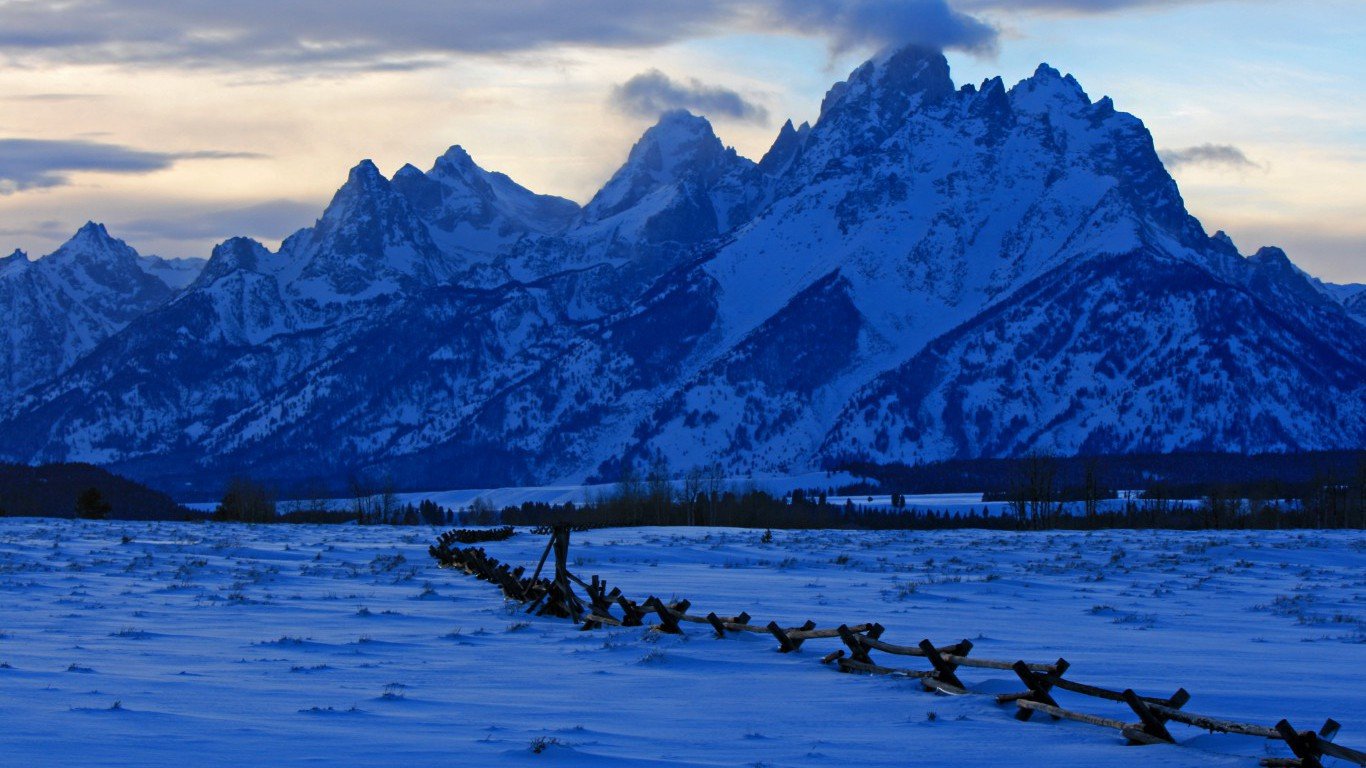
19. Wyoming
> Underemployment rate: 9.7%
> June unemployment rate: 3.9% (tied –22nd lowest)
> Average wage: $44,974 (17th lowest)
> Labor force growth: -0.9% (2nd largest decline)
Some 9.7% of Wyoming’s labor force are currently underemployed, a substantial increase from the 8.5% share one year ago. This increase in underemployment coincides with a 2% decline in total employment, the largest decline of any state. Job loss in Wyoming is likely due to the state’s shrinking mining sector. Some 6.7% of workers in the state are employed in mining and logging, the largest share in the country. As the price of oil fell in 2014 and has remained low, many states with large mining and logging sectors have experienced sluggish economic growth and persistent unemployment.
[recirclink id=403221]
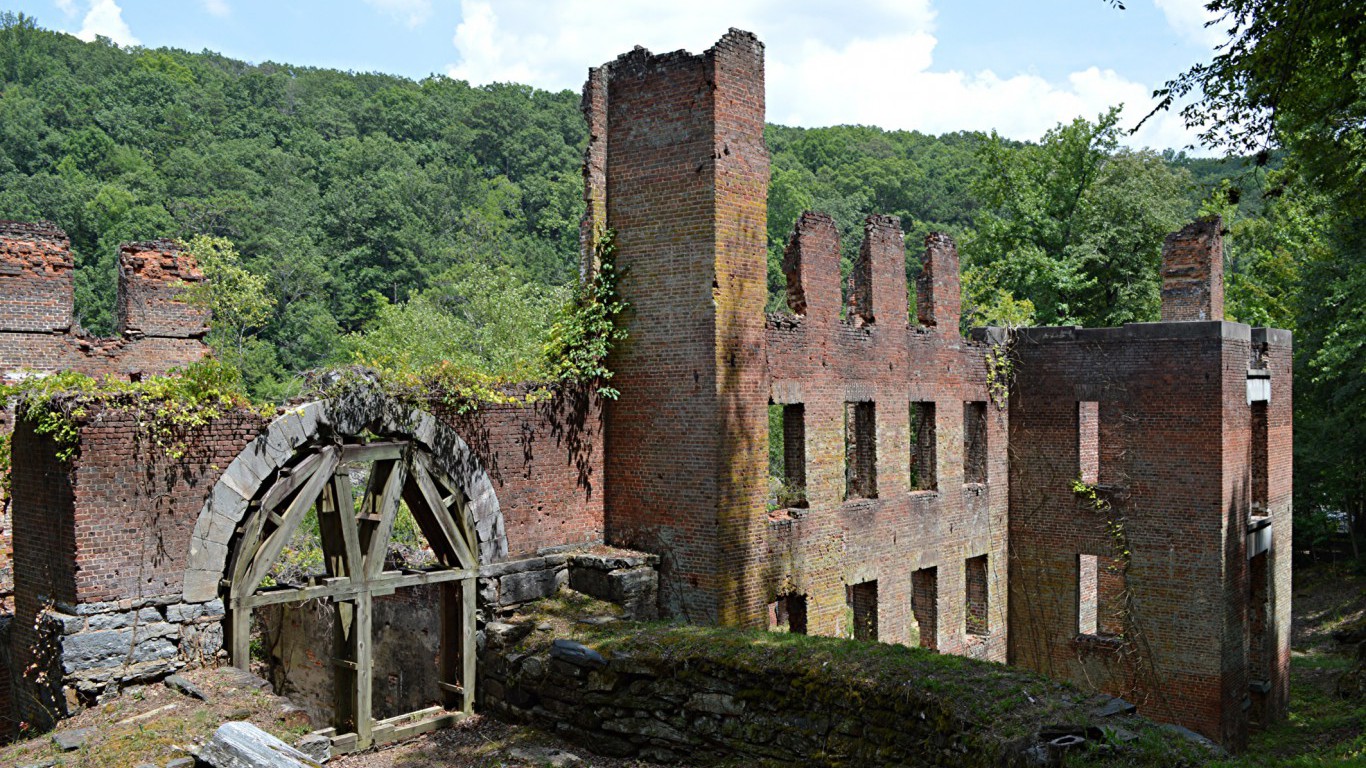
18. Georgia
> Underemployment rate: 9.8%
> June unemployment rate: 4.8% (10th highest)
> Average wage: $50,698 (19th highest)
> Labor force growth: 2.8% (3rd largest increase)
The share of the Georgia labor force underemployed is currently 9.8%, a considerable improvement from 11.2% one year ago. Despite the decrease in labor underutilization, the state’s underemployment rate remains higher than the 9.5% national rate.
The improvement is largely due to the state’s strong post-recession job growth. The number of employed workers in the state rose at an average annual rate of 2.4% between 2011 and 2016, faster than the 1.9% national rate. In 2016 alone, employment in Georgia increased by 3.4%, more than in any state other than Oregon. Like much of the Southeast, Georgia’s economic growth is likely due in part to the massive wave of inbound migration and overall population growth.
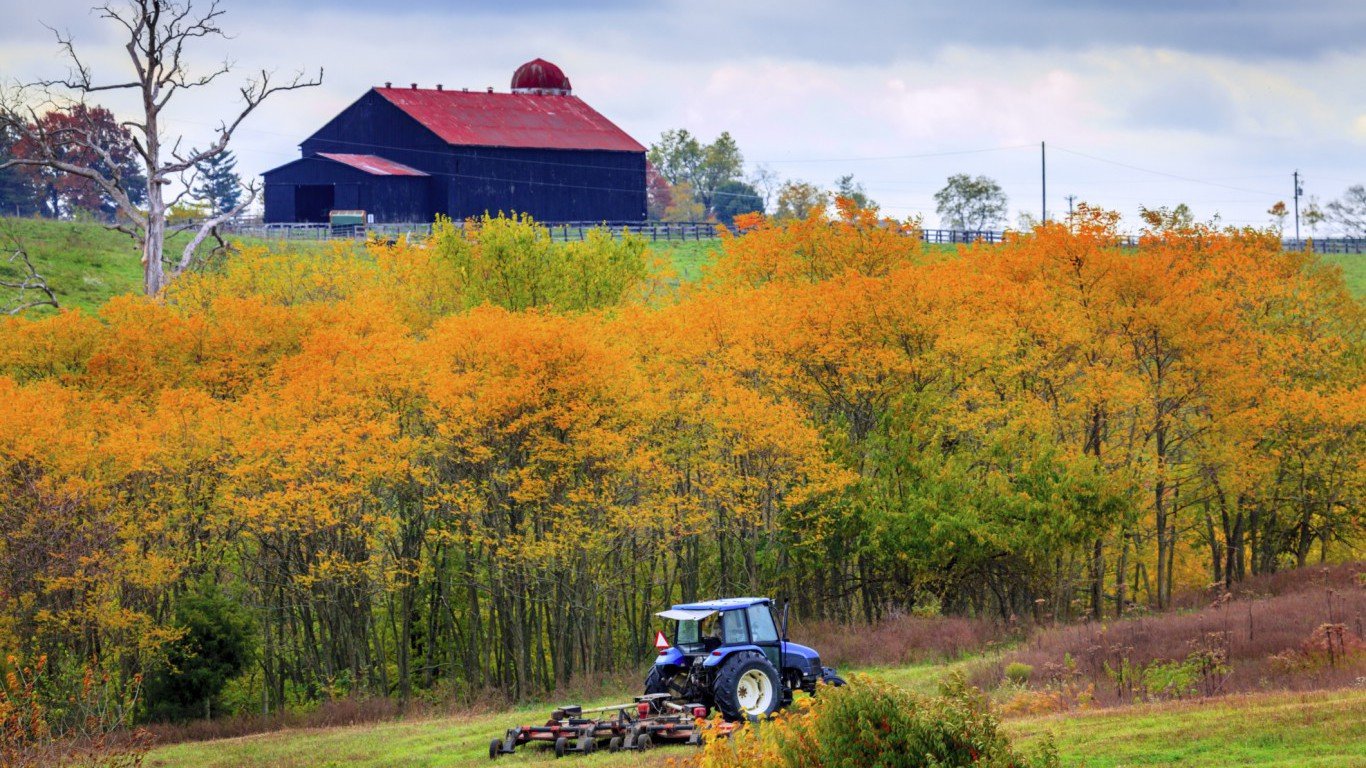
17. Kentucky
> Underemployment rate: 9.8%
> June unemployment rate: 5.1% (tied — 4th highest)
> Average wage: $44,089 (12th lowest)
> Labor force growth: 1.3% (15th largest increase)
Some 9.8% of Kentucky’s labor force is underemployed, a small decline from the 10.5% share one year ago. While the decrease in labor underutilization was due to a decline in the state’s jobless rate, the BLS estimates that 5.1% of workers remain unemployed, tied with Arizona as the fourth highest jobless rate in the country.
Employment in the state increased at an average annual rate of 1.4% between 2011 and 2016, slightly less than the 1.9% national rate. One factor slowing economic growth in Kentucky may be related to educational attainment in the state’s workforce. Just 23.3% of state adults have a bachelor’s degree, a considerably smaller share compared to the 30.6% national rate.
[in-text-ad-2]
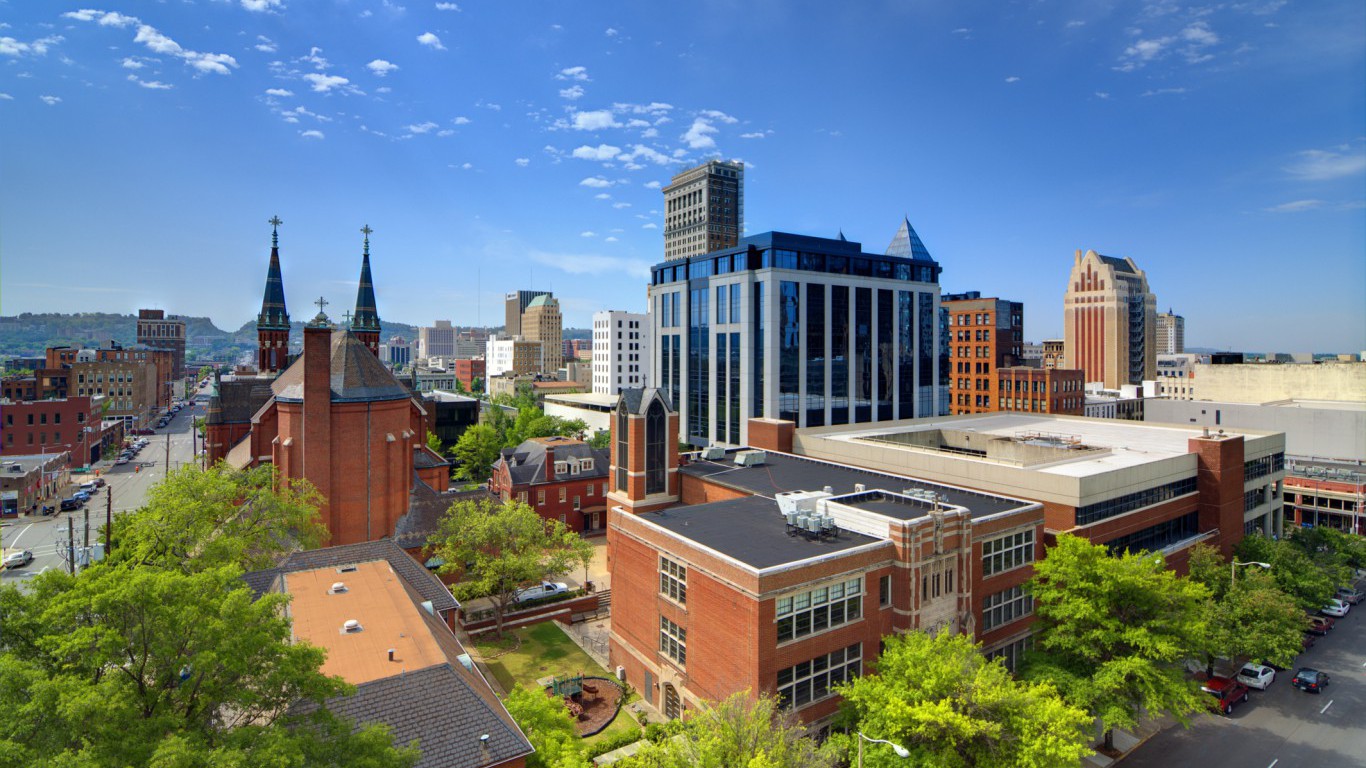
16. Alabama
> Underemployment rate: 9.9%
> June unemployment rate: 4.6% (tied — 15th highest)
> Average wage: $44,824 (15th lowest)
> Labor force growth: 0.8% (24th smallest increase)
Job growth in Alabama has been relatively slow since the recession. Employment in the state grew at an average rate of 1.1% a year between 2011 and 2016, slower than the 1.9% national rate. While the share of the labor force that is underemployed fell from 10.9% to 9.9% over the past year, it remains higher than the 9.5% U.S. share.
Jobless individuals comprise the largest share of the state’s underemployed residents. Alabama’s 6.0% 2016 unemployment rate is the fourth highest of any state.
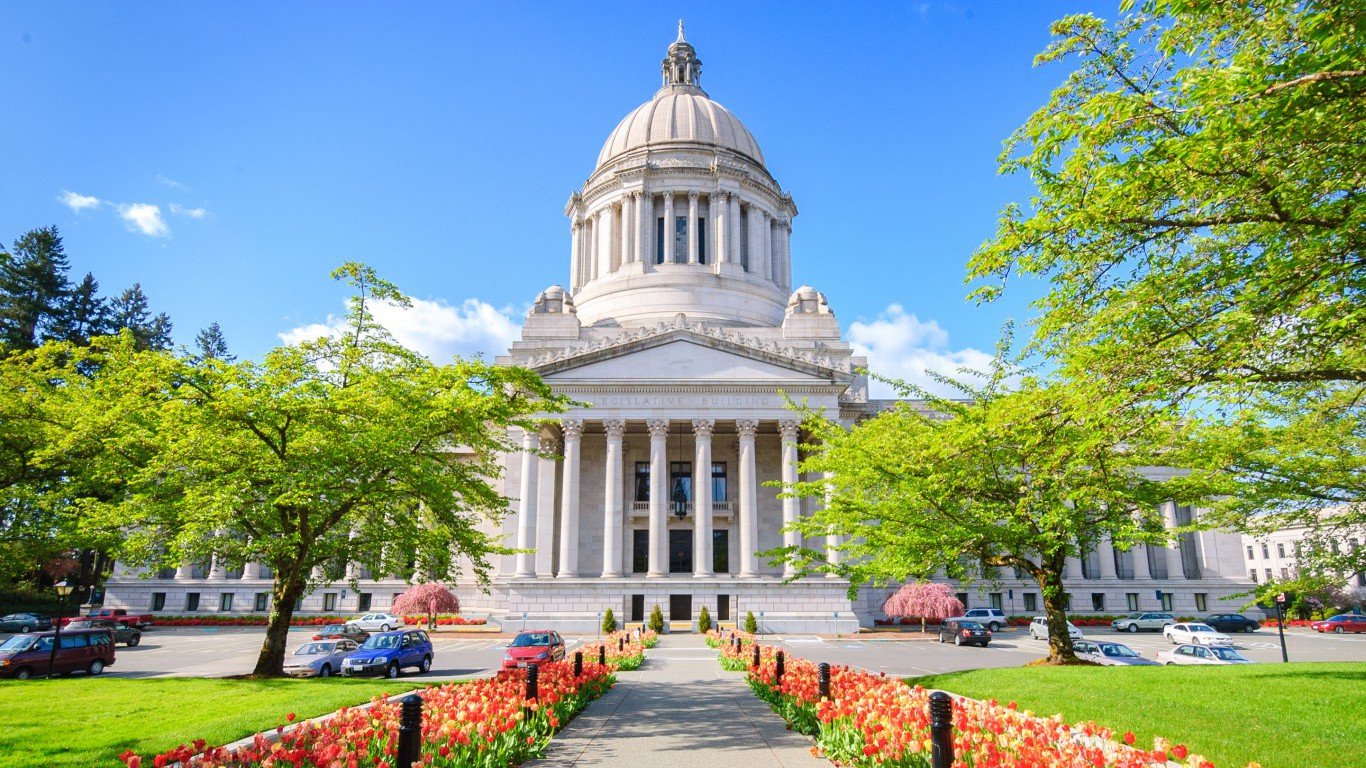
15. Washington
> Underemployment rate: 10.0%
> June unemployment rate: 4.5% (tied — 18th highest)
> Average wage: $59,026 (6th highest)
> Labor force growth: 2.8% (4th largest increase)
While Washington state’s 4.5% unemployment rate is nearly in line with the 4.4% national rate, the state’s 10.0% underemployment rate is substantially higher than the 9.5% national figure. The discrepancy is partially due to the 1.2% of the labor force that recently gave up looking for full-time employment, one of the larger shares of any state.
Despite Washington’s high labor underutilization, the state has experienced strong economic growth in recent years. Washington’s GDP grew 3.7% in 2016, the most of any state. Employment in the state also increased at a fast pace, clocking an average annual growth rate of 2.5% between 2011 and 2016, the ninth most of any state.
[in-text-ad]

14. Michigan
> Underemployment rate: 10.0%
> June unemployment rate: 3.8% (tied –20th lowest)
> Average wage: $50,944 (18th highest)
> Labor force growth: 1.7% (13th largest increase)
Some 10.0% of Michigan’s labor force are underemployed, down from 11.2% one year ago. The decrease in labor underutilization is due to drops in both the unemployment rate and the share of marginally attached workers. The state’s job market has largely recovered from the recession, and its underemployment rate is far lower than its pre-recessionary level of 12.2% in 2006.
The improvement is likely due to Michigan’s above average economic growth in recent years. The state’s GDP rose 1.8% in 2016, faster than the 1.5% national rate. Like the country as a whole, growth in Michigan was led by the education and health services, professional and business services, and leisure and hospitality sectors.
[recirclink id=404324]
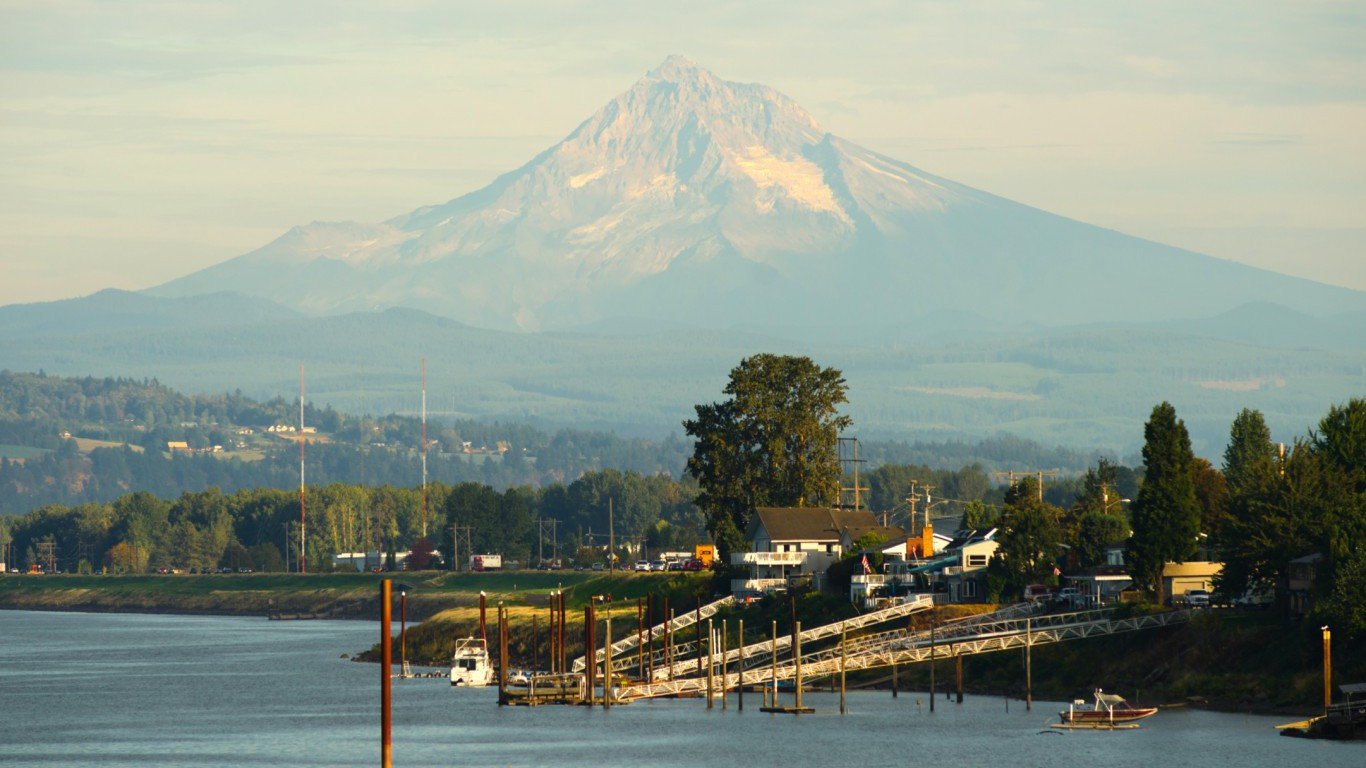
13. Oregon
> Underemployment rate: 10.0%
> June unemployment rate: 3.7% (tied –16th lowest)
> Average wage: $49,463 (20th highest)
> Labor force growth: 3.9% (the largest increase)
In Oregon, 10.0% of the labor force are either unemployed, marginally attached to the workforce, or have settled for a part-time job after failing to find full-time employment. While labor underutilization is high in Oregon, the current underemployment rate is a slight improvement from the 11.2% rate one year ago. The increase in labor utilization may be partially due to the rapid economic growth throughout the state. In 2016, Oregon’s GDP rose 3.3%, the second fastest growth among states. Oregon has also had nation-leading job growth in recent years. The number of employed workers in Oregon increased 4.7% in 2016, more than in any other state and more than double the 1.7% national rate.
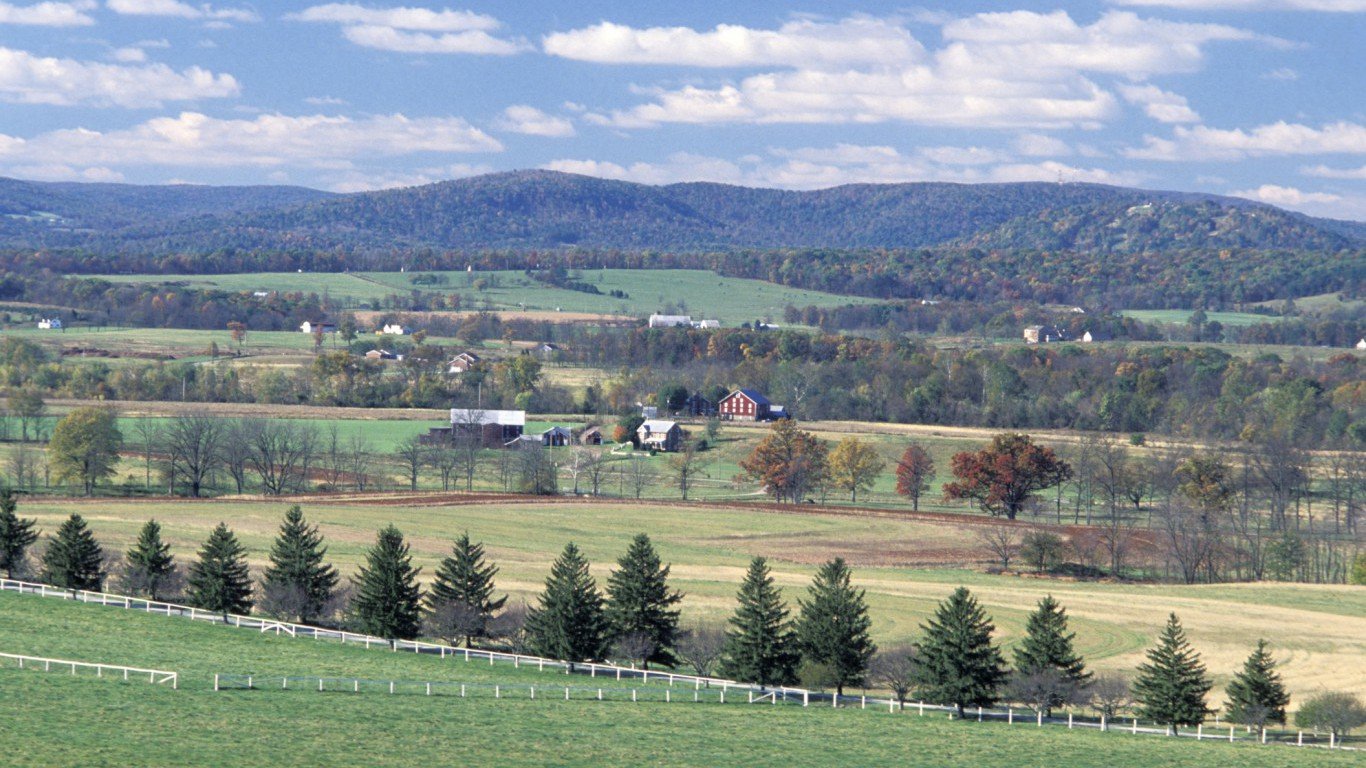
12. Pennsylvania
> Underemployment rate: 10.1%
> June unemployment rate: 5.0% (tied — 6th highest)
> Average wage: $52,462 (16th highest)
> Labor force growth: 0.7% (23rd smallest increase)
Some 10.1% of the Pennsylvania labor force is currently unemployed or underemployed, higher than the 9.5% national rate. Labor underutilization in the state is only slightly improved from one year ago, when 10.7% of the workforce was unemployed or underemployed. Labor underutilization has also yet to improve from the pre-recessionary level of 8.0% in 2006. Pennsylvania’s current unemployment rate of 5.0% is tied as sixth highest in the country. The slow recovery of the Pennsylvania job market is likely due to sluggish economic and population growth in the state. Pennsylvania’s GDP grew just 1.1% in 2016, less than the 1.5% national rate. Between 2011 and 2016, employment in Pennsylvania grew at an average rate of just 0.7% a year, the seventh slowest of any state.
[in-text-ad-2]
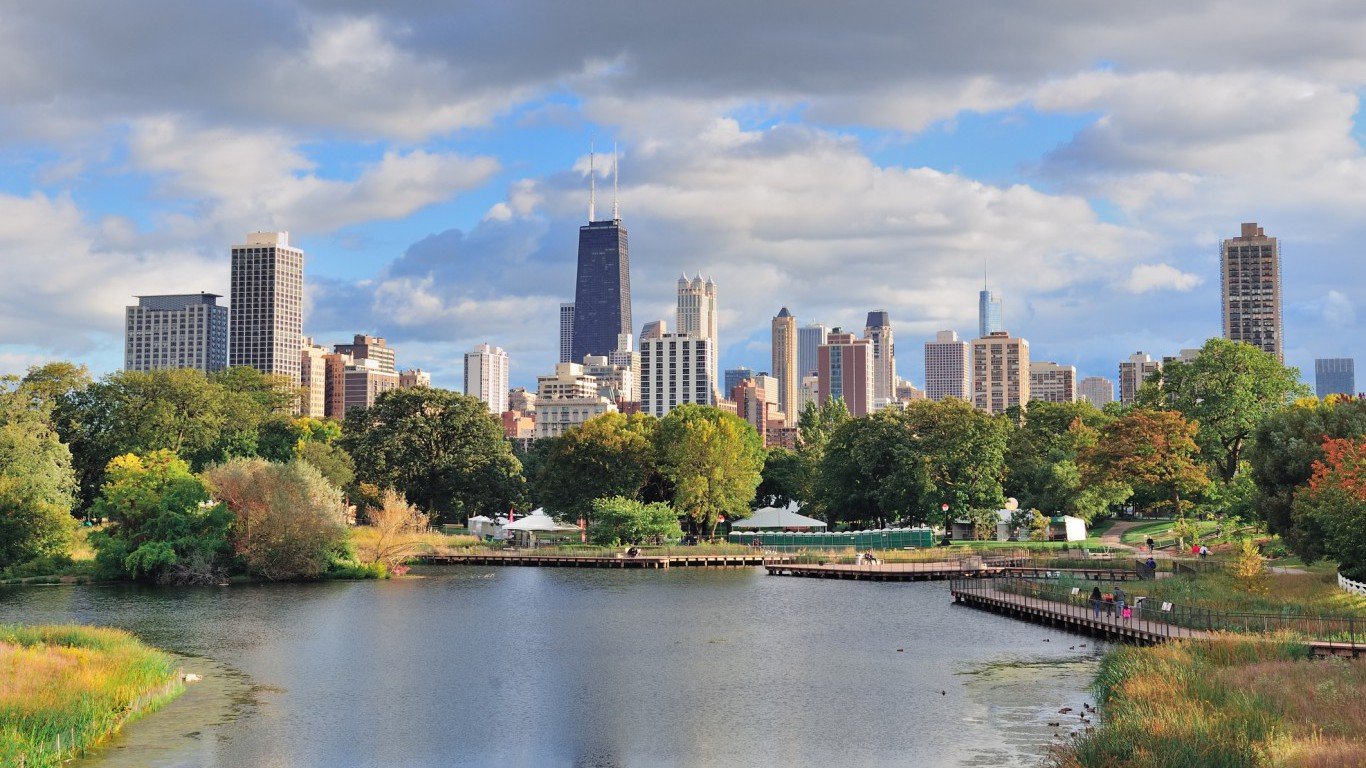
11. Illinois
> Underemployment rate: 10.3%
> June unemployment rate: 4.7% (tied — 11th highest)
> Average wage: $56,453 (8th highest)
> Labor force growth: 0.5% (20th smallest increase)
Illinois is one of many Midwestern states where sluggish post-economic growth is hurting labor utilization and preventing the job market to return to its pre-recessionary status. Some 10.3% of the Illinois workforce is currently unemployed or underemployed, a slight improvement from the 11.0% share one year ago yet far higher than the pre-recessionary levels of 8.1% in 2006 and 7.8% in 2007. The state’s GDP rose just 0.9% in 2016, slightly more than half the 1.5% national rate. While the wholesale trade sector contributed to GDP growth nationwide, the sector detracted from economic growth in Illinois. An estimated 5.0% of workers in Illinois are employed in wholesale trade, the fourth largest share of any state.
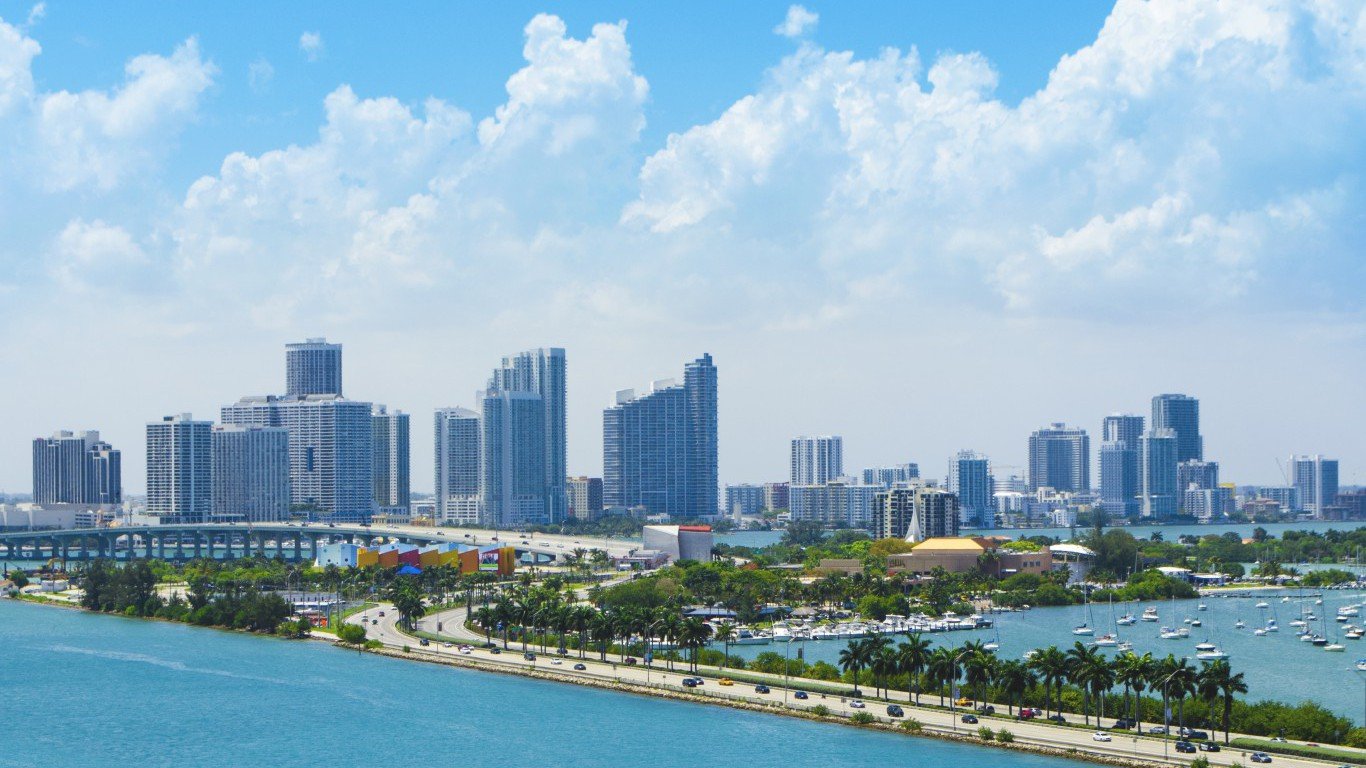
10. Florida
> Underemployment rate: 10.3%
> June unemployment rate: 4.1% (tied — 24th highest)
> Average wage: $47,024 (23rd lowest)
> Labor force growth: 2.3% (6th largest increase)
In Florida, 10.3% of the workforce are underemployed, more than the 9.5% national rate. Labor utilization in Florida has somewhat improved from one year ago, when 11.0% of the workforce were underemployed.
A large share of the state’s labor force remains underemployed despite substantial economic growth in the state in recent years. Florida’s GDP rose 3.0% in 2016, double the 1.5% national rate and more than any state other than Oregon and Washington.
[in-text-ad]
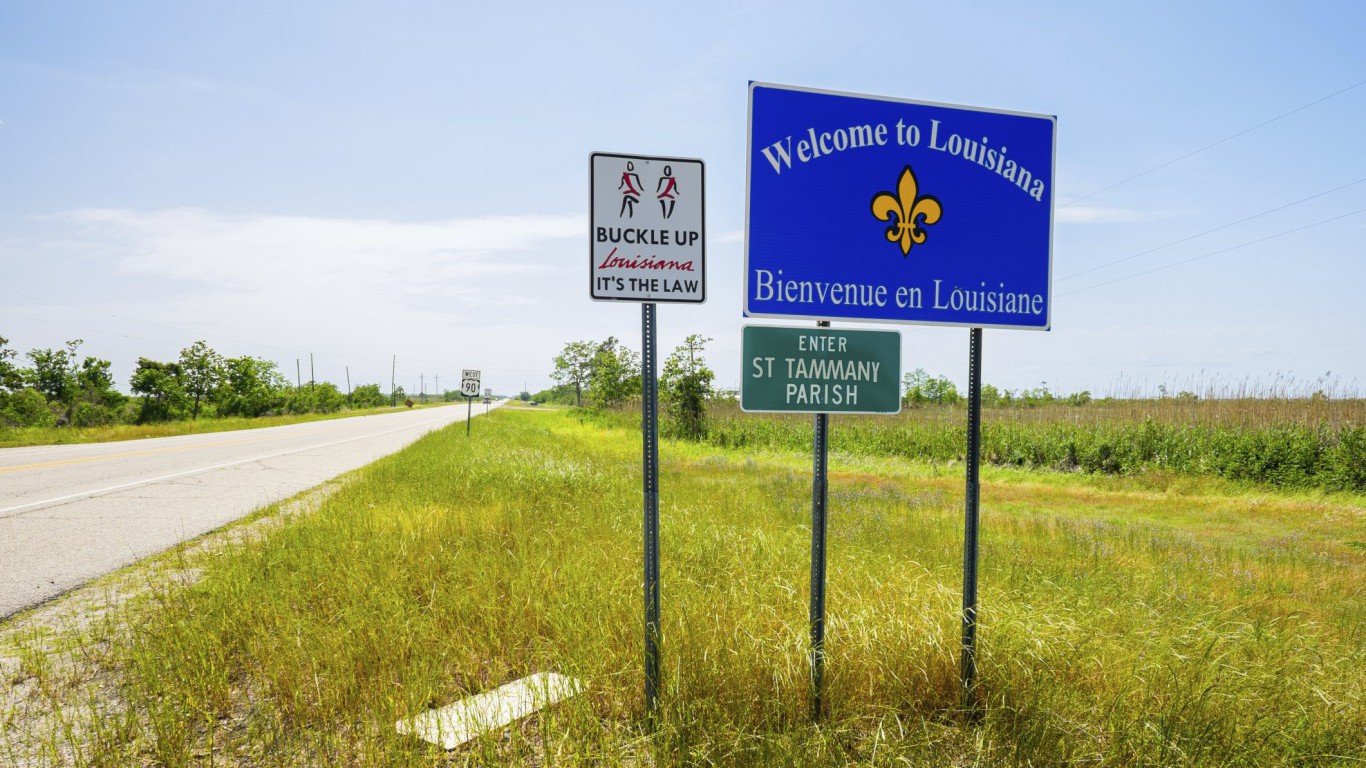
9. Louisiana
> Underemployment rate: 10.5%
> June unemployment rate: 5.5% (3rd highest)
> Average wage: $45,624 (20th lowest)
> Labor force growth: -1.8% (the largest decline)
Louisiana is one of many oil-producing states where economic growth has been hindered by the global drop in oil prices. Louisiana has 18 operating petroleum refineries, the most of any state other than Texas, and 1.9% of workers in the state are employed in mining and logging — the seventh largest share nationwide. In 2016, the mining and logging sector detracted more from the state’s GDP growth than any other sector, and led to negative economic growth overall. Louisiana’s GDP shrank by 1.2% in 2016, the fifth largest contraction of any state. Sluggish economic activity has hurt labor utilization in the state. Today, 10.5% of the Louisiana labor force is unemployed or underemployed, far higher than the 9.5% national rate and just a slight improvement from the 10.8% share one year ago.
[recirclink id=403358]
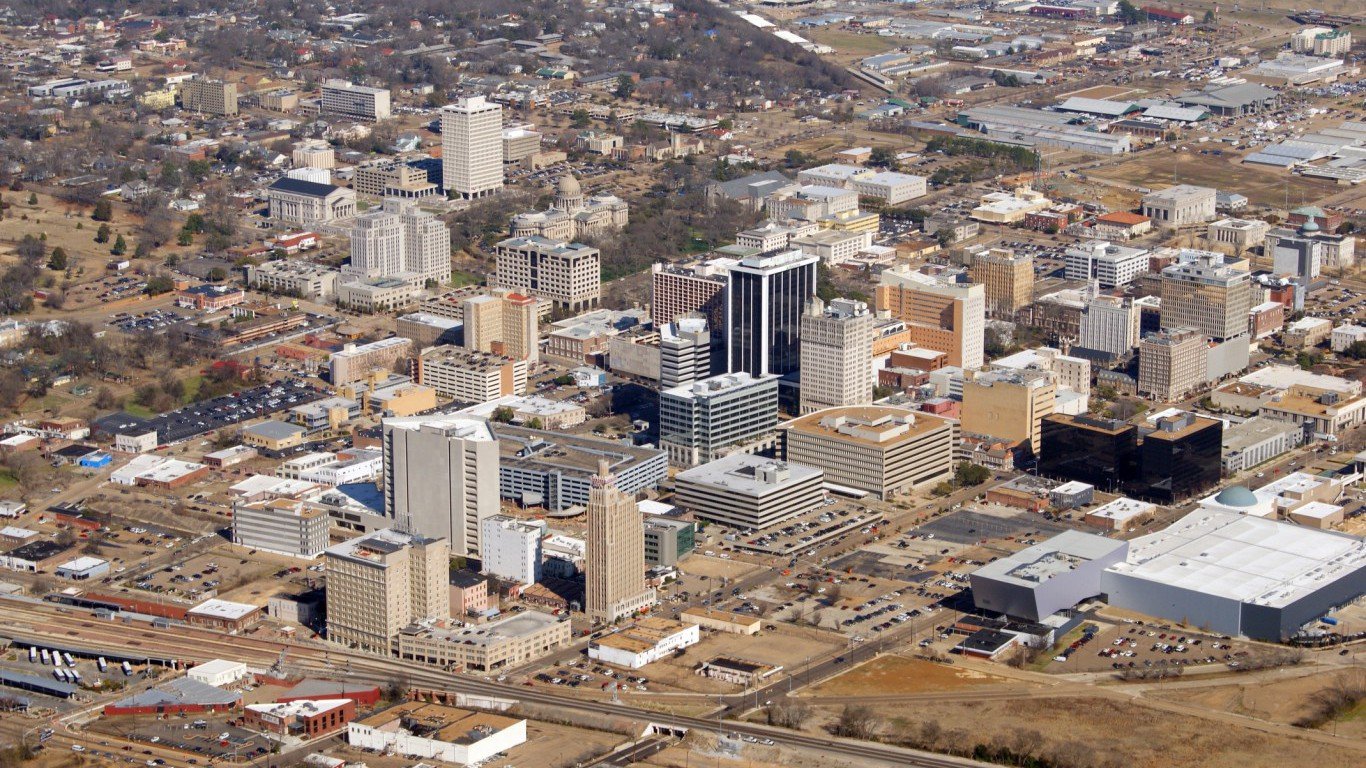
8. Mississippi
> Underemployment rate: 10.5%
> June unemployment rate: 5.0% (tied — 6th highest)
> Average wage: $38,145 (the lowest)
> Labor force growth: 0.8% (23rd largest increase)
With a 10.5% underemployment rate, labor underutilization is fairly high in Mississippi. Still, it is a marked improvement from the 2015 underemployment rate of 11.6%, and rapidly approaching the state’s pre-recessionary level of 10.2% in 2006.
One reason for Mississippi’s higher than average underemployment may be the state’s shallow talent pool, which can limit the number of businesses that choose to relocate or establish operations in the state — and limit job opportunities for Mississippi residents overall. Just 20.8% of Mississippi adults have a bachelor’s degree, the smallest share of any state other than West Virginia.
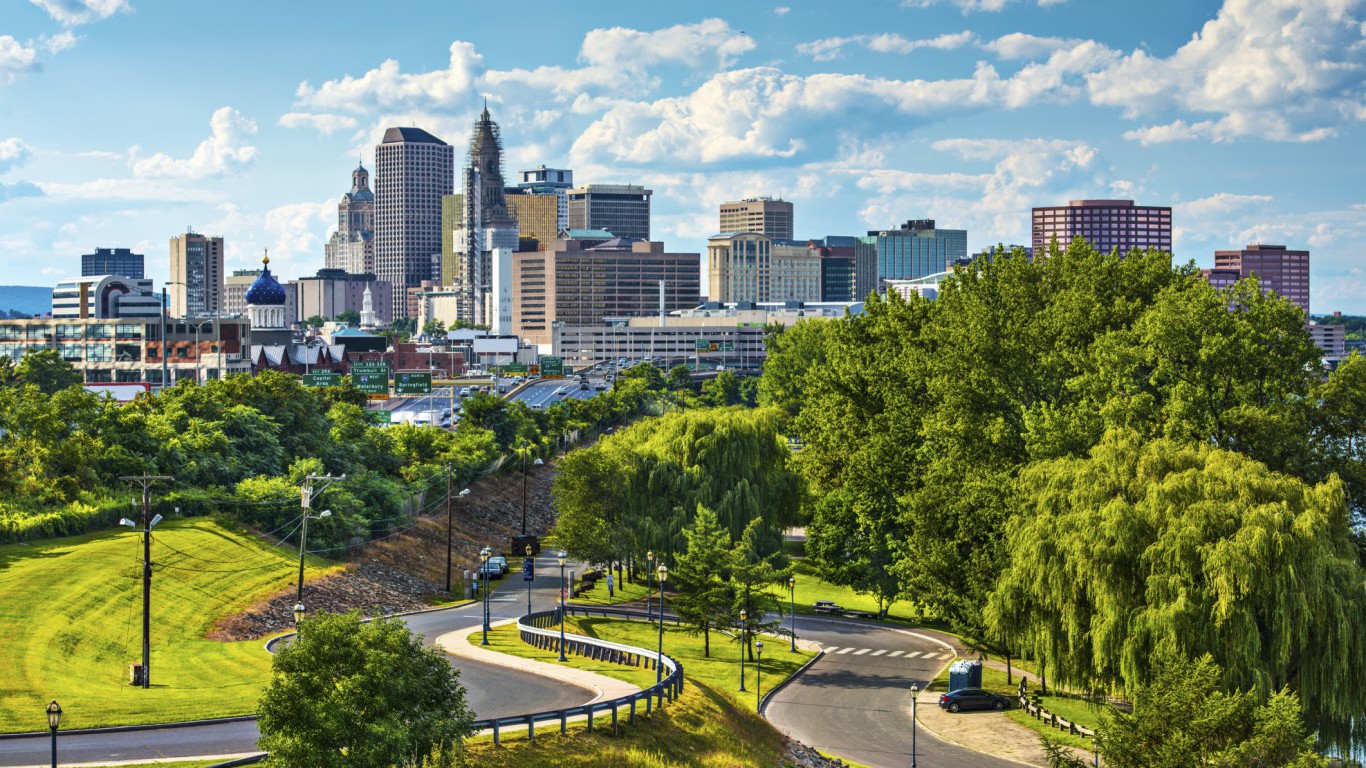
7. Connecticut
> Underemployment rate: 10.6%
> June unemployment rate: 5.0% (tied — 6th highest)
> Average wage: $65,875 (3rd highest)
> Labor force growth: 0.1% (12th smallest increase)
Connecticut is currently struggling with several major problems that are stymieing overall economic growth in the state. The state is deep in debt, has a substantially underfunded pension system, and has suffered from population loss — especially of working adults — for a number of years. Connecticut’s GDP grew just 1% in 2016, below the 1.5% national growth rate. The biggest drag on GDP growth was the state’s government sector, which has implemented several rounds of layoffs and spending cuts in recent years.
Sluggish GDP growth has coincided with high labor underutilization in the state. Some 10.6% of Connecticut’s labor force is currently unemployed or underemployed, a slight improvement from the 10.7% share one year ago.
[in-text-ad-2]
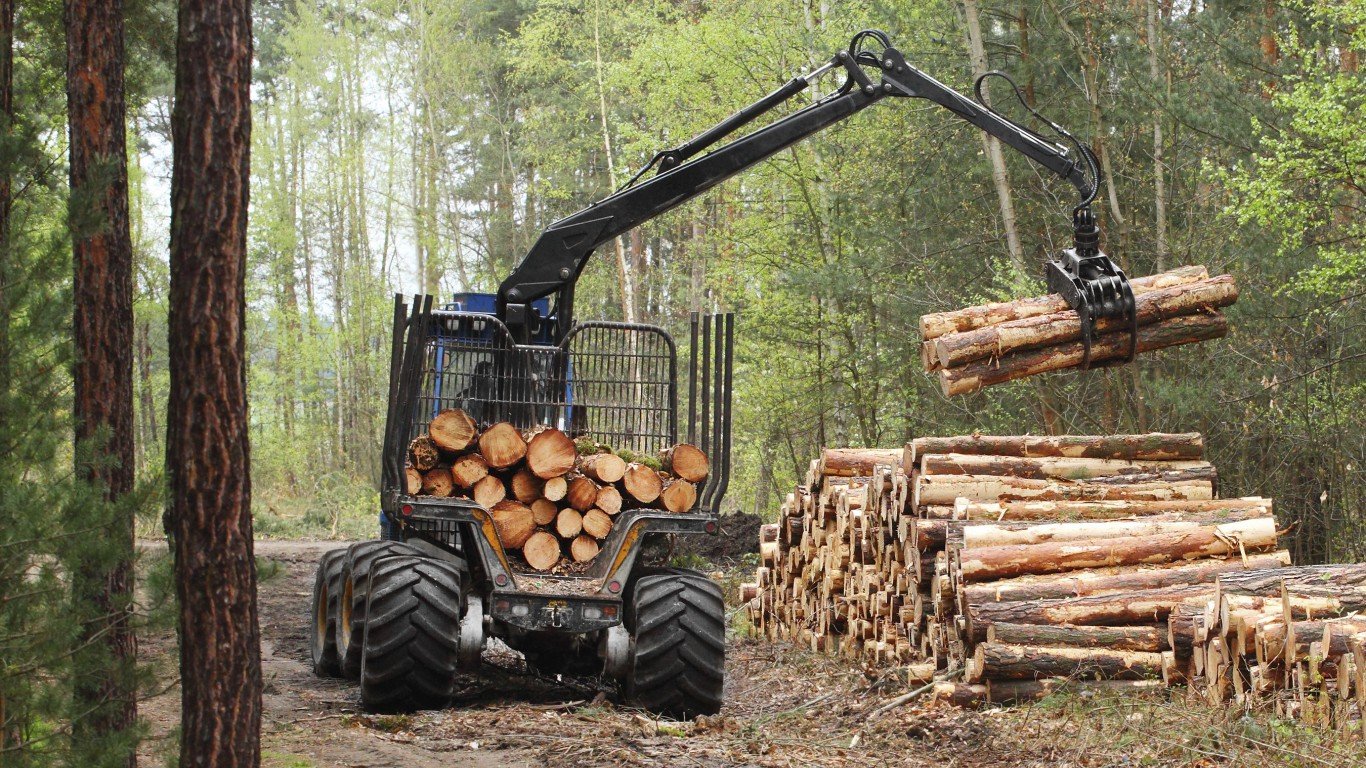
6. West Virginia
> Underemployment rate: 10.6%
> June unemployment rate: 4.6% (tied — 15th highest)
> Average wage: $41,651 (6th lowest)
> Labor force growth: 0.0%
West Virginia is one of many major energy-producing states where economic growth and labor utilization has been curbed by the global drop in energy prices in recent years. West Virginia is the second largest coal producer in the nation, and the share of workers employed in mining and logging is more than five times the comparable national figure. In 2016, West Virginia’s GDP shrank by 1.2%, one of the largest economic contractions of any state. The mining and logging sector was the biggest drag on economic growth.
Employment in the state has also declined as working-age adults have migrated outside of the state for other job opportunities. Between 2011 and 2016, the number of employed workers in West Virginia fell at an average pace of 0.5% a year, the largest decline of any state. While outbound migration may have helped reduce the state’s unemployment rate, labor underutilization remains high. Some 10.6% of the labor force are underemployed, tied for the sixth largest share in the country.
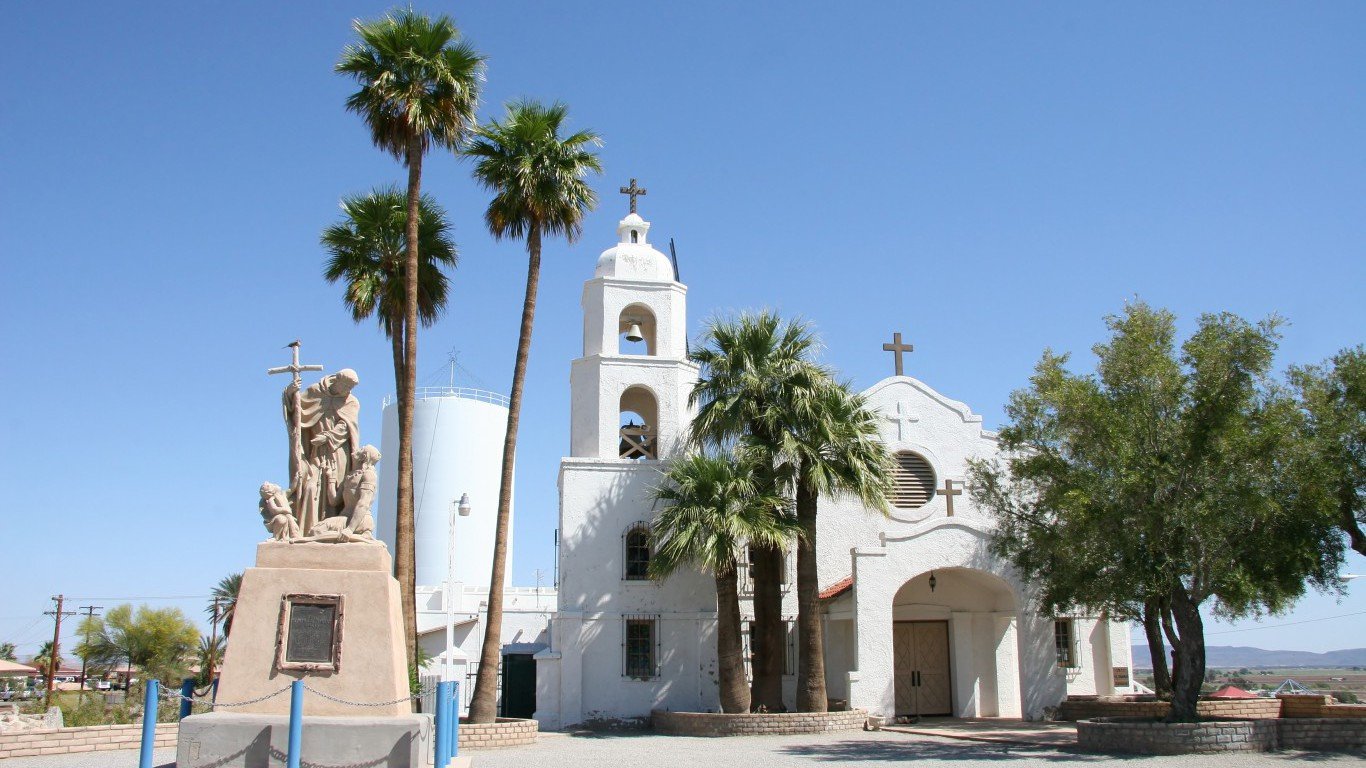
5. Arizona
> Underemployment rate: 10.9%
> June unemployment rate: 5.1% (tied — 4th highest)
> Average wage: $48,530 (22nd highest)
> Labor force growth: 2.3% (5th largest increase)
While heavy inbound migration to Arizona has helped spur economic activity and job growth in recent years, labor underutilization in the state remains among the worst in the country. Between 2011 and 2016, the number of employed workers in the state rose by an average of 2.4% a year, far more than the 1.9% national rate.
Employment rose by 3.1% in 2016, the fourth most of any state. Still, Arizona’s underemployment rate fell from 11.7% one year ago to 10.9% today, a relatively small improvement for a state with such rapid job growth. While unemployment in the state fell, the share of the labor force who recently gave up on their job search remained at 1.3%, among the largest share of any state.
[in-text-ad]
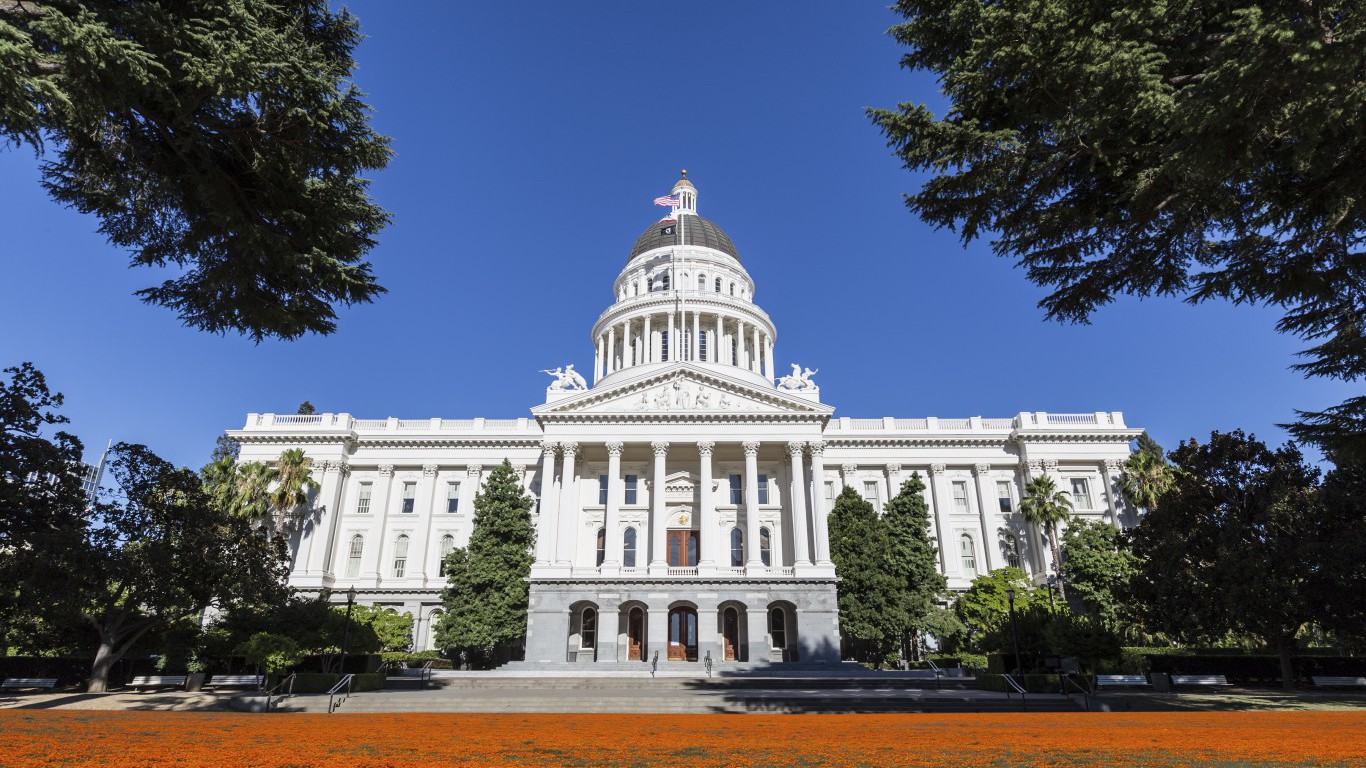
4. California
> Underemployment rate: 11.1%
> June unemployment rate: 4.7% (tied — 11th highest)
> Average wage: $62,947 (4th highest)
> Labor force growth: 1.1% (20th largest increase)
In California, 11.1% of the labor force are underemployed, far higher than the 9.5% national rate. One factor driving up the state’s high labor underutilization is the large share of workers settling for a part-time job after failing to find full-time employment, which at 4.6% is the second largest share of any state. While California’s underemployment rate has improved from 12.0% one year ago, the rate has yet to return to the pre-recessionary level of 9.1% in 2006.
[recirclink id=404324]
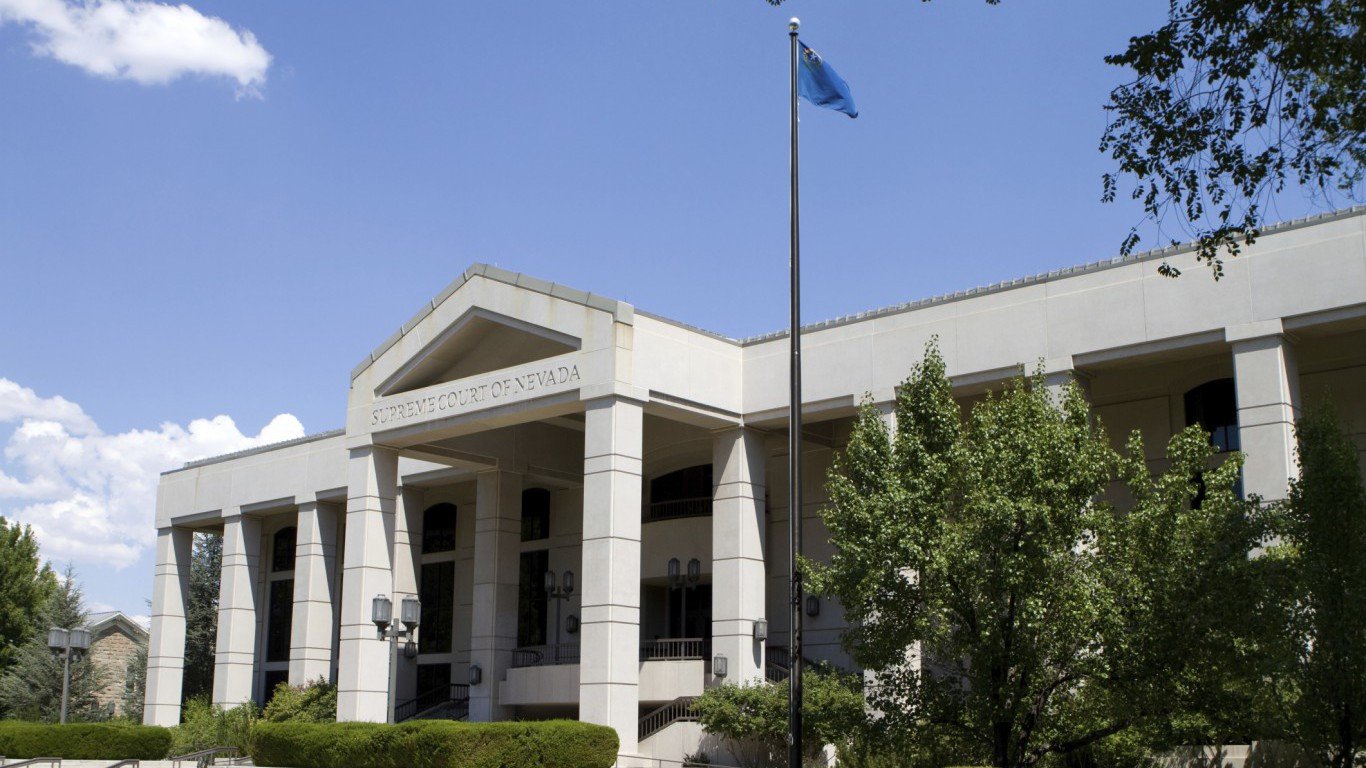
3. Nevada
> Underemployment rate: 11.9%
> June unemployment rate: 4.7% (tied — 11th highest)
> Average wage: $47,092 (24th lowest)
> Labor force growth: 0.9% (21st largest increase)
Nevada’s GDP increased 2.4% in 2016, the fourth most of any state. While more than 1 in 4 workers in the state are employed in leisure and hospitality — the highest proportion of any state — economic growth was led by the state’s professional and business services, education and health services, and construction sectors. Employment in Nevada also grew fast. The number of employed workers rose at an average annual pace of 2.9% between 2011 and 2016, the fourth fastest pace of any state. Despite the diversified economic growth and rise in employment, labor underutilization remains high. Some 11.9% of the Nevada workforce is underemployed, a substantial decline from the 13.4% share one year ago, yet far higher than the state’s pre-recessionary rate of 6.8% in 2006. By comparison, the national underemployment rate is 9.5%.
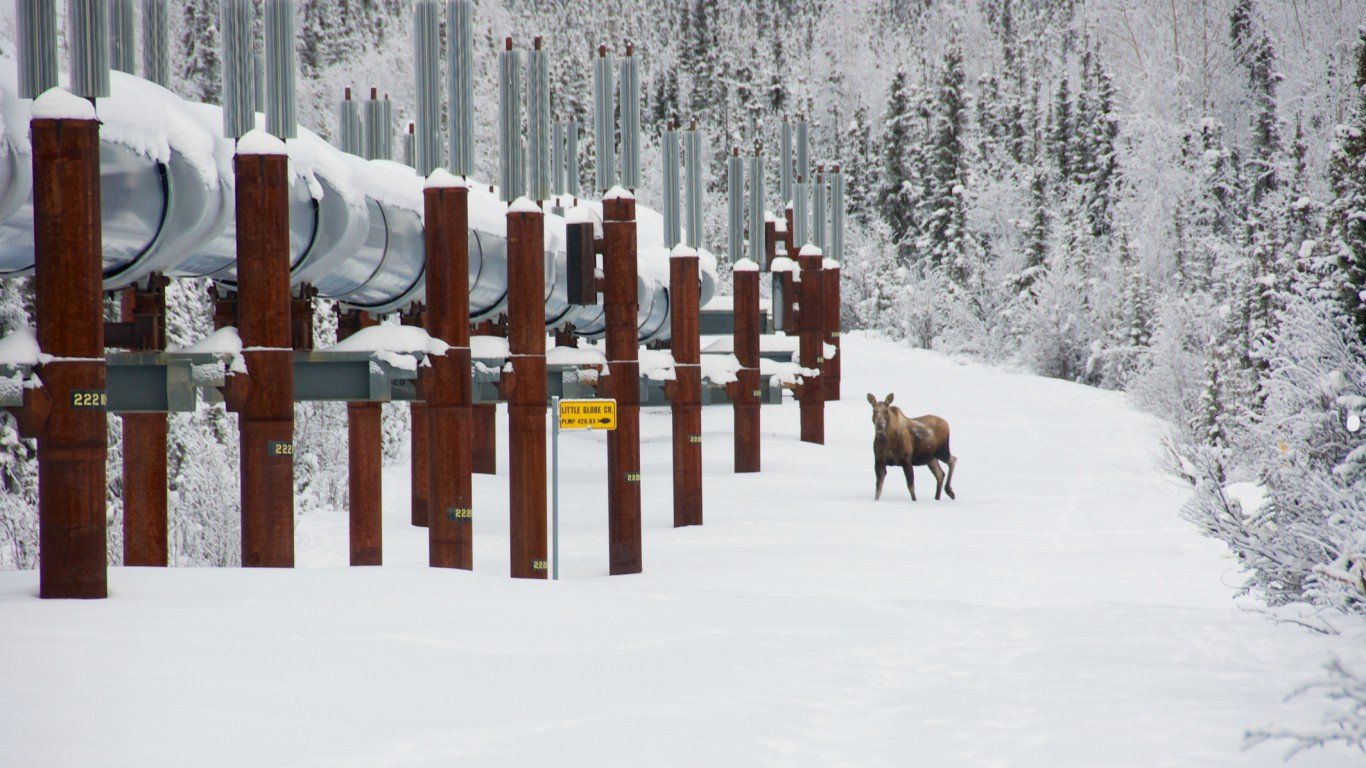
2. Alaska
> Underemployment rate: 12.9%
> June unemployment rate: 6.8% (the highest)
> Average wage: $53,654 (14th highest)
> Labor force growth: -0.6% (3rd largest decline)
Few states are more dependent on oil production, or have been hurt more by the global drop in oil prices, than Alaska. An estimated 4.4% of workers in the state are employed in mining and logging, the second largest share in the nation. Before the price of crude oil fell — by more than two-thirds between 2014 and 2016 — petroleum revenue accounted for more than 90% of the Alaskan government’s general fund budget, which has had a consecutive deficit since 2013.
Alaska’s GDP fell 5.0% in 2016, the second largest contraction of any state. The slowdown in economic activity may have contributed to the rise in labor underutilization over the past year. Some 12.9% of Alaska’s labor force are underemployed, the second largest share of any state and a slight increase from 12.0% one year ago. Currently, the state’s 6.8% unemployment rate is the highest of any state.
[in-text-ad-2]
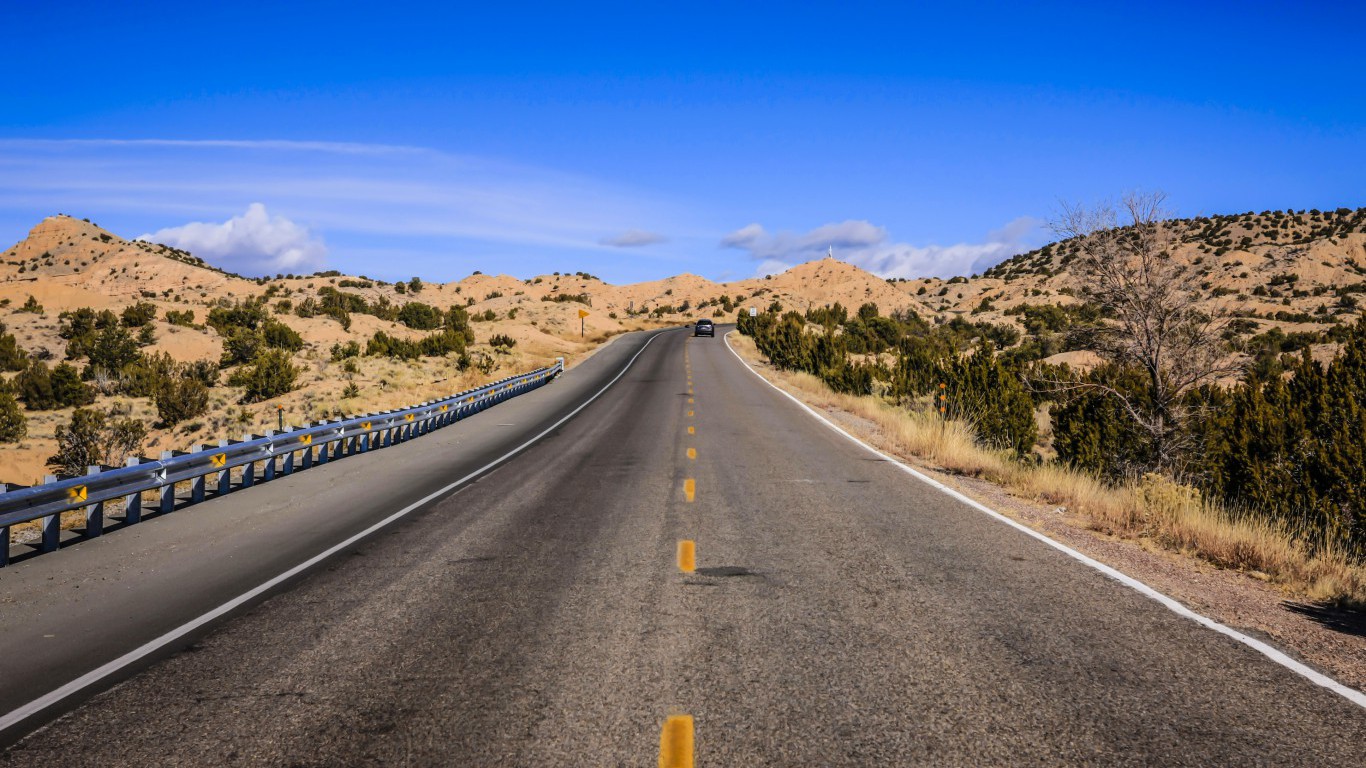
1. New Mexico
> Underemployment rate: 13.0%
> June unemployment rate: 6.4% (2nd highest)
> Average wage: $42,596 (7th lowest)
> Labor force growth: 0.4%
In no state is it harder to find a job in than New Mexico. Some 6.4% of workers are unemployed, the second highest unemployment rate in the country. Also, some 4.6% of workers have settled for part-time job, and 1.3% have recently given up on looking for work. New Mexico is one of the only states in the country where labor underutilization increased over the past year — from 12.4% one year ago to 13.0%. The state’s high labor underemployment corresponds with the state’s sluggish economic growth. New Mexico’s GDP contracted by 0.5% last year, as the national GDP increased by 1.5%.
Detailed Findings and Methodology:
Labor underutilization in the United States has largely improved over the past year. The underemployment rate fell in 40 states, and the national underemployment rate fell from 10.1% one year ago to 9.5% today. In the states where labor underutilization increased over the past year, the change usually coincided with sluggish economic conditions. The three states where underemployment increased the most in 2016 — Wyoming, Alaska, and North Dakota — had the largest GDP declines in the country.
All of the states with declining GDPs and rising underemployment disproportionately depend on oil. The price of crude oil fell by more than two-thirds from May 2014 through the beginning of 2016, hurting the economies of many major oil-producing states throughout the South and Midwest. While the oil industry had previously provided high-paying jobs to relatively unskilled workers, many of those who lost their industry jobs may have trouble finding employment in other sectors. In 7 of the 10 states where a relatively large share of the workforce is employed in the mining and logging sector, GDP declined substantially over the past year, and 6 of the 10 had increases in underemployment.
States where labor underutilization is improving, however, tended to have rapid economic and population growth. In recent years, waves of Americans have been migrating from the Northeast to states in the West and Southeast, where job availability is high and cost of living is low. The influx of new residents in states such as Oregon, Arizona, Georgia, and North Carolina has stimulated regional economic growth, which in turn helped decrease underemployment.
As is the case with traditional unemployment, state educational attainment appears to have an effect on underemployment. A member of the labor force with a college education is more likely to find full-time employment, and a state with a large share of college-educated adults is more likely to attract new businesses that provide and create additional job opportunities.
To determine the states where it is hardest (and easiest) to find full-time work, 24/7 Wall St. examined average underemployment rates for the 12 months through the first quarter of this year as measured by the BLS. The underemployment rate is the total number of unemployed job seekers, discouraged and other marginally attached workers, and people settling for part-time jobs as a share of the labor force. We also considered the official unemployment rate as of June 2017. Also from the BLS, we reviewed average annual wages, employment, and the size of the labor force from 2015 through 2016. Socioeconomic indicators, including poverty and educational attainment rates came from the U.S. Census Bureau’s 2015 American Community Survey. GDP growth and contribution to GDP growth by industry came from the Bureau of Economic Analysis and is for the period 2015 to 2016.
Contact [email protected] for any questions or corrections.