[cnxvideo id=”625482″ placement=”ros”]The United States is one of the most socially and economically diverse nations on Earth. While some towns, cities, and even counties are home to widespread prosperity, others can be characterized by their abject poverty. In Lincoln County, South Dakota, 3.7% of the population lives in poverty, while the state’s Oglala Lakota County has a poverty rate of 53.9%.
Extreme inequality is not unique to South Dakota or the Midwest. Rather, in nearly every state in the nation, there is at least one county where social and economic measures reflect an extremely poor quality of life.
In these marginalized and destitute parts of the United States, poverty is only one of many problems that residents face making their quality of life potentially much worse than for those Americans fortunate enough to live in affluent places.
In addition to poverty, poor health outcomes and low educational attainment persist in at least one county in every state in the country. Based on these socioeconomic measures, 24/7 Wall St. created an index to measure quality of life in every county in the U.S. with a population of at least 10,000 in order to identify the worst worst county to live in every state.
Click here to see the worst county to live in every state.
Click here to see our detailed findings and methodology.

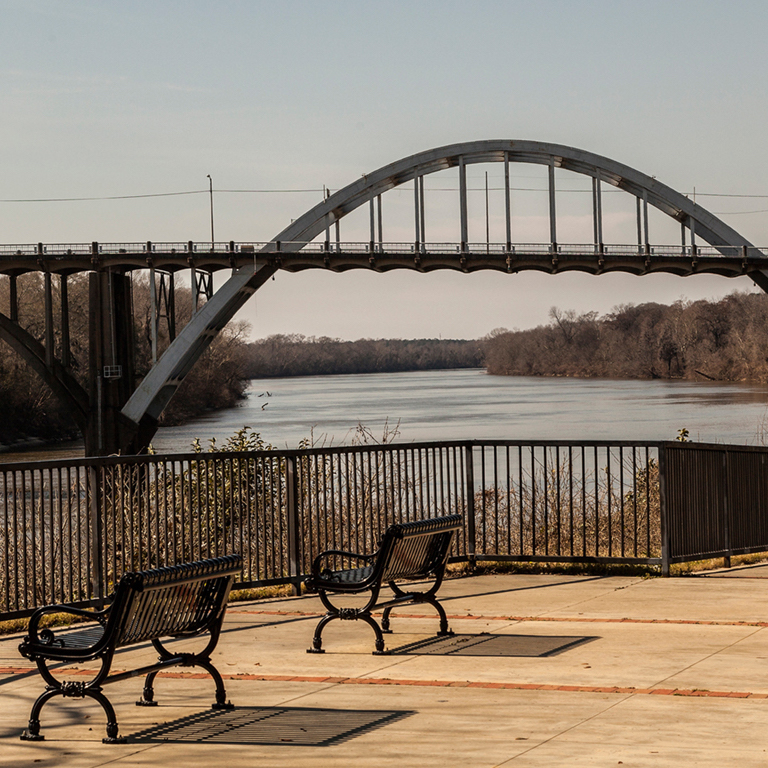
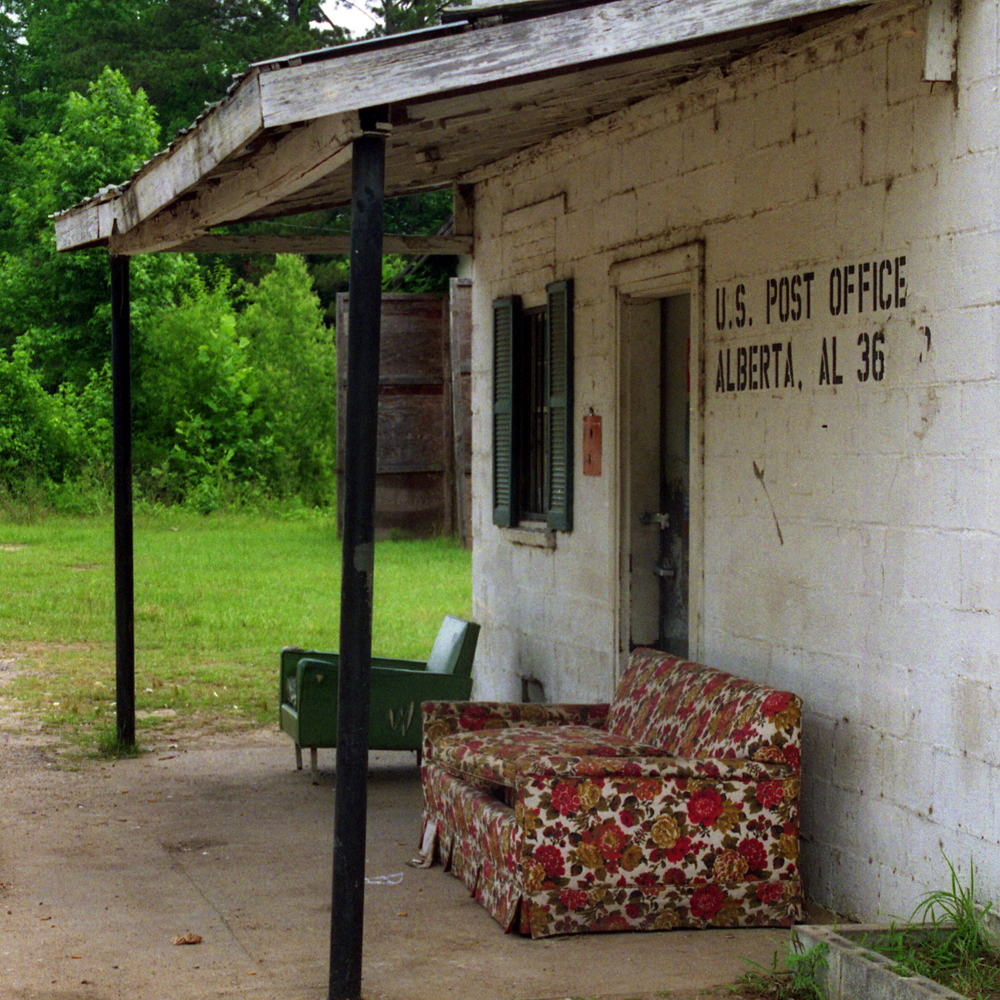
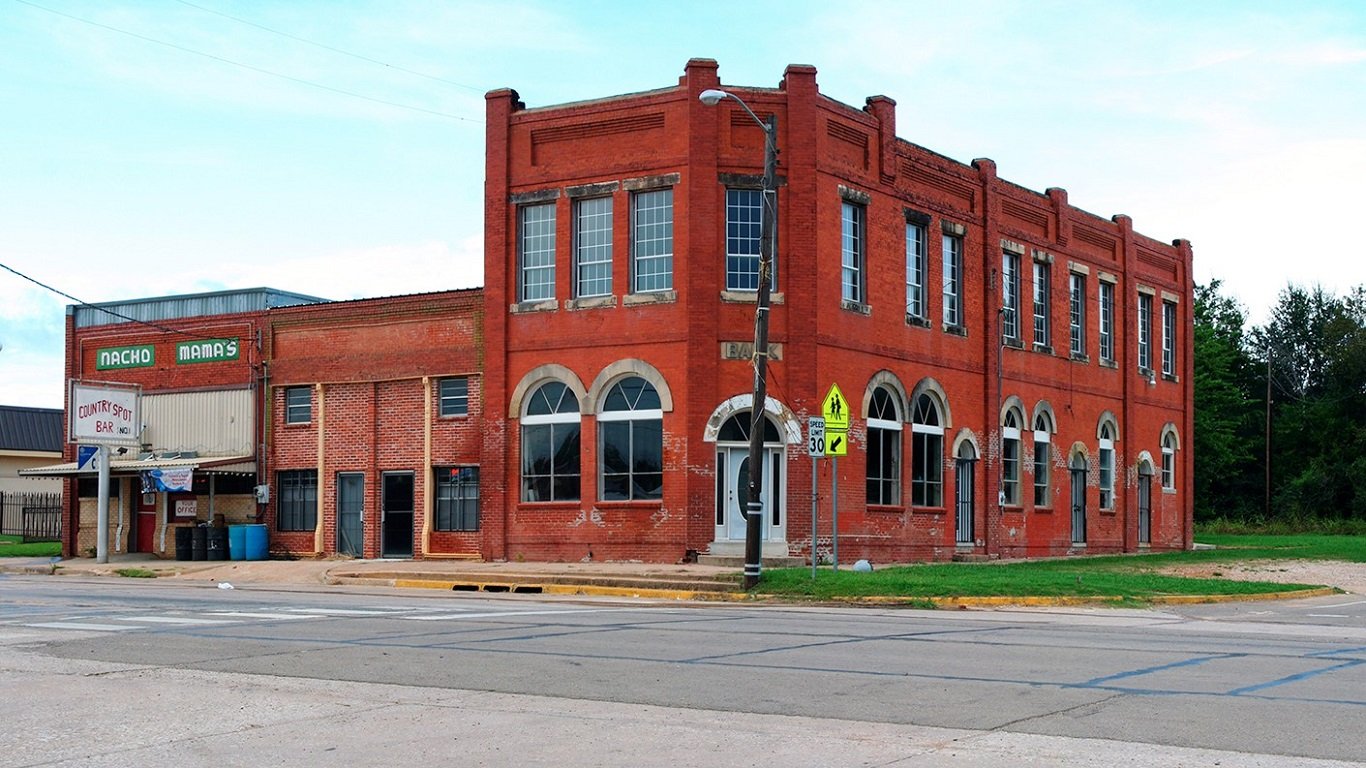
1. Wilcox County, Alabama
> 5-yr. population change: -6.3%
> Nov. unemployment rate: 9.3%
> Poverty rate: 34.9%
> Life expectancy at birth: 72.2 years
Wilcox County is one of the poorest counties in both Alabama and in the United States. The median household income in the county is only $24,442 a year, less than half the national median of $55,322 and considerably lower than median of $44,758 for Alabama as a whole. Additionally, 34.9% of the Wilcox County population lives below the poverty line, compared with the 15.1% national poverty rate and the state’s poverty rate of 18.4%.
Serious financial hardship in Wilcox County can be attributed at least in part to widespread joblessness. The unemployment rate in Wilcox County is 9.3%, more than double the 4.1% national unemployment rate. Like other counties reporting similarly poor conditions, Wilcox County’s population is shrinking. Over the last five years, the county’s population declined 6.3%, even as the U.S. count increased 3.9% over the same period.
[in-text-ad]

2. Bethel Census Area, Alaska
> 5-yr. population change: +5.4%
> Nov. unemployment rate: 13.0%
> Poverty rate: 26.6%
> Life expectancy at birth: 74.3 years
The median household income in Alaska’s Bethel Census Area is $53,296 a year, well below Alaska’s $74,444 median, but only slightly less than the $55,322 national median. A large share of the Bethel area’s population faces serious financial hardship. Some 26.6% live below the poverty line, more than double the state’s 10.1% rate, but still lower than the nation’s 15.1 rate.
For many Bethel area residents, a lack of insurance coverage adds a further financial burden. About 1 in 4 area residents lack health insurance, well above the 11.7% U.S. uninsured rate. High poverty and uninsured rates might partially explain some poor health outcomes in the area. Life expectancy in the Bethel region is only 74.3 years, about four years less than the state average.
[recirclink id=434202]

3. Apache County, Arizona
> 5-yr. population change: +2.0%
> Nov. unemployment rate: 9.2%
> Poverty rate: 36.2%
> Life expectancy at birth: 74.3 years
Comprising much of Arizona’s eastern border, Apache County borders Utah and New Mexico and includes several Indian reservations — including Fort Apache and Navajo Nation. Today, 73.2% of the county’s population identifies as Native American. For a variety of historical and persisting reasons, Indian reservations often report far worse socioeconomic conditions than the rest of the country, and Apache County is no different.
In this county, 36.2% of residents live below the poverty line; this is the highest rate for any of the state’s counties and more than double the national rate. A weak job market in Apache County has contributed to widespread financial hardship. With an unemployment rate of 9.2%, Apache County has the second highest rate of any county in Arizona and more than double the U.S. rate of 4.1%.
4. Phillips County, Arkansas
> 5-yr. population change: -9.6%
> Nov. unemployment rate: 5.7%
> Poverty rate: 33.5%
> Life expectancy at birth: 71.3 years
Phillips County in Arkansas hugs the western banks of the Mississippi River and the county’s largest city is about 120 miles east of Little Rock. The poorest county in the state, about 1 in 3 Phillips County residents live in poverty. This is much higher than the state’s poverty rate of 18.8%. Poorer Americans have fewer healthy options available when it comes to managing their diet and lifestyle and so they often have a lower life expectancy. Life expectancy in Phillips County is just 71.3 years, about five years less than the state’s average and eight years less than the national average.
Phillips County’s population is also shrinking. Over the last five years, the number of people residing in Phillips County declined 9.6%, the largest contraction for any county in Arkansas.
[in-text-ad-2]

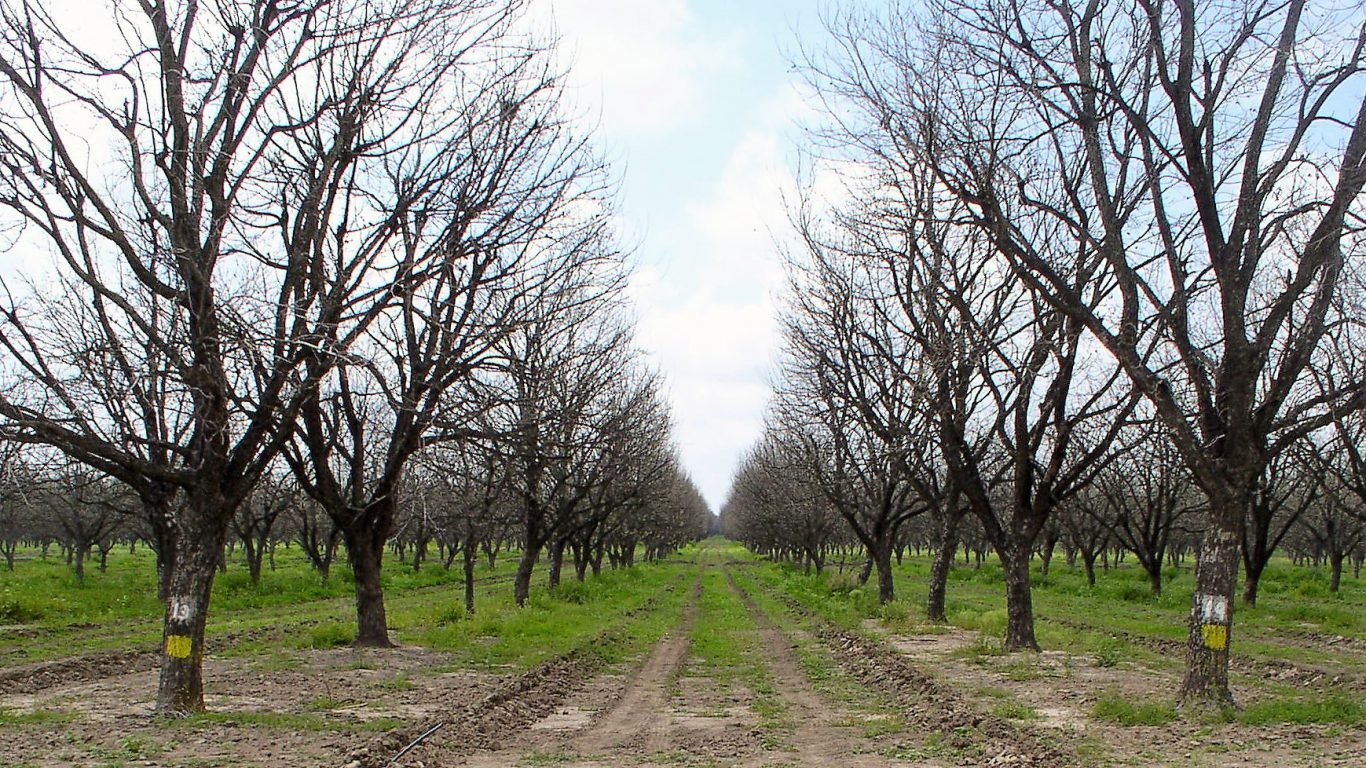
5. Lake County, California
> 5-yr. population change: -0.5%
> Nov. unemployment rate: 5.3%
> Poverty rate: 24.6%
> Life expectancy at birth: 75.8 years
Lake County is located in Northern California, and its county seat of Lakeport lies about 120 miles north of San Francisco. Though California is home to some of the country’s wealthiest regions, Lake County is not one of them. The median income in Lake County is only $36,132, almost half the state’s median of $67,739. Many high-paying jobs often require a college degree, but the county reports low educational attainment levels. Only 16.2% of adults in Lake County have received a bachelor’s degree, about half the rate for California.
6. Otero County, Colorado
> 5-yr. population change: -1.9%
> Nov. unemployment rate: 3.9%
> Poverty rate: 23.1%
> Life expectancy at birth: 76.4 years
One of the fastest-growing states in the country, Colorado has registered an 8.3% increase in population over the last five years. Not all parts of the state are drawing newcomers, however. In Otero County, the population contracted 1.9% in the last five years.
Colorado is also one of the nation’s best-educated states, with 38.7% of the adults there having received a bachelor’s degree. This was the highest rate for any state except Massachusetts. In stark contrast, only 17.1% of the adults in Otero County have a four-year college degree. Better-educated adults typically find higher-paying jobs. With one of the lowest bachelor’s degree-attainment rates in the state, Otero County is a relatively poor area. The county’s median household income for is only $34,477 year, well below the state’s median of $62,520.
[in-text-ad]
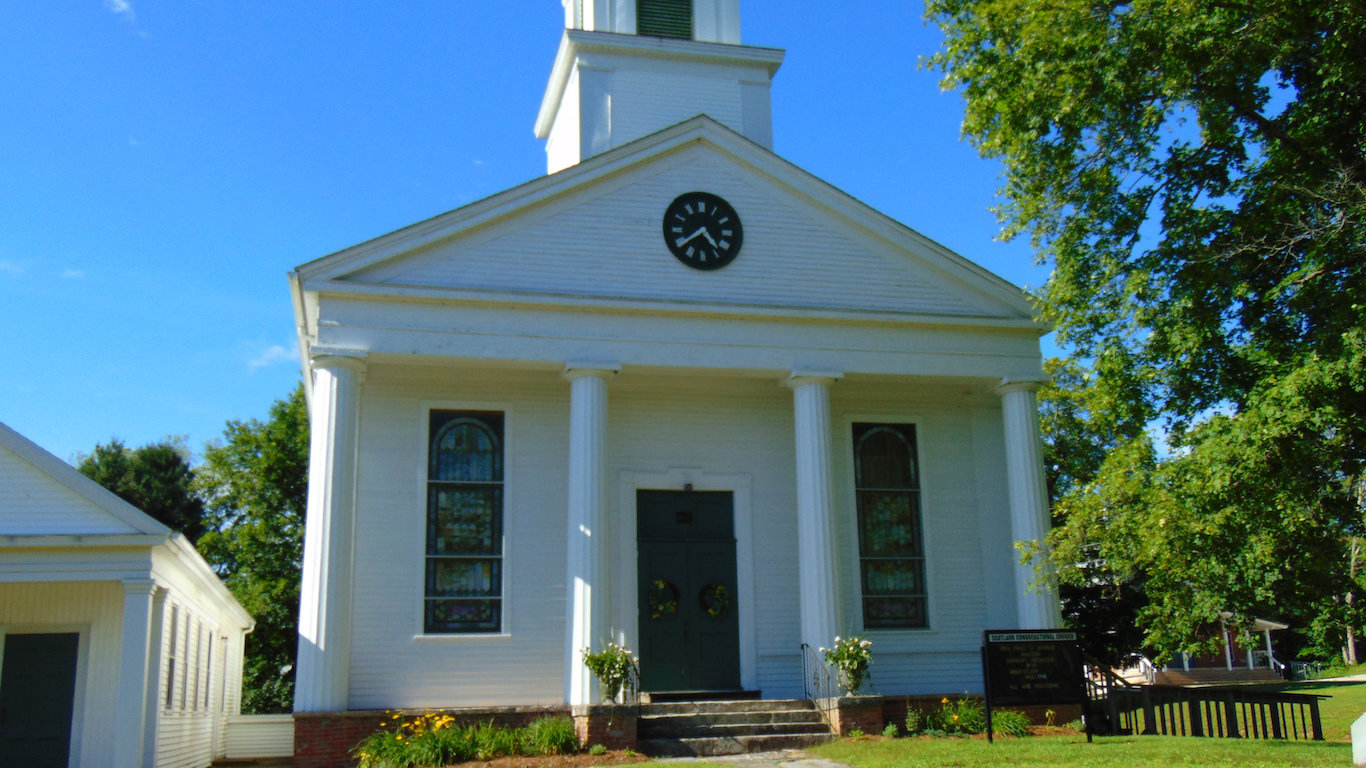
7. Windham County, Connecticut
> 5-yr. population change: -0.8%
> Nov. unemployment rate: 4.5%
> Poverty rate: 11.2%
> Life expectancy at birth: 79.0 years
Bordering Massachusetts and Rhode Island, Windham County comprises Connecticut’s northeast corner. Although in educational attainment, life expectancy, and poverty, it ranks as the worst among Connecticut’s eight counties, Windham County residents are in many ways better off than many Americans. For example, Windham County’s median household income is $60,689 a year, lower than the state’s median of $73,433 but well higher than the country’s median of $55,322.
Additionally, only 11.2% of Windham County residents live in poverty, higher than the state’s poverty rate of 9.8% but lower than the country’s rate of 15.1%.
[recirclink id=434095]
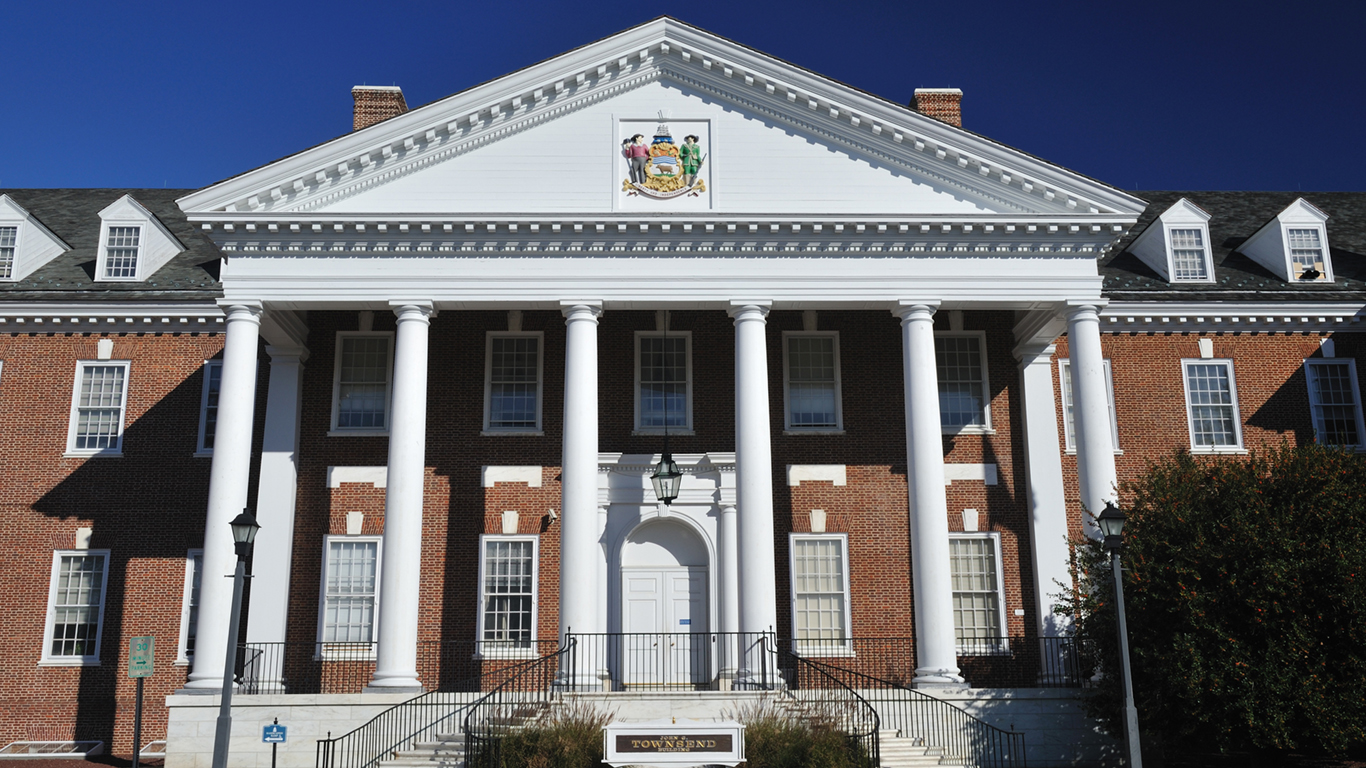
8. Kent County, Delaware
> 5-yr. population change: +7.2%
> Nov. unemployment rate: 4.3%
> Poverty rate: 13.2%
> Life expectancy at birth: 77.5 years
A small state, Delaware is comprised of only three counties — none which rank especially poorly on a national scale. The median household income in Kent County is $55,184 a year, roughly in line with what the typical American household earns but considerably less than Delaware’s median of $61,757. Similarly, the county’s 13.2% poverty rate — though higher than the state’s 11.7% rate — is considerably lower than the nation’s 15.1% poverty rate.
While many of the counties on this list have been shedding residents in recent years, Kent County is an exception. In the last five years, its population has grown 7.2%, outpacing the state’s 5.0% increase and the nation’s 3.9% gain.
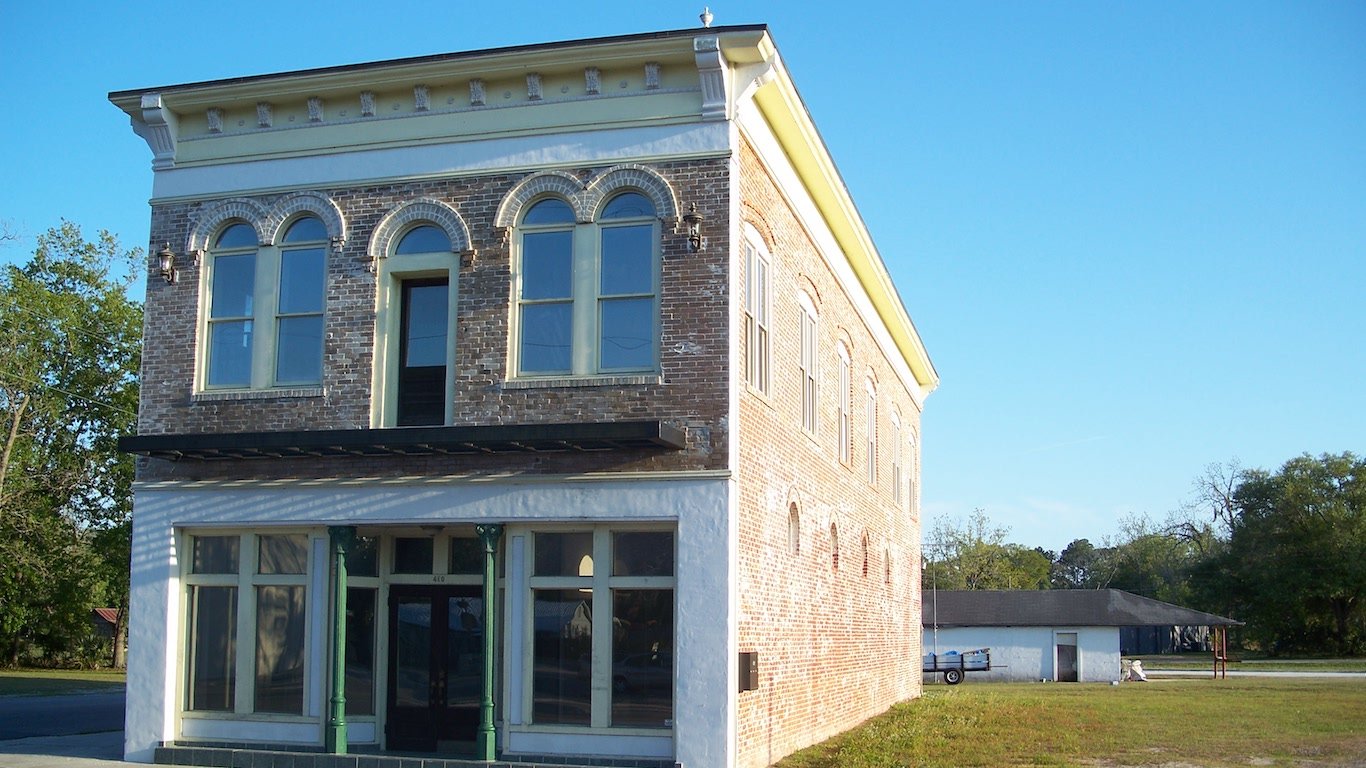
9. Union County, Florida
> 5-yr. population change: -2.1%
> Nov. unemployment rate: 3.7%
> Poverty rate: 22.4%
> Life expectancy at birth: 67.6 years
Union County is a landlocked area in Florida just north of Gainesville. Based on life expectancy, educational attainment, and the prevalence of poverty, the residents in this county fare worse than their peers across Florida. In Union County, only 7.6% of adults have received a bachelor’s degree, well below the state’s 27.9% rate. Better-educated populations are more likely to be high-earning and financially secure. In Union County, the median household income is just $37,778, well below the state’s median of $48,900.
College-educated adults are also more likely to live longer, healthier lives than those who have received only a high school diploma. The low level of educational attainment in Union County might explain some of the poor health outcomes there. For example, life expectancy in the county is just 67.6 years, more than 10 years less than the state’s average — and about the same as life expectancy in India.
[in-text-ad-2]
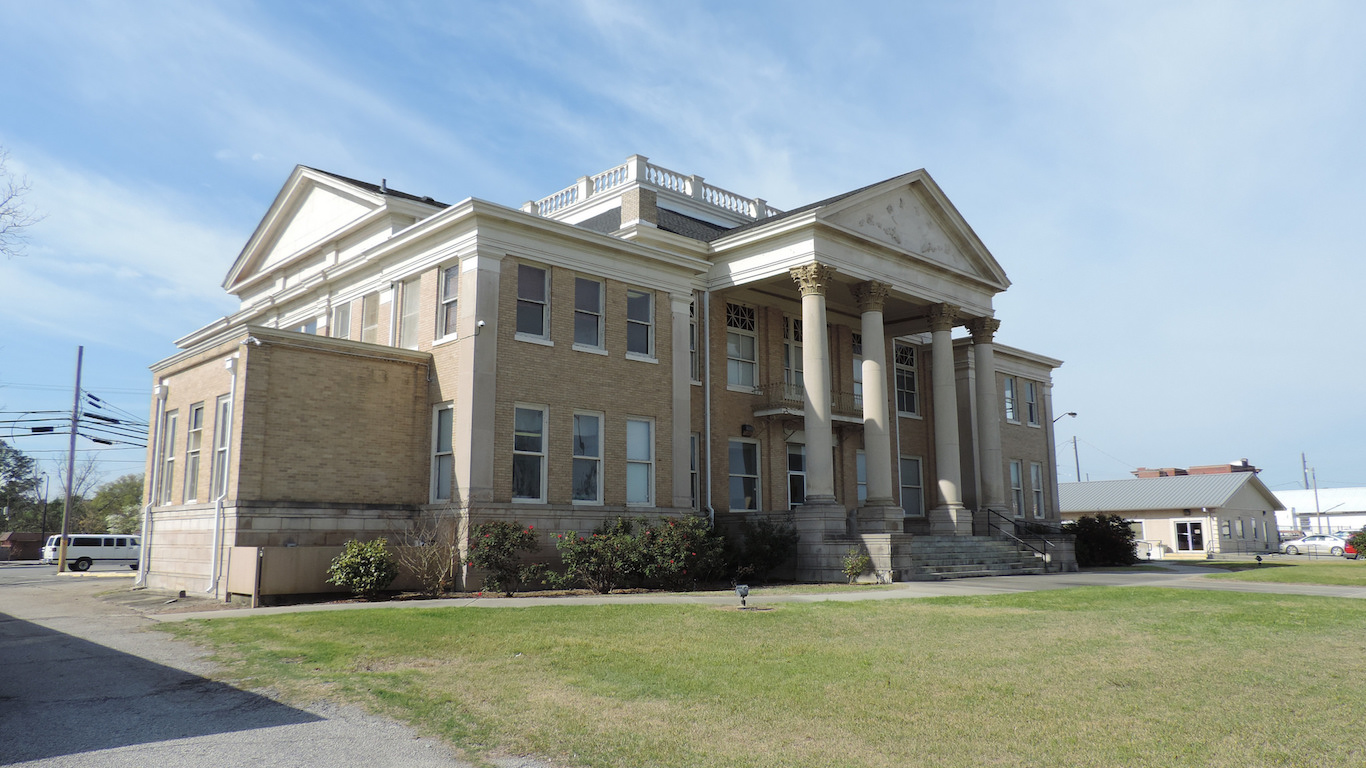
10. Ben Hill County, Georgia
> 5-yr. population change: -1.4%
> Nov. unemployment rate: 7.0%
> Poverty rate: 35.0%
> Life expectancy at birth: 73.6 years
Most of the counties across the nation with the highest incomes and best health outcomes are in close proximity to metropolitan areas. But for many of the counties on this list, the opposite is true. Fitzgerald, the county seat of Georgia’s Ben Hill County is about 145 miles from Savannah and 170 miles from Atlanta. In Ben Hill County, only 10.6% of adults have received a bachelor’s degree, compared with 30.5% of the adults in the state. College-educated adults are less likely to face serious financial hardship. And in Ben Hill County, 35.0% of the population lives below the poverty line, roughly double the state’s rate.
The area’s widespread financial insecurity is partially attributable to joblessness. The unemployment rate in Ben Hill is 7%, much higher than the nation’s rate of 4.1%.

11. Hawaii County, Hawaii
> 5-yr. population change: +5.8%
> Nov. unemployment rate: 2.4%
> Poverty rate: 18.7%
> Life expectancy at birth: 80.2 years
Though it ranks as the worst county in Hawaii, by many measures, Hawaii County is a better place to live than many places in the United States. For example, life expectancy in the county is 80.2 years, about a year more than the national average. Additionally, Hawaii County has an unemployment rate of just 2.4%, well below the country’s 4.1% jobless rate.
While Hawaii County residents are relatively healthy and benefit from a strong job market, a substantial share of them face serious financial hardship. Almost 19% of the county’s population lives below the poverty line, well above the state’s 10.8% rate.
[in-text-ad]

12. Owyhee County, Idaho
> 5-yr. population change: -0.8%
> Nov. unemployment rate: 3.8%
> Poverty rate: 23.6%
> Life expectancy at birth: 78.7 years
Owyhee County is the only county in Idaho where fewer than 1 in 10 adults have a bachelor’s degree. Areas with lower educational attainment are often poorer than places with higher education levels, and Owyhee County is no exception. The median household income in the county is only $34,785 a year, about $14,000 less than Idaho’s median.
Encompassing the state’s southwest corner, Owyhee County is rural and sparsely populated. Many area resident commute to neighboring counties for work; 47.5% of workers living in Owyhee County travel to jobs outside county lines.
[recirclink id=433891]
13. Saline County, Illinois
> 5-yr. population change: -1.6%
> Nov. unemployment rate: 6.4%
> Poverty rate: 22.3%
> Life expectancy at birth: 74.9 years
Among counties in Illinois with at least 10,000 residents, Saline County has the lowest life expectancy. The county’s life expectancy is only 74.9 years, about four years less than the state’s average, and in line with Kuwait’s.
Poorer Americans have fewer healthy options when it comes to their diet and lifestyle, and researchers have found that poverty correlates with a lower life expectancy. Saline County is one of only a handful in the state where more than 1 in 5 residents live below the poverty line. An increase in the number of available jobs would likely improve the financial situation for many area residents. The county’s unemployment rate is 6.4%, well above the nation’s rate of 4.1%.
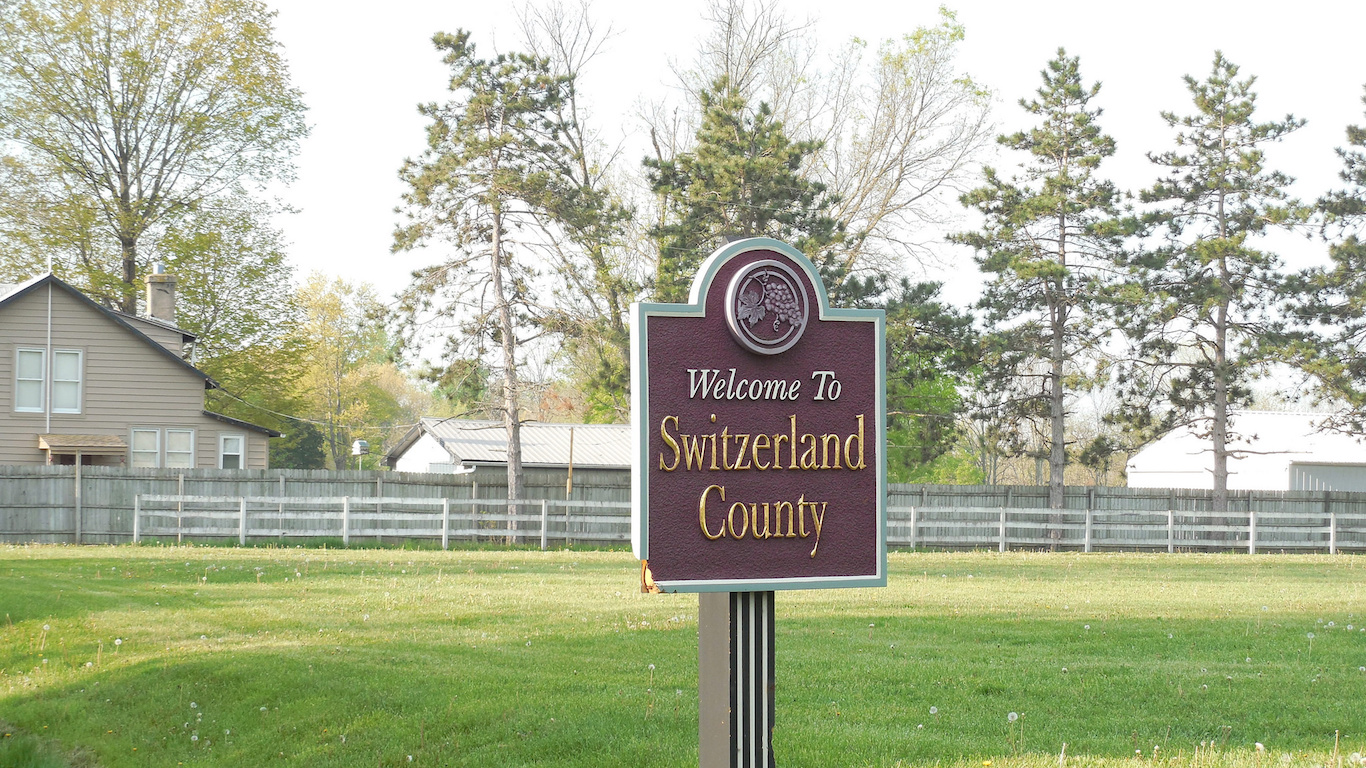
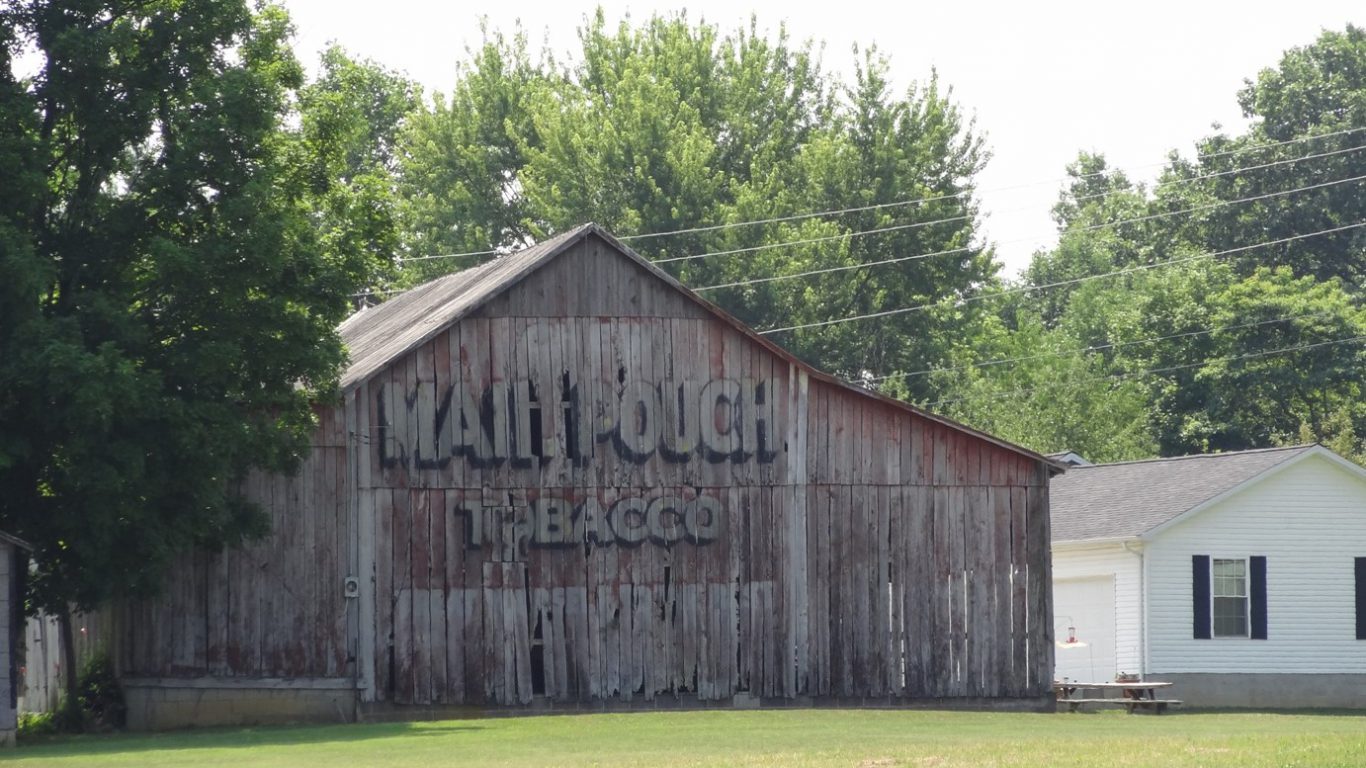
14. Switzerland County, Indiana
> 5-yr. population change: 0.0%
> Nov. unemployment rate: 3.8%
> Poverty rate: 21.5%
> Life expectancy at birth: 76.5 years
Better-educated populations are more likely to report high incomes and live longer, healthier lives. In Switzerland County, situated along the Ohio River between Cincinnati and Louisville, Kentucky, only 8.3% of the population has a bachelor’s degree. That is the lowest share for any county in Indiana.
Similar to other American counties with low educational attainment, financial hardship is relatively common in Switzerland County. The county is one of a handful in the state where more than 1 in 5 residents live in poverty. Poverty can greatly affect an individual’s ability to remain healthy, and a high poverty rate may partially explain a lower life expectancy. Life expectancy in Switzerland County is only 76.5 years, more than a year lower than the state’s average.
[in-text-ad-2]
15. Crawford County, Iowa
> 5-yr. population change: +0.7%
> Nov. unemployment rate: 3.1%
> Poverty rate: 21.7%
> Life expectancy at birth: 80.3 years
Crawford County is a relatively rural county in Iowa; its county seat of Denison is about 90 miles northwest of Des Moines. The county’s median household income is $49,699, less than Iowa’s median of $56,247 but much higher than the median for most counties on this list. Nonetheless, a substantial share of the county’s residents face serious financial hardship. About 22% of the area’s residents live below the poverty line; this is the second highest poverty rate for any county in Iowa and well above the national rate of 15.1%.
Better-educated populations are more likely to report a higher quality of life and higher incomes. In Crawford County, only 11.7% of the adults have earned a bachelor’s degree, the smallest share for any county in the state.

16. Wyandotte County, Kansas
> 5-yr. population change: +3.5%
> Nov. unemployment rate: 4.5%
> Poverty rate: 22.7%
> Life expectancy at birth: 75.4 years
Most of the counties on this list are relatively rural and isolated. This is not the case for Wyandotte County in Kansas, located just across the Kansas-Missouri state line Kansas City, one of the Midwest’s largest cities. Nonetheless, a large share of Wyandotte County residents are struggling financially. While the typical household in Kansas earns $53,571 a year, the median household income in Wyandotte County is only $40,757. Additionally, 23% of the county population lives below the poverty line, while the state’s rate is only 13%.
Poorer areas tend to report unfavorable health outcomes, and Wyandotte County is no different. The county’s life expectancy is only 75.4 years, more than three years lower than the state’s average.
[in-text-ad]

17. McCreary County, Kentucky
> 5-yr. population change: -1.9%
> Nov. unemployment rate: 5.6%
> Poverty rate: 42.5%
> Life expectancy at birth: 72.9 years
Entirely encompassed by the Daniel Boone National Forest and lying adjacent to the Tennessee border, McCreary County is relatively rural. With a median household income of $18,972, McCreary County is one of the nation’s poorest counties. Here, 42.5% of the county residents live in poverty; this represents the highest poverty rate of any county in the state and the seventh highest rate of any American county.
Lower-income Americans have fewer healthy options for their diet and when it comes to adjusting their lifestyle. In McCreary County, life expectancy is only 72.9 years, about six years shy of the country’s average.
[recirclink id=433818]

18. Madison County, Louisiana
> 5-yr. population change: -3.1%
> Nov. unemployment rate: 7.0%
> Poverty rate: 39.6%
> Life expectancy at birth: 71.6 years
Few counties struggle as much in important socioeconomic measures as Madison Parish in Louisiana. Life expectancy in Madison Parish is just 71.6 years — well below the nation’s 79.1 average. Pervasive poverty and a lack of access to medical care have contributed to the parish’s poor health outcomes. The district’s poverty rate is 39.6%, much higher than the state’s 20.2% rate. Additionally, 29.1% of Madison County residents lack health insurance, one of the highest uninsured rates for U.S. counties or their equivalents.
Americans typically gain health insurance coverage through work, and a poor job market may partially explain Madison County’s low incomes and high uninsured rate. The county’s unemployment rate is 7.0%, well above the nation’s 4.1% rate.

19. Piscataquis County, Maine
> 5-yr. population change: -2.7%
> Nov. unemployment rate: 4.3%
> Poverty rate: 20.6%
> Life expectancy at birth: 78.0 years
Piscataquis County is located in the middle of Maine, and contains the entirety of Baxter State Park. About 1 resident in 5 in Piscataquis County lives in poverty, the highest rate of any county in Maine. At just $36,938 a year, Piscataquis County’s median household income is also the lowest of any county in the state. Like most counties on this list, Piscataquis County is relatively rural and is becoming more sparsely populated. The county experienced a population decline of 2.7% in the past five years, even as the U.S. population increased by 3.9%.
[in-text-ad-2]
20. Somerset County, Maryland
> 5-yr. population change: -2.1%
> Nov. unemployment rate: 6.8%
> Poverty rate: 25.1%
> Life expectancy at birth: 76.9 years
Somerset County lies along the western shores of the Delmarva Peninsula, across the Chesapeake Bay from the mouth of the Potomac River. Although Maryland has a median household income of $76,067 and is home to some of the nation’s wealthiest counties, Somerset County is not one of them. Median household income in the county is only $35,886 a year, less than that of any other county in the state. Somerset is also the only county in Maryland where more than 1 in 4 residents live below the poverty line.
Across large population groups, incomes tend to rise with educational attainment. In Somerset County only 14.0% of the adults have received a bachelor’s degree; this is less than half the state’s rate of 38.4% and the lowest rate for any county in the state.
21. Hampden County, Massachusetts
> 5-yr. population change: +1.1%
> Nov. unemployment rate: 4.4%
> Poverty rate: 17.6%
> Life expectancy at birth: 78.9 years
With Springfield as its largest city, Hampden County in Massachusetts straddles the Connecticut border. A relatively wealthy state, Massachusetts has a median household income of $70,954, which is about $15,000 more than the comparable national figure. Even in Hampden County, the state’s poorest county, the the typical household earns $51,005, only $4,000 less than the country’s median.
Median incomes in the county would likely improve with a better job market. Currently, the unemployment rate in Hampden County is 4.4%, nearly the highest rate for any Massachusetts county and just slightly higher than the nation’s 4.1% rate.
[in-text-ad]

22. Lake County, Michigan
> 5-yr. population change: -1.5%
> Nov. unemployment rate: 6.9%
> Poverty rate: 27.2%
> Life expectancy at birth: 76.8 years
Lake County scores lower than any other county in Michigan in a number of measures assessing income, education and health. The typical Lake County household earns just $30,824 a year, far less than the state median of $52,492 and the lowest of any county in Michigan. One factor contributing to low incomes in Lake County may be low educational attainment. Just 9.0% of adults in Lake County have a bachelor’s degree, the lowest rate of any county in the state and among the least of any in the country.
Income and education are two of the major factors influencing health and longevity. The life expectancy in Lake County is just 76.8 years, less than Michigan’s average of 78.3 years and the national average of 79.1.
[recirclink id=433549]

23. Wadena County, Minnesota
> 5-yr. population change: -0.5%
> Nov. unemployment rate: 4.6%
> Poverty rate: 15.5%
> Life expectancy at birth: 78.8 years
Wadena County lags behind all the rest of Minnesota’s counties on many measures. Median household income in Wadena County is $42,689 a year, nearly the lowest median of any county in the state and far less than the $63,217 the typical Minnesota household earns annually. One factor contributing to low incomes in the area may be low educational attainment. While throughout Minnesota 34.2% of adults have at least a bachelor’s degree, just 13.0% of adults in Wadena County do — the second lowest rate of any county in the state. Relatively high unemployment in the county might also contribute to the low incomes there, and adding more jobs might mean the difference between poverty and financial security for some residents. Wadena County’s unemployment rate is 4.6%, and 15.5% of the population lives in poverty; both measures are among the highest for the state’s counties.

24. Holmes County, Mississippi
> 5-yr. population change: -4.3%
> Nov. unemployment rate: 8.1%
> Poverty rate: 45.0%
> Life expectancy at birth: 71.0 years
Across a range of socioeconomic measures, few counties in the country rank as poorly as Holmes County in Mississippi. The typical household in the county has an income of only $20,800 a year, the lowest median for any county in the state and less than half the nation’s median of $55,322. Additionally, a disproportionate 45.0% of Holmes County residents live below the poverty line, the highest such rate in the state and the sixth highest rate for any county nationwide.
Poorer Americans are less likely than those with relatively high incomes to live long healthy lives and the poverty rate in Holmes County may help explain some negative health outcomes there. Average life expectancy in the county is just 71 years, well below Mississippi’s average of 75 and the national average of 79.
[in-text-ad-2]
25. Pemiscot County, Missouri
> 5-yr. population change: -4.5%
> Nov. unemployment rate: 6.1%
> Poverty rate: 29.1%
> Life expectancy at birth: 72.0 years
In a departure from the national trend, life expectancy is declining in Pemiscot County. The county’s average life expectancy fell from 72.2 years in 2010 to 72.0 years in 2014, while the U.S. life expectancy rose from 78.8 years to 79.1 years. Poorer populations often report worse health outcomes than wealthier ones, and Pemiscot County is one of the poorest counties in Missouri. Pemiscot County’s 29.1% poverty rate is nearly double the state’s rate of 15.3%.
Pemiscot’s poor job market does little to help economic conditions in the area. The county’s unemployment rate is 6.1%, the worst rate of any county in the state. A lack of jobs may also be driving some residents out of the county. In the last five years, Pemiscot County’s population declined 4.5%, even as the U.S. population grew 3.9%.
26. Roosevelt County, Montana
> 5-yr. population change: +8.8%
> Nov. unemployment rate: 3.9%
> Poverty rate: 26.9%
> Life expectancy at birth: 71.2 years
About 74% of Roosevelt County land lies within the Fort Peck Indian Reservation, home for multiple divisions of the Assiniboine and Sioux tribes. Like members of many Native American communities, residents of Fort Peck struggle with low incomes, high poverty, and poor health outcomes. The median household income in Roosevelt County is $34,481 a year, the third lowest of any county in the state. Additionally, 26.9% of Roosevelt County residents live in poverty, well above Montana’s 14.9% poverty rate. Higher incomes have been shown to provide the means for better health outcomes and longevity. The life expectancy at birth in Roosevelt County is just 71.2 years — equivalent to that of North Korea and nearly eight years less than the U.S. life expectancy of 79.1.
[in-text-ad]
27. Dakota County, Nebraska
> 5-yr. population change: -0.5%
> Nov. unemployment rate: 2.9%
> Poverty rate: 16.0%
> Life expectancy at birth: 78.4 years
Dakota County is one of only two counties in Nebraska in which less than 3 in 4 adult resident have a high school diploma. A high school education is a prerequisite for college and in Dakota County only 13.0% of adults have a bachelor’s degree, the lowest share in the state.
Populations with lower educational attainment rates tend to report lower incomes. Despite its relatively small share of college-educated adults, Dakota County is not especially poor. The county’s median household income is $52,336, only about $2,000 less than the state’s median and $3,000 lower than the nation’s median.
[recirclink id=432660]
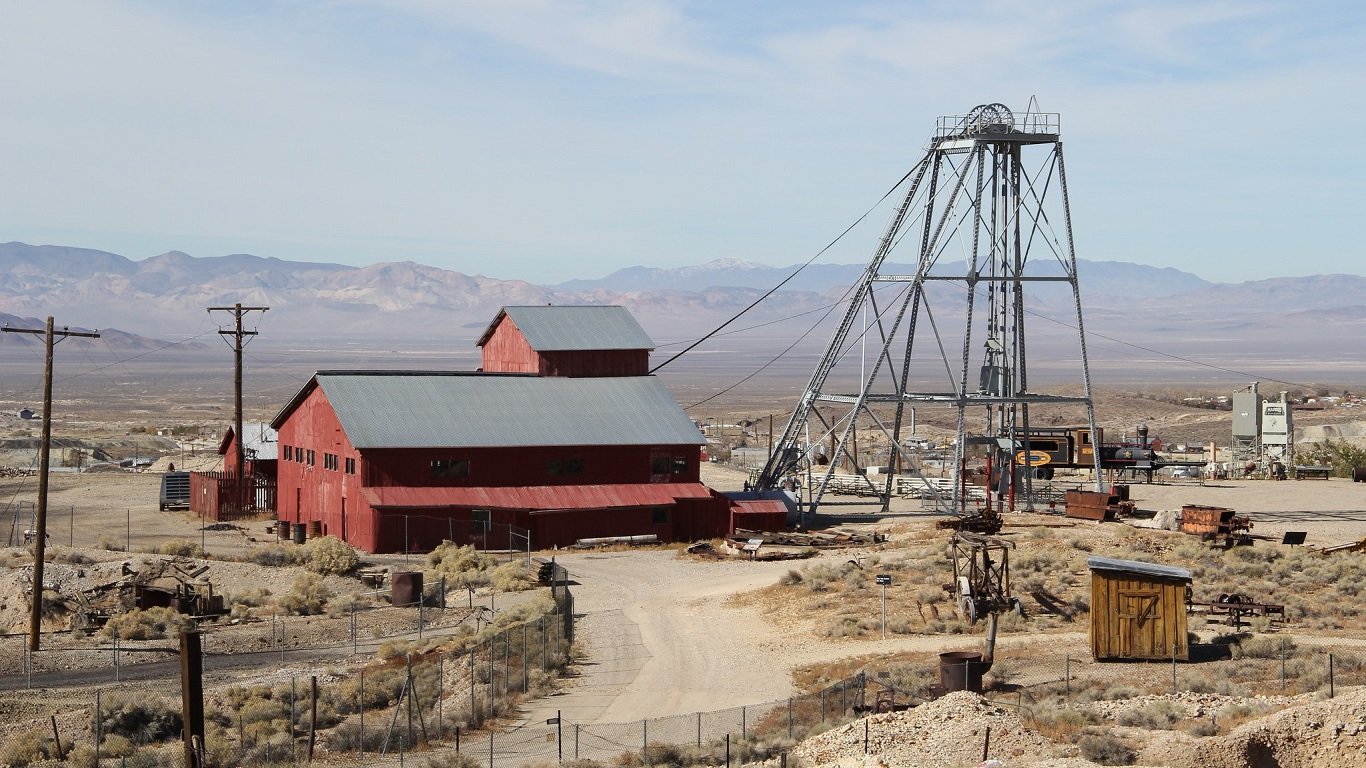
28. Nye County, Nevada
> 5-yr. population change: -1.9%
> Nov. unemployment rate: 6.4%
> Poverty rate: 17.2%
> Life expectancy at birth: 74.1 years
At 74.1 years, the life expectancy in Nye County is the lowest of any county in Nevada. While the nation’s life expectancy has slightly improved from 78.8 to 79.1 years in the last half a decade, in Nye County’s average declined from 74.3 in 2010 to 74.1 in 2014.
Like many counties on this list, Nye has experienced a dwindling of its population. Nye County’s population contracted 1.9% in the last five years, even as Nevada’s population grew 8.0%. Population declines are often driven by outward migration, and a lagging job market may partially explain an exodus. With 6.4% of the county’s labor force out of work, it has the highest unemployment rate for any county in Nevada.
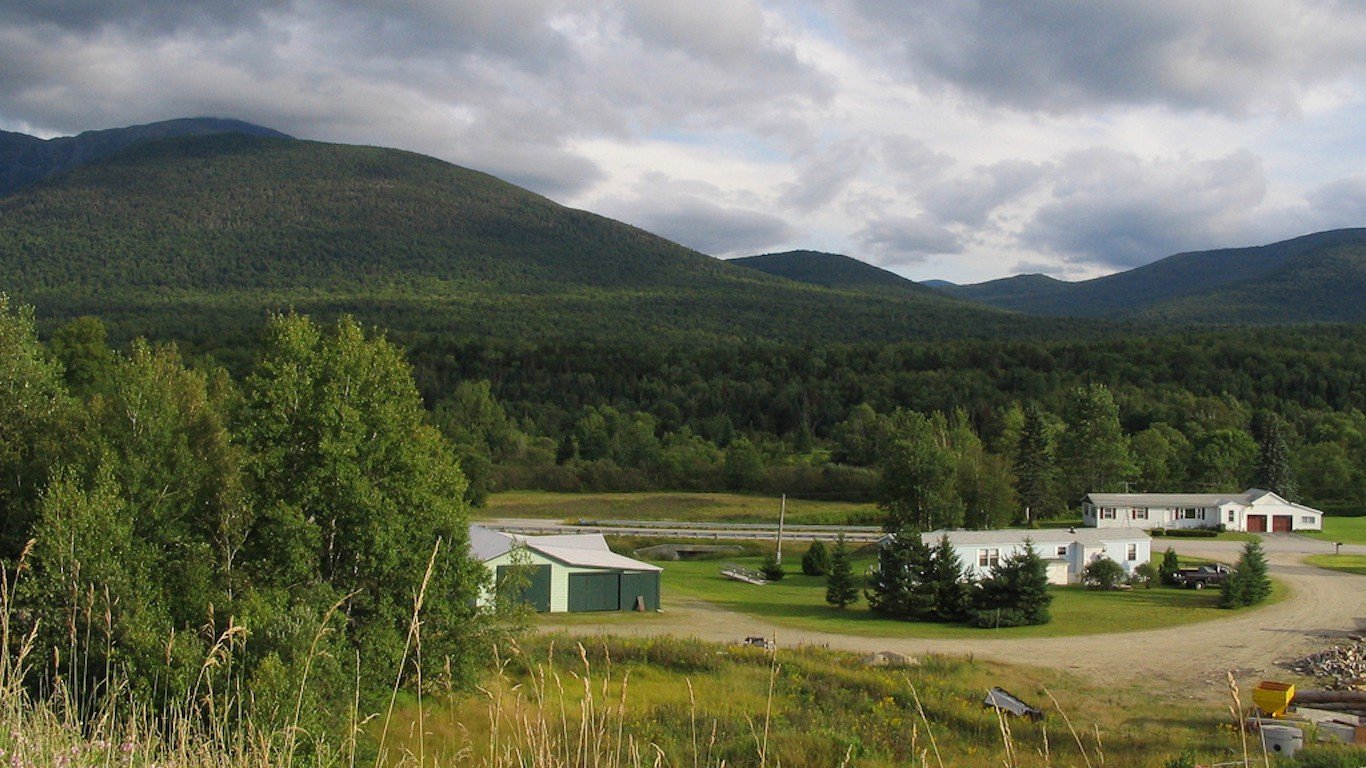
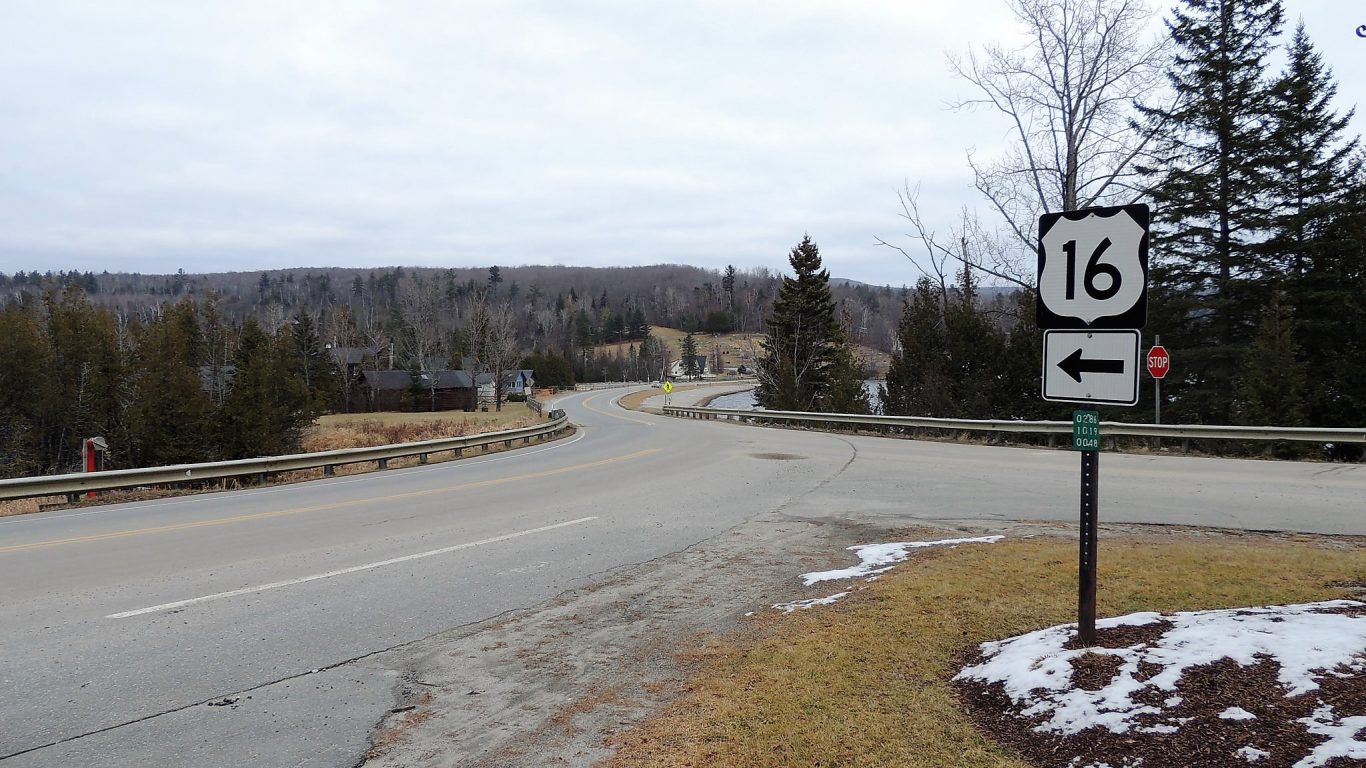
29. Coos County, New Hampshire
> 5-yr. population change: -3.0%
> Nov. unemployment rate: 3.2%
> Poverty rate: 13.3%
> Life expectancy at birth: 78.2 years
Coos County is located in the northern tip of New Hampshire between Maine and Vermont. In recent years, residents have struggled from the decline of the region’s pulp and paper manufacturing industry. According to the New Hampshire Center for Public Policy Studies, employment in the paper industry has declined more than 80% within the state over the last five decades. Three paper mills in Coos County closed between 2006 and 2007, and just one — Gorham Paper & Tissue, employing approximately 120 workers — remains in operation. The loss of industry has likely contributed to population loss and unemployment. Coos County was the only county in New Hampshire to lose population from 2000 to 2010, and today 3.2% of its workforce is unemployed, the highest unemployment rate in the state.
[in-text-ad-2]

30. Cumberland County, New Jersey
> 5-yr. population change: -0.3%
> Nov. unemployment rate: 7.1%
> Poverty rate: 18.5%
> Life expectancy at birth: 76.6 years
New Jersey is one of the wealthiest states and its residents are among the best educated in the country. New Jersey’s median household income of $73,702 is about $18,400 higher than the median income nationwide. Additionally, 37.5% of adults in the state have a bachelor’s or a higher degree, well above the comparable 30.3% share of adults nationwide.
Not all parts of the Garden State report similarly high income and education rates, however. In Cumberland County, the typical household takes in $49,537 a year. The represents the lowest median income of any New Jersey county. Populations with lower educational attainment often report lower incomes and only 14.3% of adults in Cumberland have a bachelor’s degree, the smallest share for any county in the state.

31. McKinley County, New Mexico
> 5-yr. population change: +4.3%
> Nov. unemployment rate: 8.2%
> Poverty rate: 38.1%
> Life expectancy at birth: 74.9 years
Located in western New Mexico and with a county seat of Gallup, McKinley County is one of the poorest counties in both the state and the nation. The county takes in parts of the Zuni and Navajo Nation reservations. For a variety of reasons, Indian reservations often have high levels of economic hardship. More than 1 in 4 residents of the county identify as American Indian.
About 31% of the population lives below the poverty line. This is much higher than New Mexico’s poverty rate of 20.9% and more than double the nation’s rate of 15.1%. A poor job market contributes to the financial hardship in the state. The county’s 8.2% unemployment rate is among the highest of any county in the state and double the U.S. unemployment rate.
[in-text-ad]

32. Bronx County, New York
> 5-yr. population change: +4.5%
> Nov. unemployment rate: 5.6%
> Poverty rate: 30.5%
> Life expectancy at birth: 78.7 years
Bronx County is coterminous with the Bronx, the northernmost of the five boroughs that comprise New York City. By some measures, the county has the poorest and least educated population in the state. Only 71.2% of adults in Bronx County have a high school diploma, the smallest share of any county New York state. Less-educated populations are more likely to be experience financial difficulty, and in Bronx County 30.5% of the population lives below the poverty line, the highest poverty rate of any county in the state.
While most counties on this list have lost residents in recent years, the Bronx is a notable exception. The county’s population expanded 4.5% in the last five years, outpacing New York state’s 1.0% growth rate and the 3.9% national rate.
[recirclink id=433303]

33. Robeson County, North Carolina
> 5-yr. population change: +1.2%
> Nov. unemployment rate: 6.5%
> Poverty rate: 30.8%
> Life expectancy at birth: 73.7 years
Native Americans comprise 38.7% of Robeson County’s population, and a majority of them are members of the Lumbee Tribe. While the Lumbee are recognized by the government of North Carolina, the federal government has not officially recognized the tribe, which makes them ineligible for much-needed federal benefits related health care and education. While Robeson County is home of the University of North Carolina at Pembroke, just 12.6% of the county’s adults have a bachelor’s degree. This is less than half the comparable 29.0% state college-attainment rate. An estimated 30.8% of Robeson County’s population lives in poverty, the third largest share in the state and one of the highest poverty rates in the country. Robeson County’s life expectancy is just 73.7 years, five years lower than the nation’s average.
34. Rolette County, North Dakota
> 5-yr. population change: +5.2%
> Nov. unemployment rate: 7.7%
> Poverty rate: 31.6%
> Life expectancy at birth: 73.0 years
Resource extraction in the Bakken shale region of North Dakota has been a boon for the state’s economy. The state’s unemployment rate is 2.6%, nearly the lowest rate among states. Not all parts of the state are experiencing such low unemployment, however. In Rolette County, 7.7% of the labor force is jobless, the highest unemployment rate of any county in the state. A poor job market may partly explain other economic challenges in the region. For example, 31.6% of Rolette County residents live in poverty, roughly three times the 11.2% poverty rate for North Dakota as a whole.
Poorer Americans have less access to healthy options related to diet and lifestyle, and pervasive financial hardship in Rolette County may partially explain low life expectancy in the area. Life expectancy in the county is only 73 years, about seven years shy of state average.
[in-text-ad-2]
35. Adams County, Ohio
> 5-yr. population change: -1.5%
> Nov. unemployment rate: 5.9%
> Poverty rate: 24.5%
> Life expectancy at birth: 75.2 years
Adams County lags behind the majority of counties in Ohio in a number of measures related to income, education, and health. A college education increases a person’s likelihood of earning a high income, and a large number of college-educated adults can attract advanced advanced, high-paying industries to an area.
In Adams County, just 10.9% of adults have a bachelor’s degree, far less than the state’s 26.7% rate and the nation’s 30.3%. The typical Adams County household earns $34,709 a year, the second lowest amount of any county in Ohio. About 25% of Adam’s residents live in poverty, the second highest poverty rate in the state. Low college attainment and widespread poverty are likely depressing health outcomes in the county. Life expectancy in Adams County is just 75.2 years, compared to the 77.9-year life expectancy for Ohio as a whole and the 79.1-year national figure.
36. Choctaw County, Oklahoma
> 5-yr. population change: -0.9%
> Nov. unemployment rate: 5.5%
> Poverty rate: 28.5%
> Life expectancy at birth: 73.3 years
Choctaw County, located on Oklahoma’s southern border with Texas, is the worst county to live in the state. A long-term decline in population is often a good indicator of a county that is a less-than-ideal place to live, and Choctaw’s population count dropped 1% in the past five years alone.
Choctaw ranks among the worst in the state in measures like poverty, income, educational attainment. Such factors have been shown to correlate with worse quality of life, as well as worth health outcomes. Life expectancy in the county is 73 years, more than five years less than the national average.
[in-text-ad]

37. Malheur County, Oregon
> 5-yr. population change: -2.6%
> Nov. unemployment rate: 3.9%
> Poverty rate: 24.8%
> Life expectancy at birth: 78.4 years
Malheur County is the second largest county in Oregon by geographic size and one of the most sparsely populated. Barely 30,000 people live in the county, which covers close to 10,000 square miles. Most of Malheur has a population density of less than 1 person per square mile. People living in rural areas do not necessarily face more difficult living conditions, and there are many positives to residing outside a city. But on the whole, Americans living in rural areas are more likely to struggle financially. This is the case in Malheur, where 1 person in 4 lives in poverty, by far the largest share of any county in the state.
[recirclink id=433280]

38. Philadelphia County, Pennsylvania
> 5-yr. population change: +3.0%
> Nov. unemployment rate: 5.7%
> Poverty rate: 25.9%
> Life expectancy at birth: 75.5 years
Philadelphia County shares its borders with the city of Philadelphia, the largest city in Pennsylvania and the fifth largest city in the country. While Philadelphia is home to some prestigious universities and 26.3% of its adults have a bachelor’s degree — one of the larger shares of any county the state — the county also struggles with high unemployment, widespread poverty, and poor health outcomes. Philadelphia’s unemployment rate is 5.7%, the fourth highest of any county in Pennsylvania. An estimated 25.9% of the county’s population lives in poverty, far higher than the state’s poverty rate of 13.3% and the highest for any county in Pennsylvania. Life expectancy in Philadelphia is just 75.5 years, more than three years lower than the state and national averages.

39. Providence County, Rhode Island
> 5-yr. population change: +0.6%
> Nov. unemployment rate: 4.6%
> Poverty rate: 17.2%
> Life expectancy at birth: 79.3 years
Unlike most counties on this list, Providence County contains a major urban area — the city of Providence. The most populous county in Rhode Island, Providence County is home to more than half of the state’s population.
Economic outcomes among area residents vary considerably. Though Providence County’s median household income of $50,637 is higher than that of most counties on this list and only about $5,000 lower than the national median, a disproportionately large share of the county’s population lives in poverty. The county’s 17.2% poverty rate is by far the highest among counties in the state and well above the U.S. rate of 15.1%.
[in-text-ad-2]

40. Dillon County, South Carolina
> 5-yr. population change: -1.5%
> Nov. unemployment rate: 5.5%
> Poverty rate: 30.6%
> Life expectancy at birth: 73.1 years
Dillon County’s residents not only face some of the greatest challenges among people in South Carolina. They are also among the nation’s poorest residents. With a poverty rate of 30.6%, it is one of a small number of American counties with a poverty rate that’s more than double the nation’s rate of 15.1%. It is one of a small number of counties in the state where less than 10% of the adult population has a bachelor’s degree as compared with the nation’s bachelor’s degree-attainment rate of 30.3%. Like many extremely poor counties with low counts of adults with a college education, Dillon residents are more likely to face health issues that meaningfully shorten their lives. Life expectancy in the county is just 73 years, which is six years less than the national average.
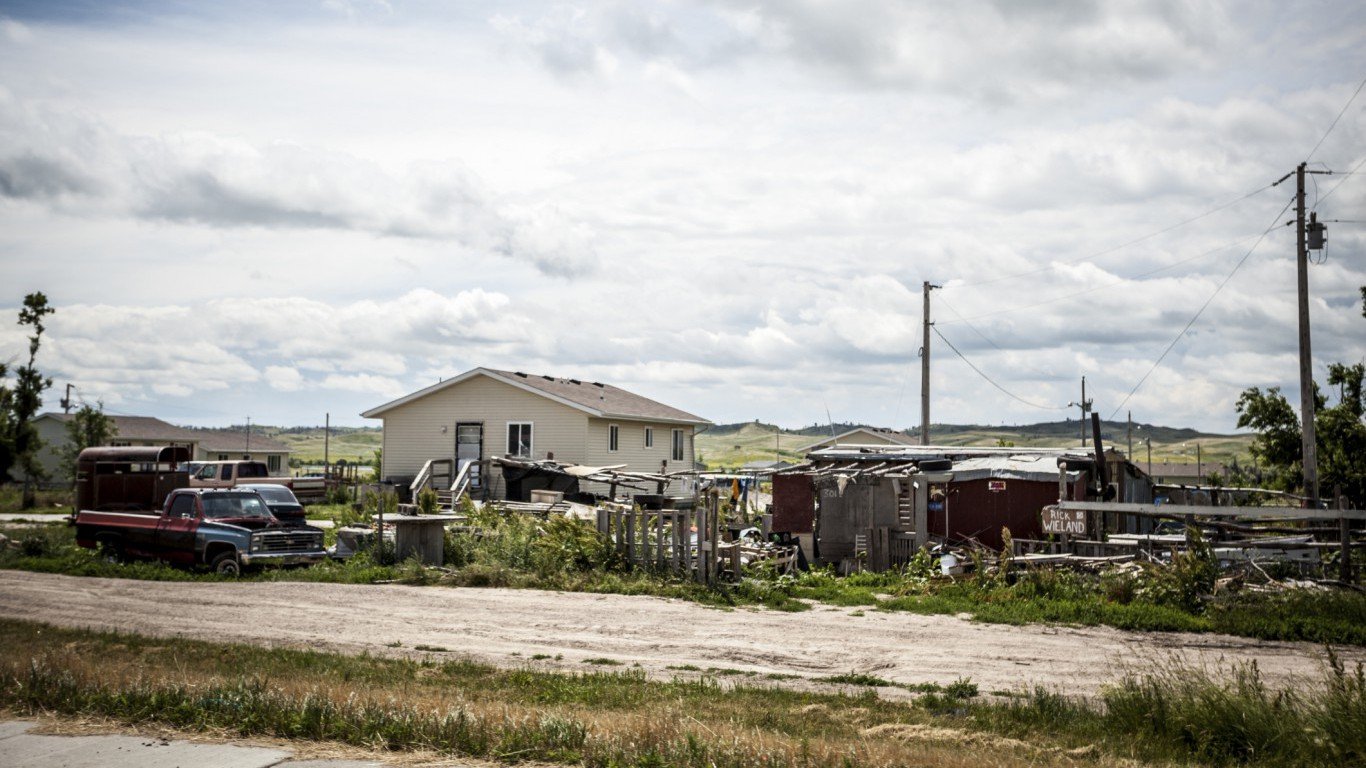
41. Oglala Lakota County, South Dakota
> 5-yr. population change: N/A
> Nov. unemployment rate: N/A
> Poverty rate: 53.9%
> Life expectancy at birth: 66.8 years
American Indians living on reservations frequently reservations frequently struggle with lagging economic conditions and poor health outcomes. Perhaps nowhere is this more evident than in Oglala Lakota County, which is contained entirely within the Pine Ridge Indian Reservation in South Dakota. The median household income in the county of $26,330 is less than half what the typical household in the state earns annually. Additionally, 53.9% of the county’s population lives in poverty, the highest rate for any county in the nation.
The stresses and challenges that accompany poverty often take a toll on personal health. Not only is Oglala Lakota the poorest county in the United States. Its residents are also the least healthy. Life expectancy in Oglala Lakota is only 66.8 years, the lowest for any U.S. county and roughly in line with life expectancy in countries like Kenya or Rwanda.
[in-text-ad]

42. Grundy County, Tennessee
> 5-yr. population change: -2.3%
> Nov. unemployment rate: 4.6%
> Poverty rate: 28.0%
> Life expectancy at birth: 72.5 years
The typical household in Grundy County earns $28,467 a year, about $18,000 less than the median household income for Tennessee as a whole. Additionally, 28.0% of the county’s population lives in poverty, a rate that’s far higher than the state’s figure of 15.8%. One factor contributing to low incomes may be low educational attainment. Just 11% of Grundy County adults have a bachelor’s degree, representing one of the lower rates for counties in Tennessee and the country as a whole.
Income and education are two of the primary factors that influence health and longevity. The life expectancy in Grundy County is just 72.5 years, lower than the U.S. average of 79.1 and the averages for countries such as Sri Lanka, Saudi Arabia, and Honduras.
[recirclink id=433167]
43. Zavala County, Texas
> 5-yr. population change: +3.5%
> Nov. unemployment rate: 9.1%
> Poverty rate: 35.8%
> Life expectancy at birth: 77.9 years
For the vast majority of Americans, a high school education can serve as a foundation for building a healthy, financially stable life. In Zavala County — much of which is located within 20 miles of the U.S.-Mexico border — only 59.2% of adults have a high school diploma. This is one of the smallest shares of any U.S. county. Students who speak English as a second language can face additional challenges in school, and in Zavala County 93.3% of the population identifies as Hispanic or Latino, a larger percentage than in all but five other U.S. counties.
More often than not, better educated populations report higher incomes. Along with having low levels of educational attainment, Zavala County’s residents have a median household income of $26,639; this is less than half of what the typical household in the state takes in.

44. San Juan County, Utah
> 5-yr. population change: +7.0%
> Nov. unemployment rate: 5.6%
> Poverty rate: 27.6%
> Life expectancy at birth: 79.0 years
About 47% of the population of San Juan County is American Indian. After decades of poor treatment by the government and racial discrimination, Native Americans are struggling with serious obstacles to financial stability, health, and prosperity. At the end of 2017, a federal judge ruled that the county’s commission map unconstitutionally grouped the entire Navajo population into a single district, despite the tribe’s accounting for about half of the county’s population. This could have an impact on the area’s poor living conditions — parts of the reservation lack electricity, running water, and other amenities under the purview of the county. Currently, 27.6% of the county’s population live in poverty, the largest share of any county in Utah.
[in-text-ad-2]
45. Orleans County, Vermont
> 5-yr. population change: -0.6%
> Nov. unemployment rate: 4.0%
> Poverty rate: 14.6%
> Life expectancy at birth: 79.4 years
Orleans County is one of three counties in Vermont that comprise the Northeast Kingdom, a region known for its dairy farms and spruce, fir, and northern hardwood forests — but also its severe economic problems. The unemployment rate in Orleans County is 4.0%, the highest of any county in Vermont other than neighboring Essex County. An estimated 14.6% of residents live in poverty, also the second highest poverty rate in the state.
While Vermont has one of the highest life expectancies of any state, health outcomes vary throughout the state. The average resident born in Orleans County is projected to live 79.4 years, roughly 11 months less than Vermont’s average.
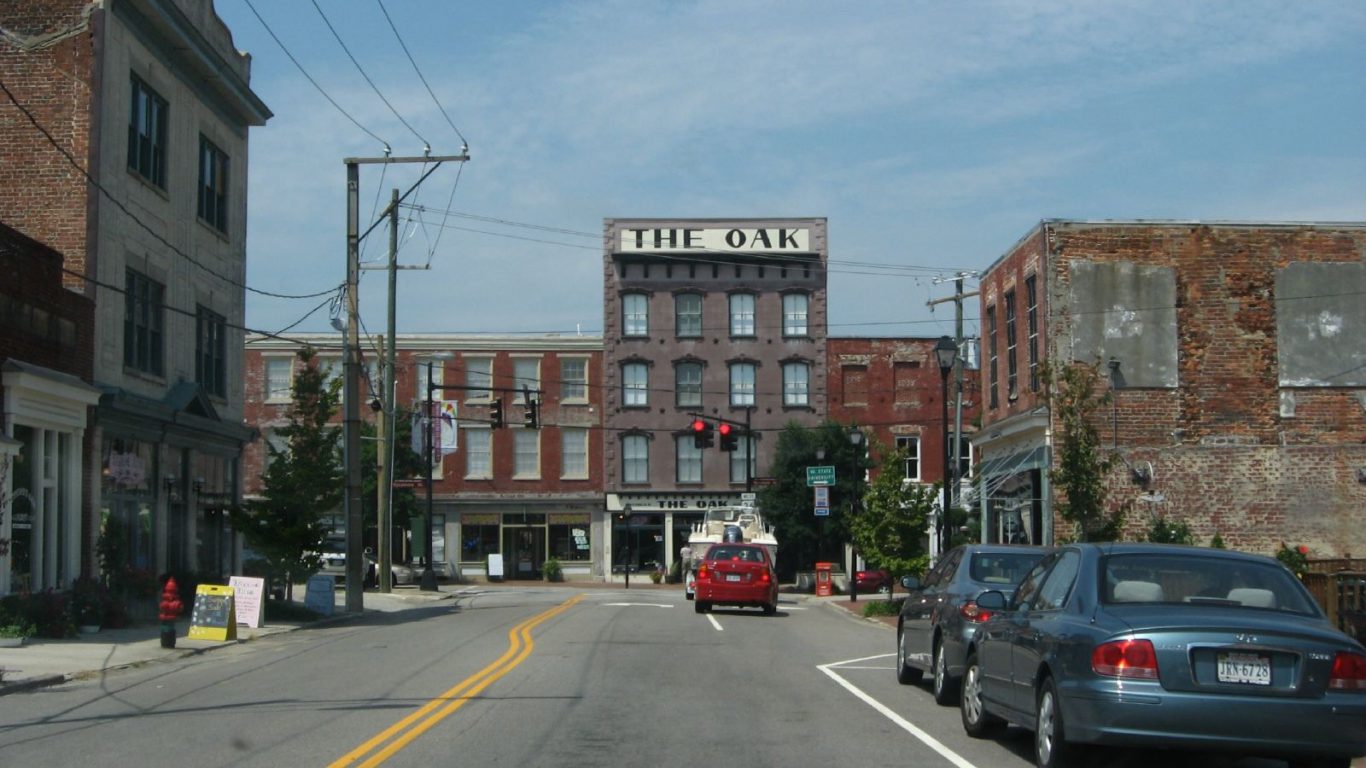
46. Petersburg, Virginia
> 5-yr. population change: -1.1%
> Nov. unemployment rate: 7.1%
> Poverty rate: 29.4%
> Life expectancy at birth: 72.2 years
Virginia is home to districts with very healthy residents and some of the most prosperous counties or county equivalents in the country. The independent city of Petersburg, however, is not one of them. Life expectancy in Petersburg is only 72.2 years, much lower than Virginia’s average of 79.2. Poverty can take a toll on personal health, and in Petersburg 29.4% of the population lives in poverty, a rate that’s nearly the highest for any county or independent city in the state. Widespread poverty is often partly attributable to a poor job market. In November, Petersburg reported an unemployment rate of 7.1%, the highest of any county or county equivalent in the state.
Wealthier counties and independent cities in Virginia tend to be concentrated in the north, clustered around Washington, D.C. Though Petersburg lies within commuting distance of the state capital of Richmond, it is more than 100 miles from the nation’s capital.
[in-text-ad]

47. Adams County, Washington
> 5-yr. population change: +4.4%
> Nov. unemployment rate: 5.3%
> Poverty rate: 23.0%
> Life expectancy at birth: 79.2 years
Adams County’s economy has always been largely dependent upon agriculture and the area is a major producer of wheat, apples, and potatoes. Today roughly 30% of workers in the county are employed in agriculture, forestry, and fishing jobs, the the highest rate of any industry. While the country is also home to a wide array of outdoor recreational venues and has a relatively strong tourism industry, Adams County has one of the weaker job markets in Washington. The county’s unemployment rate is 5.3%, higher than the state’s rate of 4.5%. Adams County also has the lowest college attainment rate, and one of the highest poverty rates in the state. Just 13.8% of adults in the county have a bachelor’s degree, less than half the 33.6% state figure. Additionally, 23% of the county lives in poverty, the third highest rate in Washington.
[recirclink id=433018]
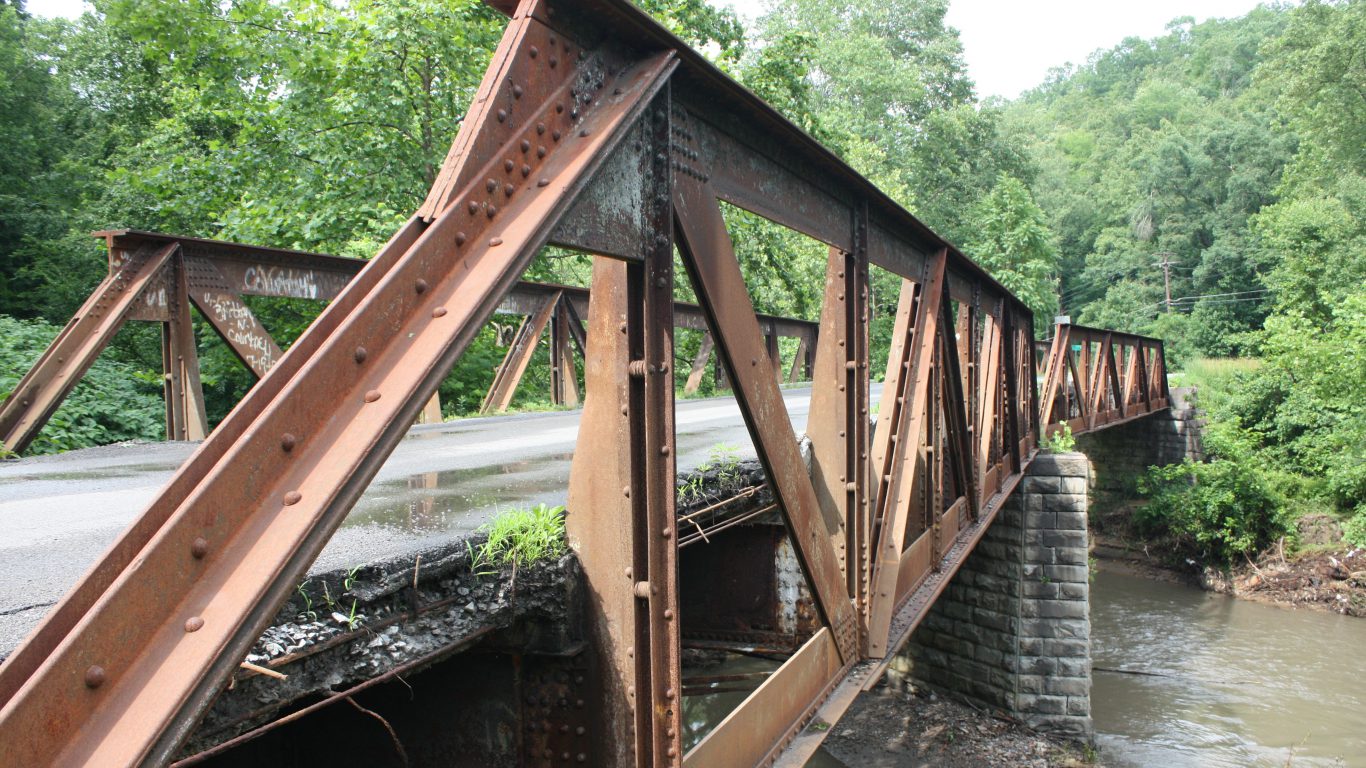
48. McDowell County, West Virginia
> 5-yr. population change: -8.9%
> Nov. unemployment rate: 8.4%
> Poverty rate: 37.6%
> Life expectancy at birth: 70.3 years
West Virginia is one of the poorest states, and McDowell County — which ranks as the worst county in the state — is one of the poorest, least educated, least healthy counties nationwide. While McDowell County was once a leading producer of coal in the first half of the 20th century, the county experienced heavily economic decline and population loss as the industry contracted. McDowell County’s population declined roughly 80% over the past several decades, from a peak of 98,887 in 1950 to just 20,273 today. Just 5.2% of adults in McDowell County have a bachelor’s degree, the smallest share in West Virginia and the fourth smallest share of any county nationwide. The county’s 37.6% poverty rate is also the highest in the state, nearly twice the 17.7% state and 15.1% national poverty rates.
McDowell County also has been heavily affected by the country’s growing opioid epidemic. According to the Centers for Disease Control and Prevention, McDowell County has reported 213 fatal drug overdoses since 2000. This represents the second highest number of any U.S. county when adjusted for population.

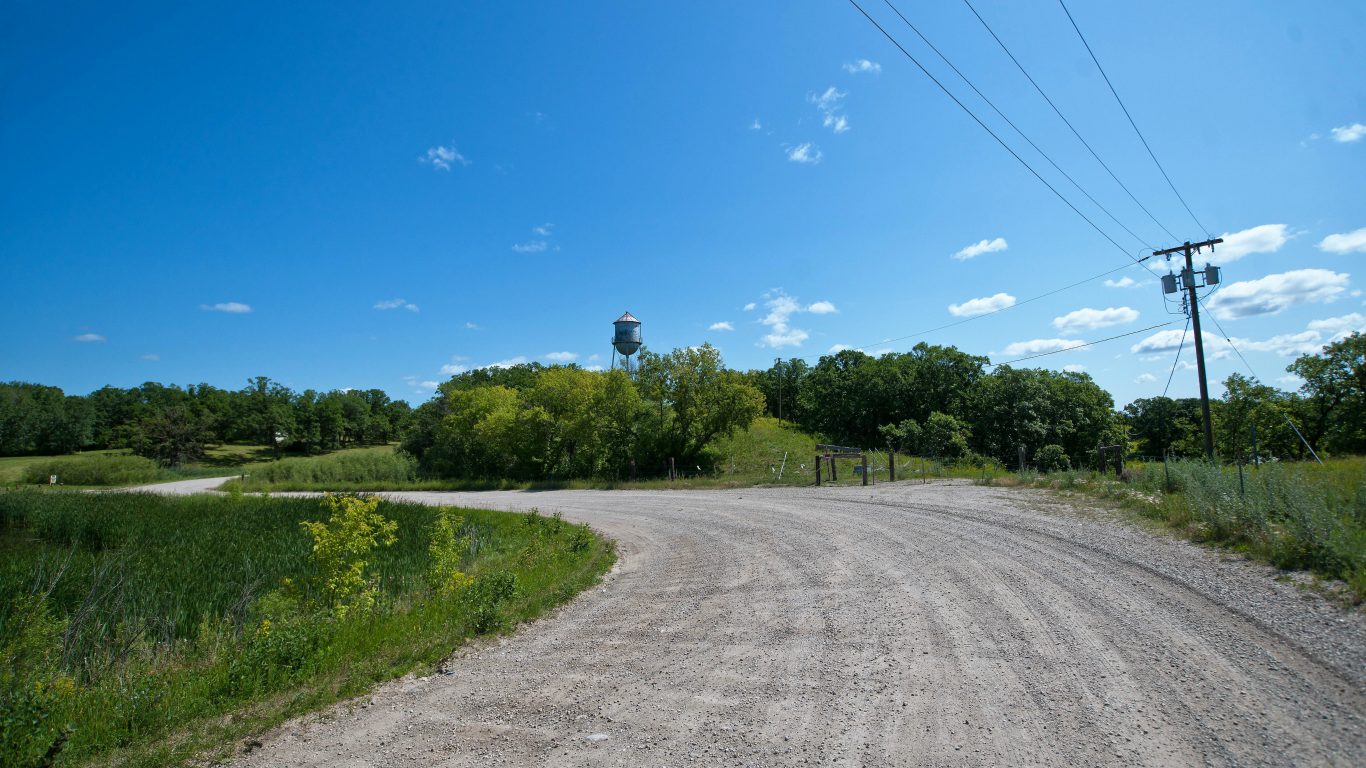
49. Adams County, Wisconsin
> 5-yr. population change: -3.2%
> Nov. unemployment rate: 4.2%
> Poverty rate: 12.7%
> Life expectancy at birth: 77.8 years
Adams County lags behind a majority of Wisconsin counties in a number of measures related to income, education, and health. The typical household in Adams County earns $43,554 a year, more than $11,000 less than the state median of $54,610. One factor contributing to low incomes is likely the low educational attainment of area residents. Just 12.7% of Adams County adults have a bachelor’s degree, the second smallest share of any county in Wisconsin and less than half the state’s 28.4% college-attainment rate.
Income and education are some of the most significant factors that influence health and longevity. Life expectancy in Adams County is just 77.8 years, less than Wisconsin’s average of 79.8 and the nation’s average of 79.1.
[in-text-ad-2]
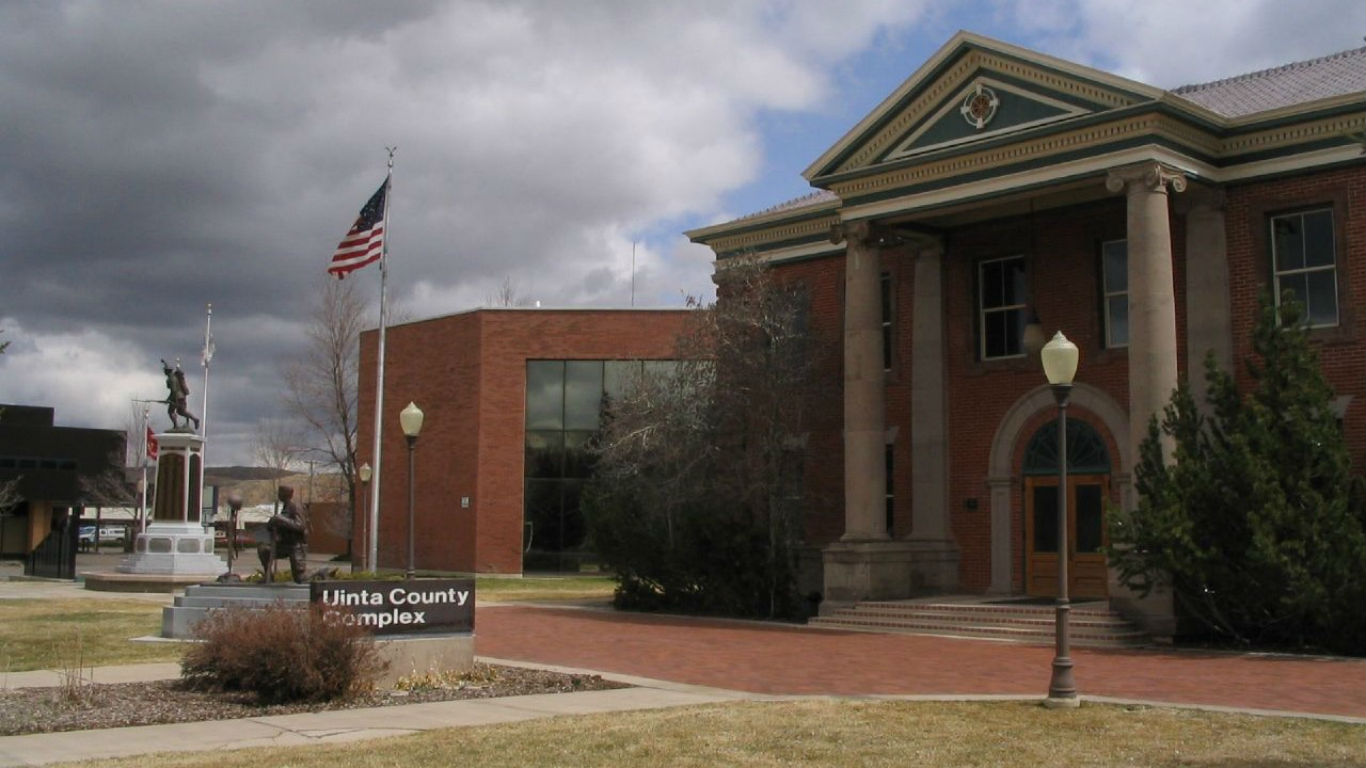
50. Uinta County, Wyoming
> 5-yr. population change: +0.5%
> Nov. unemployment rate: 4.3%
> Poverty rate: 16.8%
> Life expectancy at birth: 77.4 years
While Uinta County experienced a massive increase in population during the 1980s as a result of a decade long oil boom, population growth in the southwestern Wyoming county has largely leveled off in recent years. Over the past five years, Uinta County’s population grew just 0.5%, while the U.S. count increased 3.9%. Sluggish population growth is likely one factor keeping educational attainment low in the area, as fewer college graduates migrate to the county for employment opportunities. Just 18.2% of Uinta County’s adults have a bachelor’s degree, the second smallest share in Wyoming. Additionally, 16.8% of residents live in poverty, also the second highest poverty rate in the state. Education and income are two primary determinants of health, and the life expectancy in Uinta County is just 77.4 years, more than a year less than the state and national figures.
Detailed Findings & Methodology
Certain demographic groups in the United States face a unique set of challenges — and partially as a result, many of the counties on this list are home to high concentrations of these groups. For example, historically, Indian reservations in the United States have been relegated to geographically isolated regions with infertile land and extremely limited economic opportunity. Economic development on reservations is further hindered, as the land is typically owned by the federal government. This means area residents often cannot mortgage their homes for loans the way most American homeowners can.
In eight of the counties on this list, Native Americans account for more than one-third of the population. In Oglala Lakota County, South Dakota — which is entirely within the Pine Ridge Indian Reservation — 93% of the population identifies as Native American and more than half of the county’s residents live in poverty.
Non-English speakers and those who speak English as a second language also face unique challenges in the United States — particularly those in school. According to the nonpartisan think tank Pew Research Center, 73% of Americans identifying as Latino speak Spanish at home. In 10 counties on this list, more than 1 resident in 4 identifies as Hispanic or Latino, well above the 17% share of Americans nationwide.
Low incomes and high poverty rates in the counties on this list do not come out of nowhere. Some counties on this list were once economic powerhouses that declined with the industries they were built upon. For example, McDowell County, West Virginia was a leading producer of coal in the first half of the 20th century. The county experienced a heavy economic decline and population loss, however, as the industry contracted.
Today, McDowell County’s 8.4% unemployment rate is more than double the nation’s corresponding rate. A poor job market is not unusual in many poor counties. All told, 38 counties on this list report higher than typical unemployment.
Poor social and economic conditions do not make a given region a particularly attractive place to live. As a result, over the past five years population growth in 40 of the counties on this list has lagged the growth of their states. In 30 of the counties on this list, the number of residents has declined in the last half a decade.
Contact [email protected] for any questions or corrections.