
[cnxvideo id=”625487″ placement=”ros”]Tying the knot remains one of the most prominent milestones of adult life. Studies continue to demonstrate the benefits of monogamous partnerships, which really should not come as a surprise. Married couples benefit from the basic advantages of economic partnership, including higher tax breaks, lower insurance premiums, more competitive rent applications, and much more. Marital status is a factor determining benefits, rights, and privileges in 1,138 federal regulations.
Despite these advantages, fewer Americans are choosing to get married, and those who do stay single longer compared to previous generations. In fact, more than half of Americans today believe marriage and parenthood are not an important part of becoming an adult, according to the U.S. Census Bureau.
There are more than 110 million single Americans — divorced, widowed, or those who have never married — or approximately 45% of the U.S. adult population. Most of this group consists of people who have never been married.
24/7 Wall St. reviewed in all U.S. metro areas the percentage of the adult population who is single, the concentration of businesses such as restaurants and bars, and income levels in order to determine the best cities for singles. These cities are home to relatively large numbers of unattached people, have plenty of amenities supporting social interaction and a local economy in which financial independence is viable.
Specifically, single people in these cities tend to be the majority, which is the case in 41 of the 50 cities. The cities where this is not the case are either especially affordable, helping to make an independent life financially viable, or have high concentrations of social venues such as bars and restaurants. Of the 50 best cities for singles, 34 are more affordable than the average nationwide. High incomes help offset costs in the relatively unaffordable cities.
Click here to see the 50 best cities for singles.
Click here to see our methodology.

50. Trenton, NJ
> Single population: 51.2% (total 15+ pop.: 304,819)
> Annual personal income: $51,234 (top 10%)
> Cost of living: 12% more than national avg.
[in-text-ad]

49. Duluth, MN-WI
> Single population: 51.3% (total 15+ pop.: 233,419)
> Annual personal income: $42,009
> Cost of living: 9.2% less than national avg.
[recirclink id=440841]

48. Santa Maria-Santa Barbara, CA
> Single population: 53.1% (total 15+ pop.: 356,859)
> Annual personal income: $46,849 (top 25%)
> Cost of living: 9.4% more than national avg.

47. Santa Cruz-Watsonville, CA
> Single population: 54.3% (total 15+ pop.: 225,761)
> Annual personal income: $43,751
> Cost of living: 22.0% more than national avg.
[in-text-ad-2]

46. Buffalo-Cheektowaga-Niagara Falls, NY
> Single population: 53.4% (total 15+ pop.: 943,915)
> Annual personal income: $44,581
> Cost of living: 6.1% less than national avg.

45. Madison, WI
> Single population: 49.7% (total 15+ pop.: 520,590)
> Annual personal income: $49,306 (top 10%)
> Cost of living: 2.2% less than national avg.
[in-text-ad]

44. New York-Newark-Jersey City, NY-NJ-PA
> Single population: 51.8% (total 15+ pop.: 16,369,264)
> Annual personal income: $48,703 (top 10%)
> Cost of living: 21.9% more than national avg.
[recirclink id=440491]

43. College Station-Bryan, TX
> Single population: 58.1% (total 15+ pop.: 200,427)
> Annual personal income: $35,054 (bottom 10%)
> Cost of living: 6.5% less than national avg.

42. Burlington-South Burlington, VT
> Single population: 51.5% (total 15+ pop.: 181,360)
> Annual personal income: $46,264 (top 25%)
> Cost of living: 3.2% more than national avg.
[in-text-ad-2]

41. Danville, IL
> Single population: 52.4% (total 15+ pop.: 63,687)
> Annual personal income: $40,485
> Cost of living: 18.8% less than national avg.
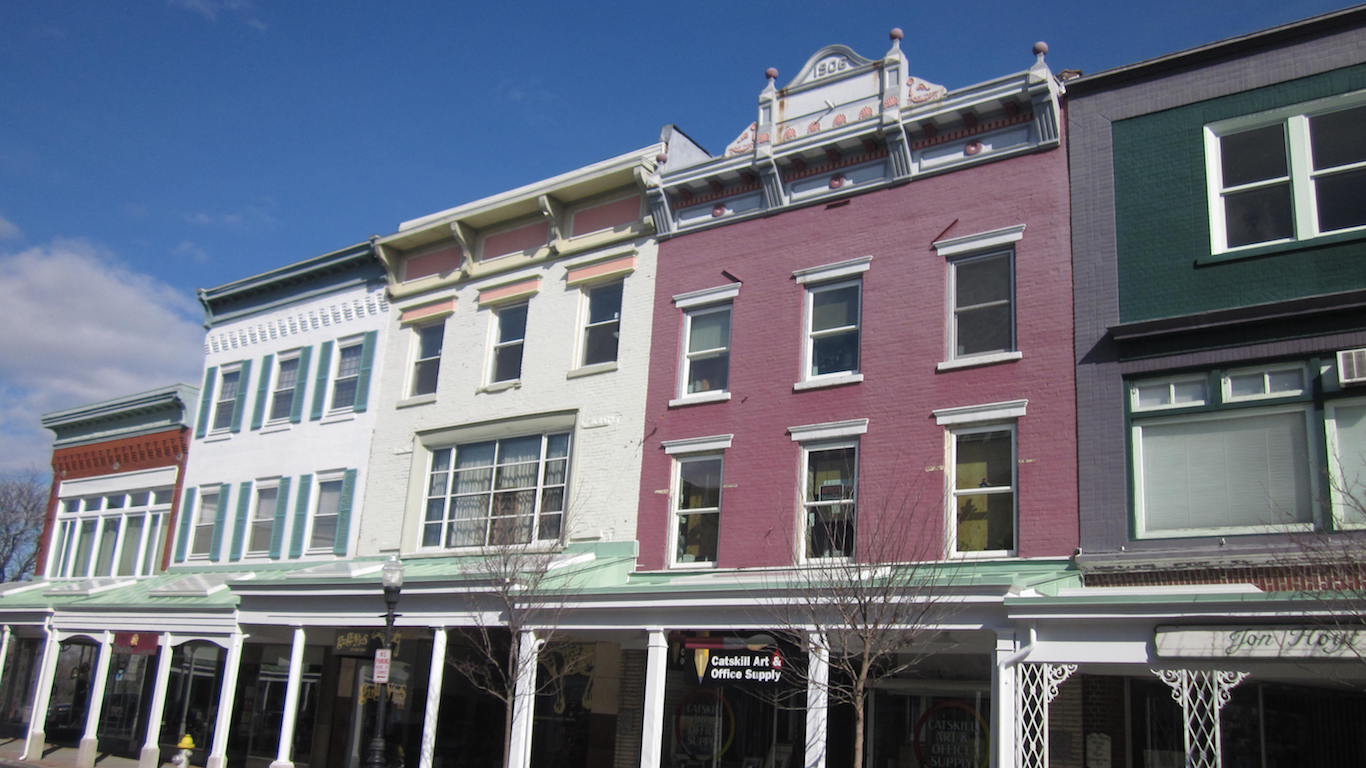
40. Kingston, NY
> Single population: 50.9% (total 15+ pop.: 153,266)
> Annual personal income: $39,165
> Cost of living: 3.6% more than national avg.
[in-text-ad]

39. Greenville, NC
> Single population: 57.3% (total 15+ pop.: 142,762)
> Annual personal income: $38,552
> Cost of living: 11.6% less than national avg.
[recirclink id=440495]

38. Muncie, IN
> Single population: 57.0% (total 15+ pop.: 98,436)
> Annual personal income: $34,275 (bottom 10%)
> Cost of living: 11.4% less than national avg.

37. Barnstable Town, MA
> Single population: 45.5% (total 15+ pop.: 187,157)
> Annual personal income: $57,683 (top 10%)
> Cost of living: 2.5% more than national avg.
[in-text-ad-2]

36. Cumberland, MD-WV
> Single population: 53.4% (total 15+ pop.: 85,504)
> Annual personal income: $38,461
> Cost of living: 12.3% less than national avg.

35. Decatur, IL
> Single population: 51.1% (total 15+ pop.: 88,219)
> Annual personal income: $46,235 (top 25%)
> Cost of living: 12.4% less than national avg.
[in-text-ad]

34. Dubuque, IA
> Single population: 45.7% (total 15+ pop.: 77,891)
> Annual personal income: $44,357
> Cost of living: 7.7% less than national avg.
[recirclink id=440072]

33. Iowa City, IA
> Single population: 53.3% (total 15+ pop.: 135,224)
> Annual personal income: $44,883 (top 25%)
> Cost of living: 3.8% less than national avg.

32. San Francisco-Oakland-Hayward, CA
> Single population: 50.1% (total 15+ pop.: 3,795,184)
> Annual personal income: $61,178 (top 10%)
> Cost of living: 21.9% more than national avg.
[in-text-ad-2]
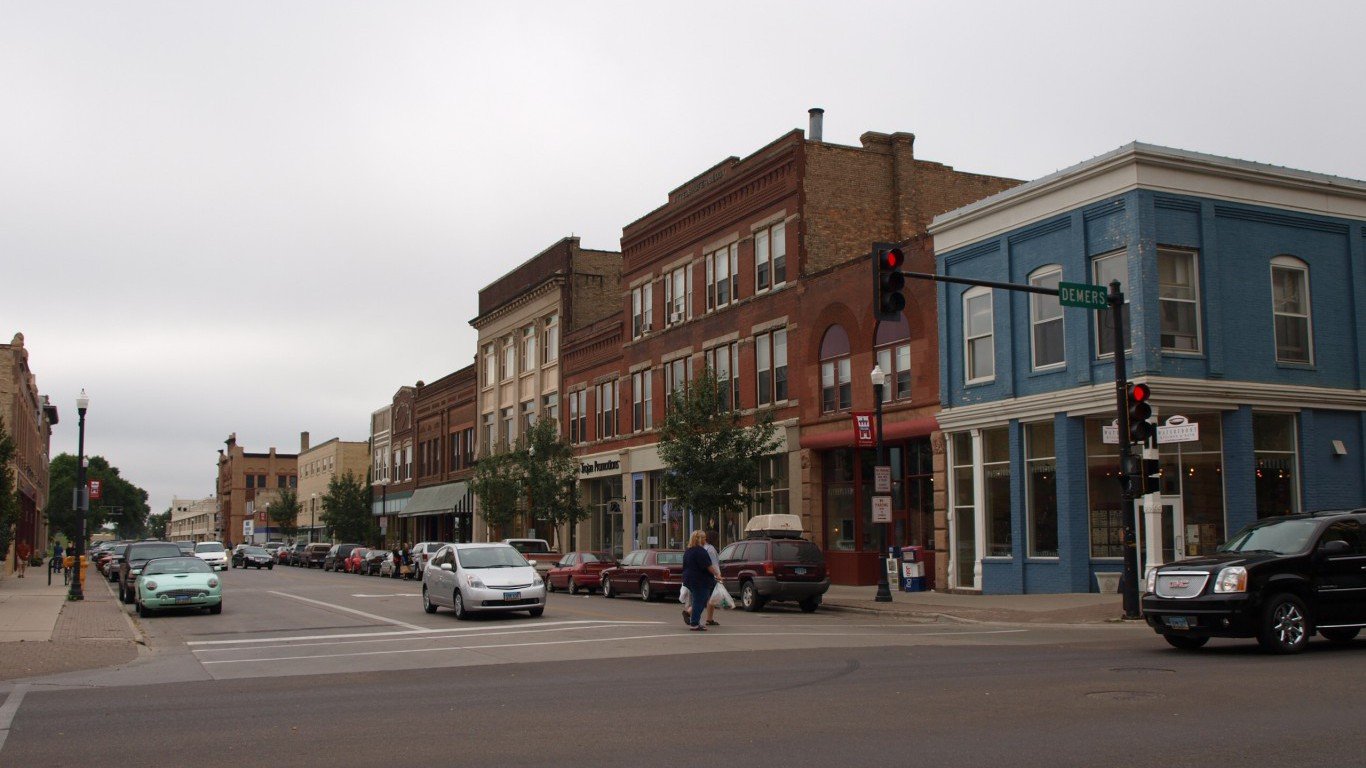
31. Grand Forks, ND-MN
> Single population: 50.9% (total 15+ pop.: 82,989)
> Annual personal income: $44,778 (top 25%)
> Cost of living: 5.9% less than national avg.

30. Boston-Cambridge-Newton, MA-NH
> Single population: 51.2% (total 15+ pop.: 3,928,547)
> Annual personal income: $57,204 (top 10%)
> Cost of living: 10.3% more than national avg.
[in-text-ad]

29. Springfield, MA
> Single population: 56.8% (total 15+ pop.: 523,509)
> Annual personal income: $43,756
> Cost of living: 2.7% less than national avg.
[recirclink id=440483]

28. Eau Claire, WI
> Single population: 49.4% (total 15+ pop.: 135,691)
> Annual personal income: $42,682
> Cost of living: 8.3% less than national avg.

27. Mankato-North Mankato, MN
> Single population: 52.9% (total 15+ pop.: 81,714)
> Annual personal income: $44,421
> Cost of living: 10.8% less than national avg.
[in-text-ad-2]

26. Ocean City, NJ
> Single population: 45.4% (total 15+ pop.: 81,488)
> Annual personal income: $45,724 (top 25%)
> Cost of living: 6.8% more than national avg.

25. Columbia, MO
> Single population: 55.0% (total 15+ pop.: 142,745)
> Annual personal income: $42,472
> Cost of living: 7.8% less than national avg.
[in-text-ad]

24. Tallahassee, FL
> Single population: 59.1% (total 15+ pop.: 315,746)
> Annual personal income: $37,204 (bottom 25%)
> Cost of living: 6.7% less than national avg.
[recirclink id=440394]

23. Missoula, MT
> Single population: 53.4% (total 15+ pop.: 94,491)
> Annual personal income: $41,239
> Cost of living: 4.0% less than national avg.

22. Oshkosh-Neenah, WI
> Single population: 51.1% (total 15+ pop.: 140,024)
> Annual personal income: $42,869
> Cost of living: 8.7% less than national avg.
[in-text-ad-2]

21. New Orleans-Metairie, LA
> Single population: 56.0% (total 15+ pop.: 1,014,317)
> Annual personal income: $45,972 (top 25%)
> Cost of living: 4.4% less than national avg.

20. Fargo, ND-MN
> Single population: 51.3% (total 15+ pop.: 184,523)
> Annual personal income: $49,271 (top 10%)
> Cost of living: 7.1% less than national avg.
[in-text-ad]

19. La Crosse-Onalaska, WI-MN
> Single population: 50.8% (total 15+ pop.: 113,131)
> Annual personal income: $44,201
> Cost of living: 7.1% less than national avg.
[recirclink id=440150]

18. Champaign-Urbana, IL
> Single population: 56.7% (total 15+ pop.: 198,298)
> Annual personal income: $41,878
> Cost of living: 6.1% less than national avg.

17. Athens-Clarke County, GA
> Single population: 58.2% (total 15+ pop.: 166,172)
> Annual personal income: $35,700 (bottom 25%)
> Cost of living: 8.4% less than national avg.
[in-text-ad-2]

16. Ann Arbor, MI
> Single population: 55.1% (total 15+ pop.: 300,415)
> Annual personal income: $46,290 (top 25%)
> Cost of living: 1.9% more than national avg.

15. Sebastian-Vero Beach, FL
> Single population: 46.4% (total 15+ pop.: 124,686)
> Annual personal income: $69,323 (top 10%)
> Cost of living: 8.5% less than national avg.
[in-text-ad]

14. Boulder, CO
> Single population: 51.9% (total 15+ pop.: 261,600)
> Annual personal income: $52,245 (top 10%)
> Cost of living: 10.1% more than national avg.
[recirclink id=440088]

13. Ames, IA
> Single population: 58.1% (total 15+ pop.: 81,248)
> Annual personal income: $38,544
> Cost of living: 8.7% less than national avg.

12. Bloomington, IN
> Single population: 60.9% (total 15+ pop.: 141,516)
> Annual personal income: $34,399 (bottom 10%)
> Cost of living: 5.4% less than national avg.
[in-text-ad-2]

11. Flagstaff, AZ
> Single population: 58.2% (total 15+ pop.: 113,254)
> Annual personal income: $38,605
> Cost of living: 1.4% less than national avg.

10. State College, PA
> Single population: 58.3% (total 15+ pop.: 139,070)
> Annual personal income: $36,388 (bottom 25%)
> Cost of living: 2.1% more than national avg.
[in-text-ad]

9. Gainesville, FL
> Single population: 60.7% (total 15+ pop.: 232,149)
> Annual personal income: $38,543
> Cost of living: 5.4% less than national avg.
[recirclink id=439690]

8. Carson City, NV
> Single population: 54.3% (total 15+ pop.: 45,129)
> Annual personal income: $41,812
> Cost of living: 4.7% less than national avg.

7. Casper, WY
> Single population: 48.1% (total 15+ pop.: 64,467)
> Annual personal income: $67,398 (top 10%)
> Cost of living: 1.9% less than national avg.
[in-text-ad-2]

6. Morgantown, WV
> Single population: 57.3% (total 15+ pop.: 117,040)
> Annual personal income: $39,547
> Cost of living: 8.7% less than national avg.

5. Pittsfield, MA
> Single population: 53.1% (total 15+ pop.: 110,165)
> Annual personal income: $48,865 (top 10%)
> Cost of living: 4.9% less than national avg.
[in-text-ad]

4. Bridgeport-Stamford-Norwalk, CT
> Single population: 47.8% (total 15+ pop.: 760,540)
> Annual personal income: $80,616 (top 10%)
> Cost of living: 20.1% more than national avg.
[recirclink id=439852]

3. Lawrence, KS
> Single population: 59.6% (total 15+ pop.: 97,852)
> Annual personal income: $38,255
> Cost of living: 6.8% less than national avg.

2. Ithaca, NY
> Single population: 61.6% (total 15+ pop.: 91,251)
> Annual personal income: $35,564 (bottom 10%)
> Cost of living: 5.2% more than national avg.
[in-text-ad-2]

1. Midland, TX
> Single population: 45.3% (total 15+ pop.: 122,959)
> Annual personal income: $102,217 (top 10%)
> Cost of living: 0.5% more than national avg.
Methodology
To identify the 50 best cities for singles, 24/7 Wall St. created an index of three components measuring the presence of adult unattached residents, access to datelife, and the viability of financial independence.
1) The percentage of each city’s 15 and over population who are single — divorced, widowed, or never married — came from the U.S. Census Bureau’s 2016 American Community Survey. This does not include people who are separated but still married. Data are five year averages through 2016. 2) The concentration of social establishments, including theaters, fitness and recreational facilities, full-service restaurants, bars, amusement parks, and zoos were adjusted per 100,000 city residents and came from 2015 County Business Patterns, published by the Census Bureau. 3) Annual personal income figures for each city are for 2015, adjusted to the cost of living, and came from the Bureau of Economic Analysis.
We also reviewed additional federal data such as the percentage of each state’s workforce that is employed in certain industries, poverty rates, and the percentage of area adults with at least a bachelor’s degree — also five year average estimated from the 2016 ACS. Regional price parities, or cost of living, came from the BEA. All data is for the most recent available period.
Contact [email protected] for any questions or corrections.