
[cnxvideo id=”506324″ placement=”ros”]In December, President Trump signed into law the Tax Cuts and Jobs Act, which was notable for giving substantial breaks to American businesses. Included in the act was a significant cut in the maximum federal business tax rate, reducing it from 35% to 21%.
Regardless of the implications of this new bill for low-and middle-income Americans and for the programs that may soon lack funding, the tax cuts were unquestionably good news for American business in what has already been a boom time for many companies. Despite a sell off earlier in the year, the Dow Jones Industrial Average is near record highs, The economy has added jobs for 87 straight months, and GDP has grown for seven straight years.
This period of prosperity has by no means been even across the country. While GDP grew by an aggregate annual rate of 1.5% over the past five years, it declined in seven states, including by more than 5% in Alaska.
A number of factors can explain the regional differences in economic growth, including the varying business climates across states. While many factors affect the success of a region’s businesses, socioeconomic conditions, differences in geography, and regional regulations contribute to an overall business environment. Depending on these conditions, running a successful business in one state can be much easier than in another.
To determine which states have the best and worst business climates, 24/7 Wall St. identified and reviewed nearly 50 measures of doing business. These were divided into eight major categories: economic conditions, business costs, state infrastructure, the availability and skill level of the workforce, quality of life, regulations, technology and innovation, and cost of living.
A number of region-specific policies, costs, and regulations affect a state’s business climate, including liability and oversight laws, utility costs, insurance requirements, and tax policy.
Correction: A previous version of this piece incorrectly listed some changes in working-age population. These errors have been corrected.
Click here to see the best and worst states for business.
Click here to see our methodology.

1. Massachusetts
> 1-yr. real GDP change: +1.5% (21st largest growth)
> Avg. salary: $65,971 (2nd highest)
> Adults w/ bachelor’s degree: 42.7 (the highest)
> Patents issued: 99.5 (2nd most)
> Working-age population chg. 2010-2020: +2.7% (9th smallest growth)
A well-educated population can be a boon for state businesses. Such a population presents a more flexible and skilled talent pool for employers. Also, people with college educations tend to have higher incomes, which means they have more disposable income to spend. A nation-leading 42.7% of Massachusetts adults have a bachelor’s degree, compared to 31.3% of adults nationwide. The typical state household earns $75,297 a year, the fourth highest median income of any state and over $17,000 greater than the national median.
Businesses can often benefit from clustering — the close proximity of research institutions and businesses in STEM fields. Clustering results in greater access to the latest technology and other tech innovators as well as, often, high patent output. The greater Boston area is the site of such clustering, as can be seen in the statewide figures. Massachusetts enterprises were awarded more than 6,700 patents in 2015, or almost 100 patents per 100,000 state residents, the second most patents per capita in the country.
[in-text-ad]
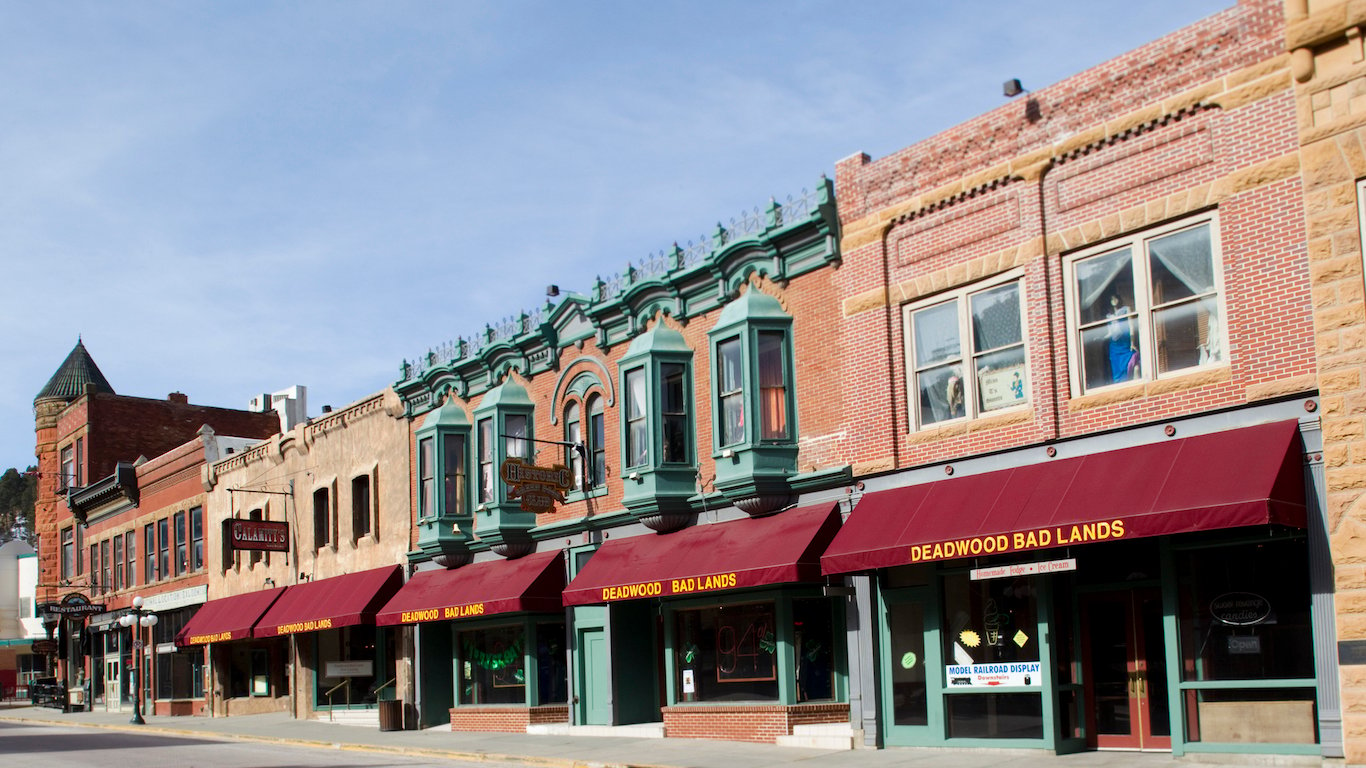
2. South Dakota
> 1-yr. real GDP change: +0.7% (11th smallest growth)
> Avg. salary: $40,724 (3rd lowest)
> Adults w/ bachelor’s degree: 28.9 (tied — 22nd lowest)
> Patents issued: 13.1 (8th fewest)
> Working-age population chg. 2010-2020: +10.3% (8th largest growth)
Of the eight best states for business, all but one have a median household incomes of at least $65,000 a year. The one exception is South Dakota, where the typical household earns $54,467 a year. The state makes up for its lack of an affluent consumer base in part by being an inexpensive state to do business. With goods and services costing an average of 88.2 cents to the dollar, the state has the fourth lowest cost of living. The state also has a favorable regulatory framework for business. According to the Census’ American Survey of Entrepreneurs, South Dakota businesses are the least likely in the country to be negatively affected by poor access to capital or by the state’s tax structure.
[recirclink id=440841]

3. Utah
> 1-yr. real GDP change: +3.7% (3rd largest growth)
> Avg. salary: $46,178 (19th lowest)
> Adults w/ bachelor’s degree: 32.6 (17th highest)
> Patents issued: 46.0 (13th most)
> Working-age population chg. 2010-2020: +15.1% (3rd largest growth)
One sign of a state’s favorability to business is the projected growth of its potential labor force. More potential workers is both a sign of good economic growth, as well as a benefit to employers, who will be able to draw from a larger talent pool. Based on current growth rates, the working-age population in Utah will grow by an estimated 15.1% between 2020 and 2030, the third largest growth during that period of any state. Much of the state’s population growth is likely also the result of growth in STEM jobs in the greater Salt Lake City region. An estimated 6% of Utah’s jobs are in STEM fields, one of the higher shares of any state. State GDP has grown by 3.7% in the last year alone, more than double national GDP growth rate and the third largest of any state.
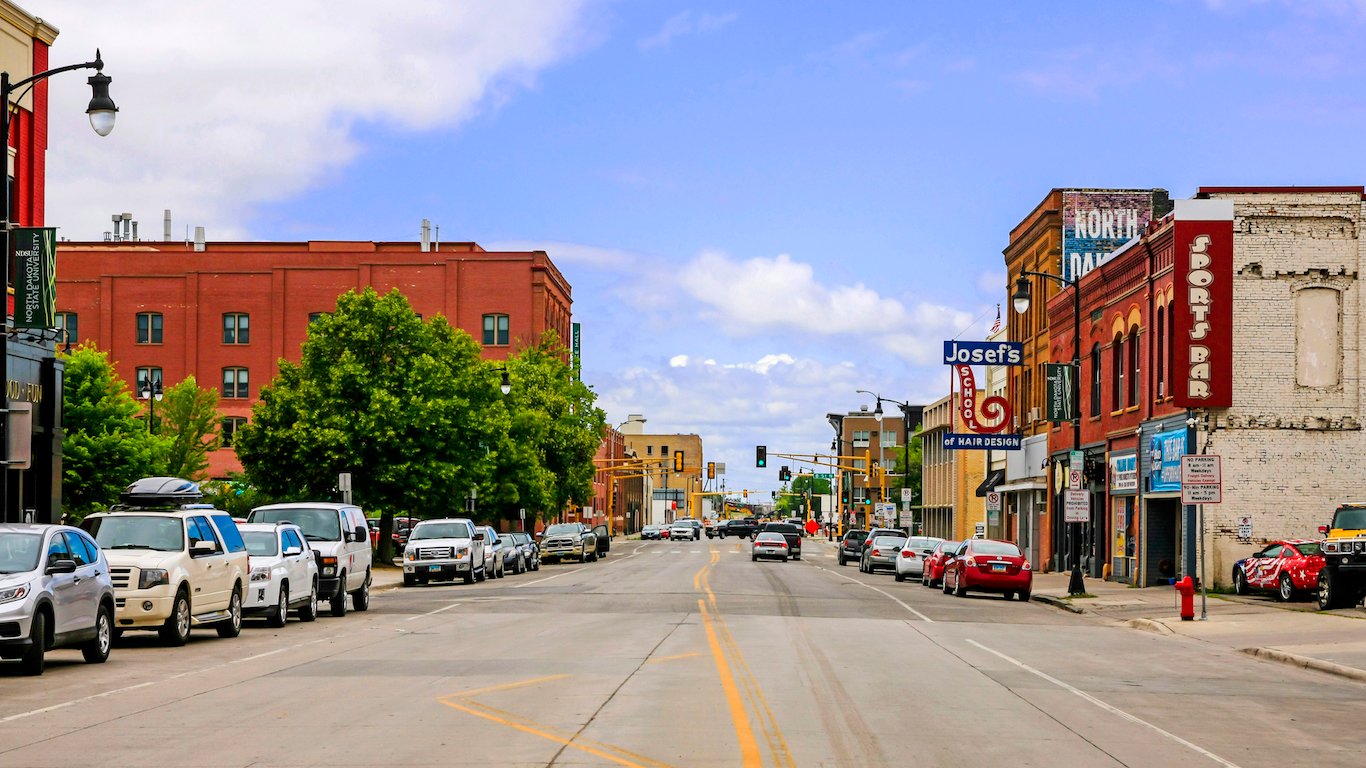
4. North Dakota
> 1-yr. real GDP change: -5.0% (2nd largest decrease)
> Avg. salary: $48,151 (24th lowest)
> Adults w/ bachelor’s degree: 29.6 (tied — 25th lowest)
> Patents issued: 15.6 (14th fewest)
> Working-age population chg. 2010-2020: +33.2% (the largest growth)
North Dakota ranks as one of the least least expensive place to operate a business. Goods and services in the state are less expensive compared to the national average, and property ownership is among the most affordable in the country. In the American Survey of Entrepreneurs, state businesses are among the least likely of their kind to report a negative impact from a lack of access to capital or from the state’s tax structure.
Until the downturn in oil prices in 2014, North Dakota’s oil industry was booming — and taking the entire state economy along with it. Between 2011 and 2016, the state economy grew at a nation-leading annualized rate of 4.4% per year. Over that period, unemployment averaged just 2.8%, by far the lowest of any state. However, with the recent slowdown, North Dakota’s position on this ranking is in serious jeopardy. The state economy contracted by 5% in 2016, the second worst of any state.
[in-text-ad-2]

5. Colorado
> 1-yr. real GDP change: +1.1% (18th smallest growth)
> Avg. salary: $55,449 (11th highest)
> Adults w/ bachelor’s degree: 39.9 (2nd highest)
> Patents issued: 55.0 (10th most)
> Working-age population chg. 2010-2020: +10.5% (7th largest growth)
In Colorado, 7.4% of all jobs are in science, technology, engineering, or mathematics, the fourth highest share of any state. A high concentration of STEM workers in a state can point to favorable conditions for businesses in several ways. STEM workers tend to have higher incomes, which means they have more disposable income to spend locally. The median household income in Colorado of $65,685 a year is over $8,000 higher than the typical American household income.
A high concentration of STEM jobs can also mean there is a greater potential for innovation and growth in a region, which can create new business and benefit existing companies. Colorado had 255 venture capital deals — a sign of business innovation and growth — in 2016, the sixth most of any state.

6. New Hampshire
> 1-yr. real GDP change: +1.6% (17th largest growth)
> Avg. salary: $52,747 (15th highest)
> Adults w/ bachelor’s degree: 36.6 (7th highest)
> Patents issued: 63.7 (6th most)
> Working-age population chg. 2010-2020: -3.9% (6th largest decrease)
Those living in poverty are far less likely to have disposable income to spend on nonessential consumer goods, and so places with a low concentration of poverty are more likely to have plenty of paying customers. In New Hampshire, just 7.3% of the population lives in poverty — the lowest rate in the country. Part of the reason for this low poverty rate is that a very small share of New Hampshire’s labor force cannot find work. The state’s annual unemployment rate of just 2.8% is the lowest in the country. New Hampshire’s low unemployment is also is a sign businesses are doing well.
[in-text-ad]

7. Minnesota
> 1-yr. real GDP change: +2.1% (13th largest growth)
> Avg. salary: $53,445 (13th highest)
> Adults w/ bachelor’s degree: 34.8 (11th highest)
> Patents issued: 79.6 (4th most)
> Working-age population chg. 2010-2020: +3.6% (11th smallest growth)
Less than 10% of the Minnesota population lives in poverty, the fifth lowest rate among states. This low poverty rate indicates the state’s businesses are more likely to have interested and paying customers.
According to the American Survey of Entrepreneurs, state businesses are among the least likely to report a negative impact on sales from slow business, lost sales, and late or non-paying customers. Like many states on this list, Minnesota has a substantial STEM sector, which coincides with a high issuance rate for patents.
[recirclink id=440491]

8. Washington
> 1-yr. real GDP change: +4.2% (the largest growth)
> Avg. salary: $58,977 (7th highest)
> Adults w/ bachelor’s degree: 35.1 (10th highest)
> Patents issued: 87.5 (3rd most)
> Working-age population chg. 2010-2020: +9.7% (9th largest growth)
Rapid economic growth is not always favorable for businesses in the long term, as they can lead to an economic bubble and long-term crisis for regional enterprise. However, growth can often be sustained, and in the short term, it is a positive sign for a region’s economy. Washington state has one of the fastest growing economies in the country, with a nation-leading 4.2% GDP growth in 2016. With companies such as Microsoft and Amazon operating in the state, there has also been a great deal of innovation in Washington. Over 87 patents are issued per 100,000 state residents in a year, the third most of any state.

9. Vermont
> 1-yr. real GDP change: +0.7% (12th smallest growth)
> Avg. salary: $44,089 (11th lowest)
> Adults w/ bachelor’s degree: 36.4 (8th highest)
> Patents issued: 72.2 (5th most)
> Working-age population chg. 2010-2020: -5.4% (3rd largest decrease)
The presence of violent crime can drive residents out of a given area and hamper businesses’ ability to thrive. One of the safest states in the country, Vermont’s violent crime rate of 158 incidents per 100,000 residents is less than half the U.S. violent crime rate of 386 per 100,000. The state also ranks relatively well for its capacity for innovate. There were about 72 patents issued in the state for every 100,000 residents in 2015, more than in all but four other states.
Educated populations can be a draw for companies requiring skilled workers, and Vermont’s population is one of the best educated of any state. Among adults in the state, 36.4% have at least a bachelor’s degree and 15.2% a graduate or professional degree — each among the 10 highest shares in the country.
[in-text-ad-2]

10. Virginia
> 1-yr. real GDP change: +0.5% (7th smallest growth)
> Avg. salary: $56,319 (10th highest)
> Adults w/ bachelor’s degree: 38.1 (6th highest)
> Patents issued: 24.5 (22nd fewest)
> Working-age population chg. 2010-2020: +7.8% (14th largest growth)
A well-educated workforce can make a region especially attractive to potential employers — and Virginia has one of the best educated populations of any state. In Virginia, 38.1% of adults have a bachelor’s degree or higher, well above the 31.3% of adults who do in the United States as a whole and a larger share than in the vast majority of states.
A low crime rate further contributes to Virginia’s appeal to new and relocating businesses. A high incidence of violent crime can drive top talent as well as potential customers out of a given region, and there were just 218 violent crimes for every 100,000 people in Virginia in 2016, the fourth lowest violent crime rate of any state. Virginia’s population is also more likely to have more disposable income than most Americans, which in turn can drive up consumer spending. The typical household in the state earned $68,114 in 2016, over $10,000 more than the typical American household.

11. Idaho
> 1-yr. real GDP change: +2.7% (7th largest growth)
> Avg. salary: $40,505 (2nd lowest)
> Adults w/ bachelor’s degree: 27.6 (15th lowest)
> Patents issued: 51.4 (12th most)
> Working-age population chg. 2010-2020: +9.6% (10th largest growth)
By several measures, Idaho’s economy is relatively strong. The state reported a 2.7% GDP growth between 2015 and 2016, a stronger growth rate than all but six other states. Additionally, just 3.8% of the state’s labor force were out of work in 2016 compared to 4.9% of the U.S. labor force. Idaho’s low crime is another factor making the state attractive to business. A high violent crime rate can contribute to a stagnant economy and economic drag, and Idaho is a relatively safe state. There were 230 violent crimes for every 100,000 people in Idaho in 2016 compared to the comparable U.S. rate of 386 per 100,000.
Business costs across Idaho are generally low. Commercial electricity per kilowatt hour in Idaho averaged only 7.4 cents per kWh in 2016, well below the national cost of 10.4 cents per kWh. Additionally, the average cost of commercial real estate in Idaho is lower than in most states.
[in-text-ad]
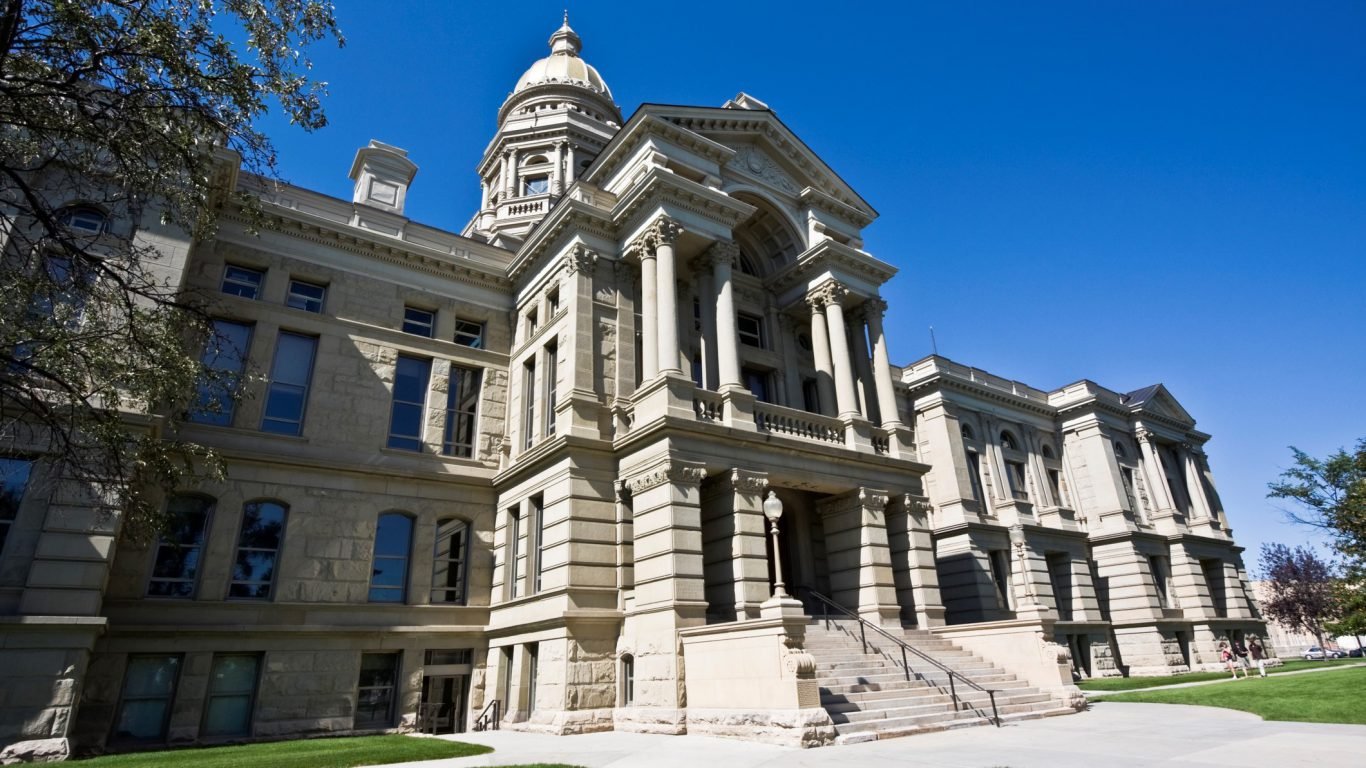
12. Wyoming
> 1-yr. real GDP change: -1.8% (4th largest decrease)
> Avg. salary: $46,147 (18th lowest)
> Adults w/ bachelor’s degree: 27.1 (11th lowest)
> Patents issued: 18.8 (17th fewest)
> Working-age population chg. 2010-2020: +9.5% (11th largest growth)
One factor that helps make Wyoming one of the most business-friendly states in the country is its strong infrastructure. Just 2.4% of roads in the states are in poor condition according to the Federal Highway Administration, the ninth smallest share nationwide. Quality roads likely help reduce congestion. Trucking plays a relatively large role in Wyoming’s economy, and in 2016, the trucking industry lost less revenue due to congestion per mile than in nearly any other state. Clear roads benefit all workers in the state. Workers spend just 16.9 minutes on average commuting to work — the second shortest commute of any state.
Wyoming also outranks a majority of states in education spending and outcomes. This can help attract advanced industries to the state. Wyoming spent an average of $17,700 per student in public education in 2015 — over $5,000 more than the national average per-student spending. An estimated 93.2% of adults in the state have a high school diploma, the largest share of any state.
[recirclink id=440495]

13. Texas
> 1-yr. real GDP change: -0.3% (7th largest decrease)
> Avg. salary: $53,838 (12th highest)
> Adults w/ bachelor’s degree: 28.9 (tied — 22nd lowest)
> Patents issued: 35.7 (18th most)
> Working-age population chg. 2010-2020: +14.9% (4th largest growth)
Like North Dakota and a few other oil-producing states, Texas’ economy has taken a beating from the now over three years long stretch of depressed crude oil prices. However, the state’s economy is more diverse than that of North Dakota, and GDP has contracted by just 0.3% in the most recently reported year. Credit agencies Moody’s and Standard & Poor’s clearly recognize the state’s stability and rate its debt a perfect AAA and Aaa, respectively, with a stable outlook.
The state’s businesses not only benefit from a stable economy, but also from a growing labor force. Texas’ working age population is projected to grow by 14.9% between 2020 and 2030, the fourth most of any state.

14. Maryland
> 1-yr. real GDP change: +2.5% (9th largest growth)
> Avg. salary: $59,606 (6th highest)
> Adults w/ bachelor’s degree: 39.3 (3rd highest)
> Patents issued: 30.5 (25th fewest)
> Working-age population chg. 2010-2020: +6.5% (19th largest growth)
In Maryland, 39.3% of adults have at least a bachelor’s degree, and 18.5% of adults have a graduate or professional degree — respectively the third and second largest shares of any state. A highly-educated workforce can help attract advanced, high-paying industries to a given state. In Maryland, 8.3% of workers are employed in a STEM field, the largest share in the country.
In addition to its deep talent pool, another factor making Maryland a business-friendly state is its rapid economic growth. The state’s real GDP grew 2.5% in 2016, far greater than the 1.5% national growth rate. Maryland is also one of just 11 states with a triple-A rating and stable outlook from both Moody’s and S&P.
[in-text-ad-2]

15. California
> 1-yr. real GDP change: +3.3% (4th largest growth)
> Avg. salary: $63,409 (4th highest)
> Adults w/ bachelor’s degree: 32.9 (14th highest)
> Patents issued: 102.4 (the most)
> Working-age population chg. 2010-2020: +3.0% (10th smallest growth)
A highly innovative business environment has wide-reaching positive effects on new business growth as well as on existing businesses. California, home to Silicon Valley, the American tech industry’s stronghold, is home to by far the most patents and venture capital deals. Even when adjusted for inflation, there are over 100 patents issued to California enterprises per 100,000 residents, well more than double the national figure. There were 2,801 venture capital deals in California in 2016 — more than 44 other states combined.
Equality has been shown to have wide-reaching positive impacts on workers and employers alike. In California, women earn 88 cents for every dollar men earn, the second smallest gender earnings gap in the country.

16. Connecticut
> 1-yr. real GDP change: +0.0% (the smallest growth)
> Avg. salary: $64,904 (3rd highest)
> Adults w/ bachelor’s degree: 38.6 (tied — 4th highest)
> Patents issued: 60.3 (7th most)
> Working-age population chg. 2010-2020: -0.6% (12th largest decrease)
Americans with higher educational attainment are often more attractive candidates for prospective employers — and Connecticut has one of the best educated populations in the country. Of all adults in the state, 38.6% have at least a bachelor’s degree and 16.7% have a graduate or professional degree — the fourth and third largest shares of any state, respectively.
Not only does a well educated population make for a more desirable workforce, but also such a population tends to earn more. The typical household in Connecticut makes $73,433 a year, more than in all but five other states. Higher incomes often mean residents have more disposable income, which can drive up consumer spending — a boon for local businesses.
[in-text-ad]

17. Florida
> 1-yr. real GDP change: +2.4% (11th largest growth)
> Avg. salary: $48,522 (23rd highest)
> Adults w/ bachelor’s degree: 28.6 (19th lowest)
> Patents issued: 19.7 (19th fewest)
> Working-age population chg. 2010-2020: +12.5% (5th largest growth)
One factor contributing to Florida’s business-friendly climate is the state’s growing population. The number of working-age adults in Florida is projected to grow 12.5% from 2020 to 2030, nearly three times the national growth projection. In a nationwide survey assessing the business costs in every state, only 24.8% of business owners in Florida reported difficulty finding qualified labor that negatively affected profitability, the smallest share of any state.
Florida also has one of the most business-friendly tax schemes in the country. It has some of the lowest unemployment insurance taxes, which are paid by businesses to fund recently unemployed workers. Just 41% of businesses in Florida report being negatively impacted by taxes, also the smallest share nationwide.
[recirclink id=440072]

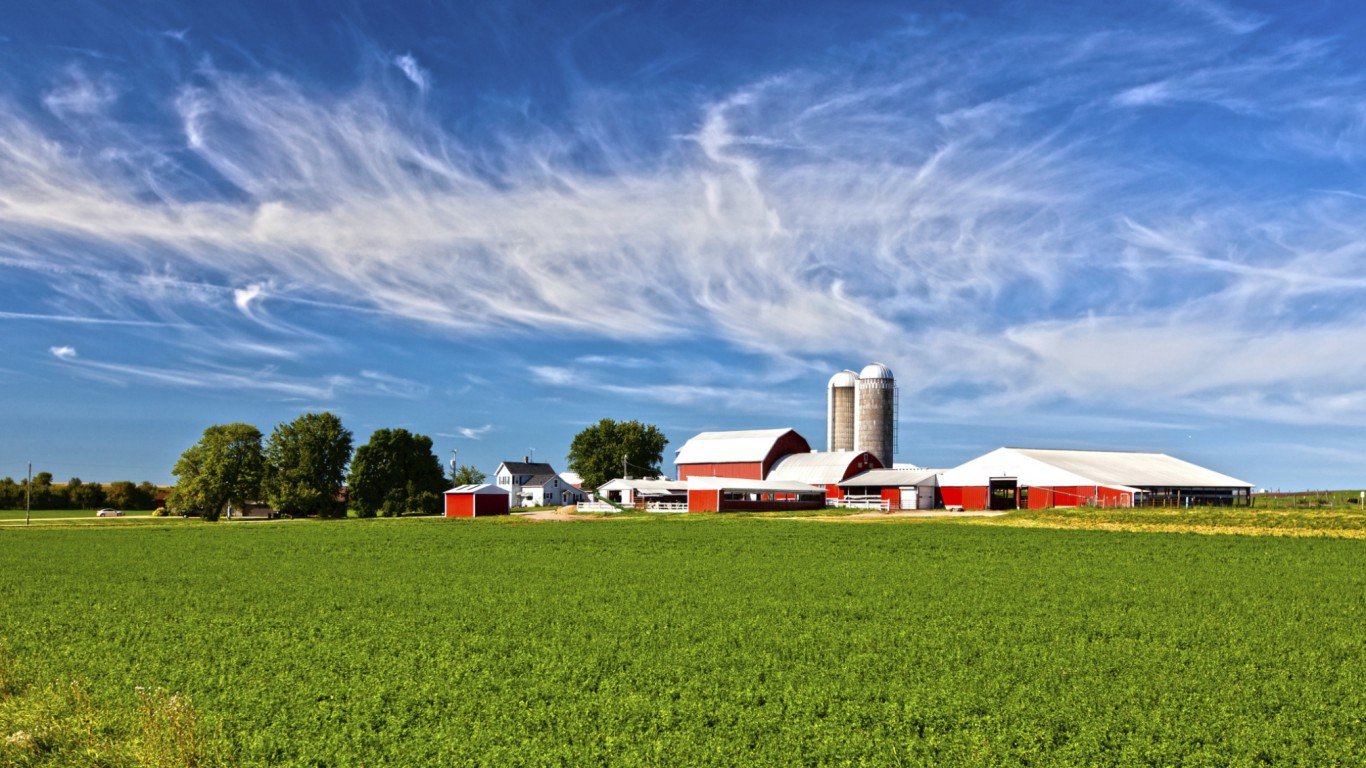
18. Iowa
> 1-yr. real GDP change: +1.6% (18th largest growth)
> Avg. salary: $43,902 (9th lowest)
> Adults w/ bachelor’s degree: 28.4 (17th lowest)
> Patents issued: 31.6 (21st most)
> Working-age population chg. 2010-2020: +4.3% (13th smallest growth)
With a cost of living nearly 10% lower than the national average, Iowa is one of the most affordable states in the country — both for residents and commercial enterprises. For example, annual homeownership costs account for only about one-quarter of the median household income in Iowa, the second lowest ratio of any state in the country. Lower housing costs mean residents have more disposable income, which can help drive up consumer spending. Similarly, no state has lower commercial real estate costs than Iowa.
Business owners in the state report relatively easy access to funds. According to the American Survey of Entrepreneurs, just 5.8% of Iowa business owners report a lack of access to financial capital as a negative impact to their business, and just 8.7% report the cost of borrowing as too high, each among the smallest shares of any state.

19. North Carolina
> 1-yr. real GDP change: +1.9% (14th largest growth)
> Avg. salary: $48,207 (25th lowest)
> Adults w/ bachelor’s degree: 30.4% (24th highest)
> Patents issued/100,000 people: 33.1 (20th most)
> Working-age population chg. 2020-2030: +7.8% (13th largest growth)
In recent years, North Carolina has had a larger increase in business activity than a majority of states. There were 60,550 building permits issued per 100,000 residents in the state in 2015, the ninth most of any state. Many of the permits were likely issued to small businesses, which also received more loans per capita than nearly any other state. In total, small businesses received $3,871 in major bank loans per employee in 2015, more than in any state other than California.
North Carolina also outranks most states in a number of measures related to technology and innovation. Approximately 150 venture capital deals were made in the state in 2016, many in clean technology. The average deal value was $51.7 million, the 12th most of any state. Additionally, due in part to the Research Triangle tech cluster and the presence of top tier research universities such as the University of North Carolina at Chapel Hill, Duke University, and North Carolina State University, an estimated 5.1% of workers in the state are employed in STEM fields — one of the larger shares nationwide. Not all is good for business in the state, and North Carolina ranks unfavorably on this list in a number of measures affecting business. The state has above average poverty and unemployment rates, for example.
[in-text-ad-2]

20. Georgia
> 1-yr. real GDP change: +3.0% (5th largest growth)
> Avg. salary: $51,572 (17th highest)
> Adults w/ bachelor’s degree: 30.5% (23rd highest)
> Patents issued/100,000 people: 23.9 (21st fewest)
> Working-age population chg. 2020-2030: +8.2% (12th largest growth)
In order to thrive, businesses have to be able to rely on transportation infrastructure — and few states score as well as Georgia in road and bridge quality. For example, just 4.7% of bridges in the state are structurally deficient and fewer than 2% of roadway are in poor condition — the sixth and fifth smallest share among states, respectively.
Georgia also appears to be a relative hotbed of innovation. Startup businesses in the Peach State claimed some 126 venture capital deals in 2016, more than in the vast majority of states. Even more impressive, the average venture capital deal in Georgia was valued at $60.9 million, more than in all but six other states.
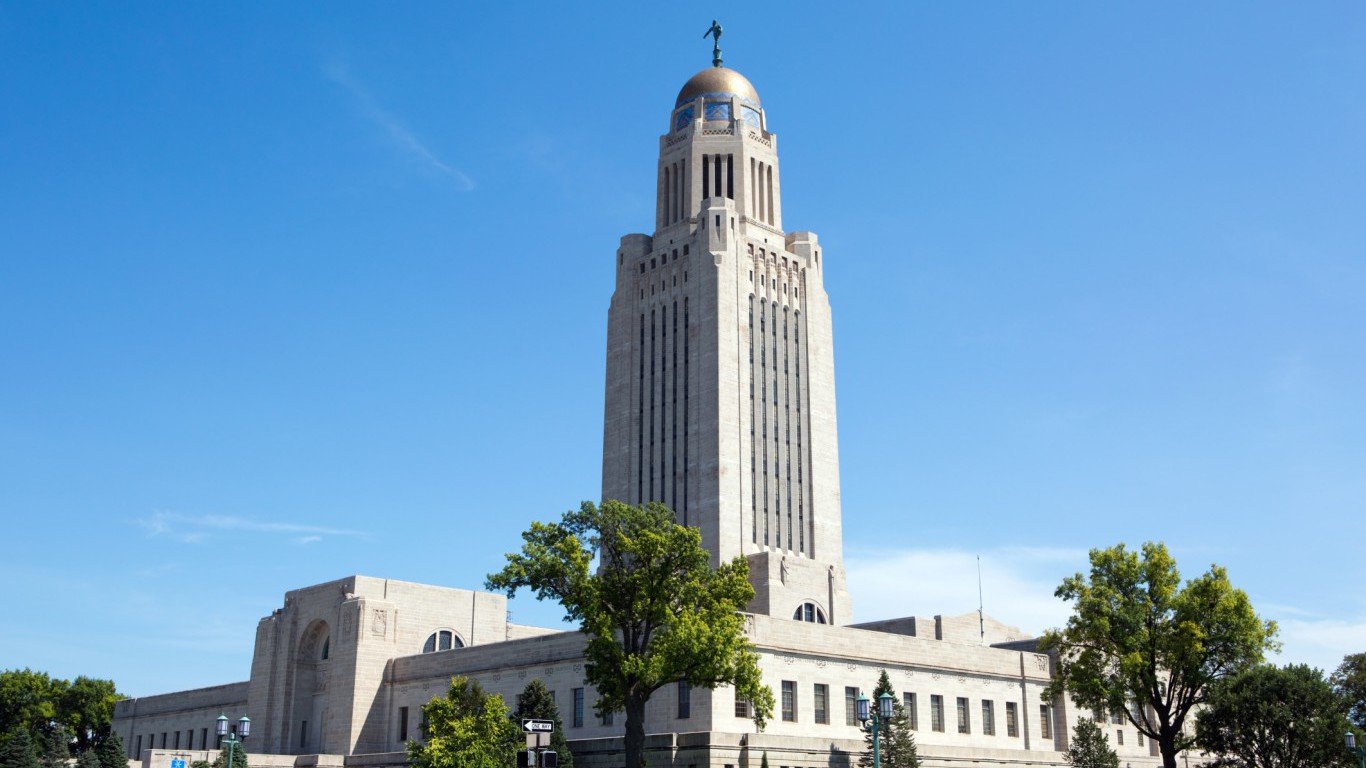
21. Nebraska
> 1-yr. real GDP change: +0.9% (14th smallest growth)
> Avg. salary: $45,262 (15th lowest)
> Adults w/ bachelor’s degree: 31.4% (19th highest)
> Patents issued/100,000 people: 16.4 (15th fewest)
> Working-age population chg. 2020-2030: +6.7% (18th largest growth)
Cost of living in Nebraska is nearly 10% lower than the national average, a boon for both businesses and residents. In addition to generally having lower costs, businesses also benefit from possible higher disposable income of residents. Just 34.7% of business owners in Nebraska report a negative impact attributable to slow business or lost sales, and just 26.9% report a negative impact from late or non-payment from customers — each among the smallest such shares of any state.
Not all aspects of business are good for entrepreneurs in the state. About 56% of Nebraska business owners surveyed claim taxes negatively impact their operation, the largest such share of any state.
[in-text-ad]

22. Alaska
> 1-yr. real GDP change: -5.4% (the largest decrease)
> Avg. salary: $56,838 (9th highest)
> Adults w/ bachelor’s degree: 29.6% (tied — 25th lowest)
> Patents issued/100,000 people: 5.4 (2nd fewest)
> Working-age population chg. 2020-2030: -7.4% (16th largest growth)
Alaska is one of the nation’s largest producers of crude oil and natural gas, and like most states with a large oil and gas sector, the state’s economy has taken a hit in the past few years due to depressed energy prices. The state’s GDP contracted by 5.4% between 2015 and 2016, and the state’s annual unemployment rate of 6.6% is the second highest among states.
While Alaska’s economy is struggling at the moment, the state’s businesses benefit from a consumer base that is likely to be able to spend more on consumer goods and services. The median household income in the state of $76,440 a year is the second highest in the country. Alaska is one of just six states with a poverty rate below 10%.
[recirclink id=440483]
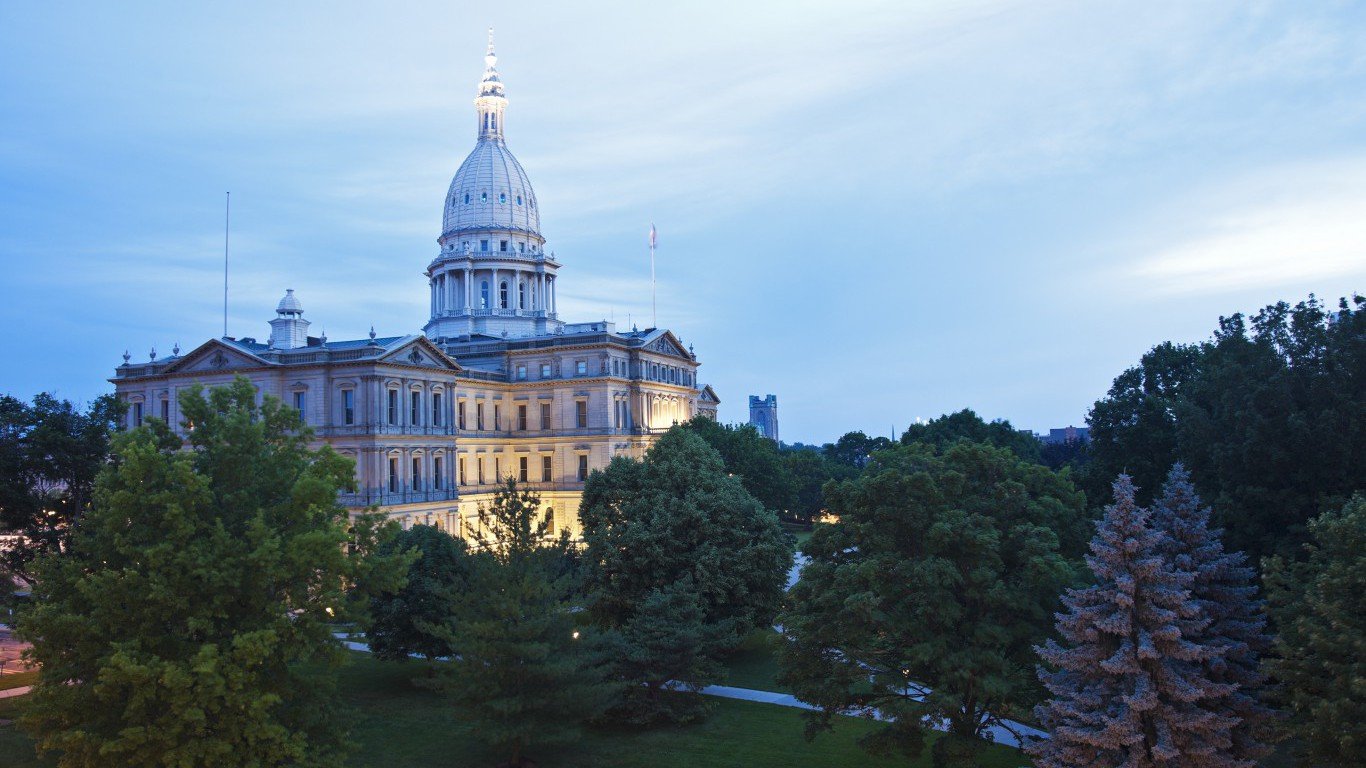
23. Michigan
> 1-yr. real GDP change: +2.2% (12th largest growth)
> Avg. salary: $50,552 (19th highest)
> Adults w/ bachelor’s degree: 28.3% (16th lowest)
> Patents issued/100,000 people: 56.0 (9th most)
> Working-age population chg. 2020-2030: +6.7% (the largest decrease)
One of the biggest advantages businesses in Michigan benefit from is the state’s low cost of living. Goods and services are 6.5% less expensive in Michigan than they are on average nationwide — and businesses benefit. Not only does a low cost of living provide consumers with more disposable incomes, but also Michigan has the second lowest average commercial retail estate costs of any state.
However, new and relocated businesses in Michigan may have trouble filling positions with qualified candidates in the coming years. Over the decade between 2020 and 2030, the working age population in Michigan is projected to decline by 6.7%, the steepest drop of any state.

24. Arizona
> 1-yr. real GDP change: +2.6% (8th largest growth)
> Avg. salary: $49,432 (22nd highest)
> Adults w/ bachelor’s degree: 28.9 (tied — 22nd lowest)
> Patents issued: 36.6 (17th most)
> Working-age population chg. 2010-2020: +10.8% (6th largest growth)
Arizona’s economy has shown signs of strengthening recently. State GDP grew by 2.6% in 2016, a positive sign for the state’s businesses. Also, the state’s economy will likely continue to grow in the years ahead. The state’s working-age population is projected to grow by 10.8% between 2020 and 2030, a further sign business is booming and that state employers will have a large talent pool to draw from.
The state’s business environment is far from ideal, however. Arizona’s poverty rate of 16.4% is one of the highest in the country. The state also has below average educational attainment rates at both the high school and college level.
[in-text-ad-2]
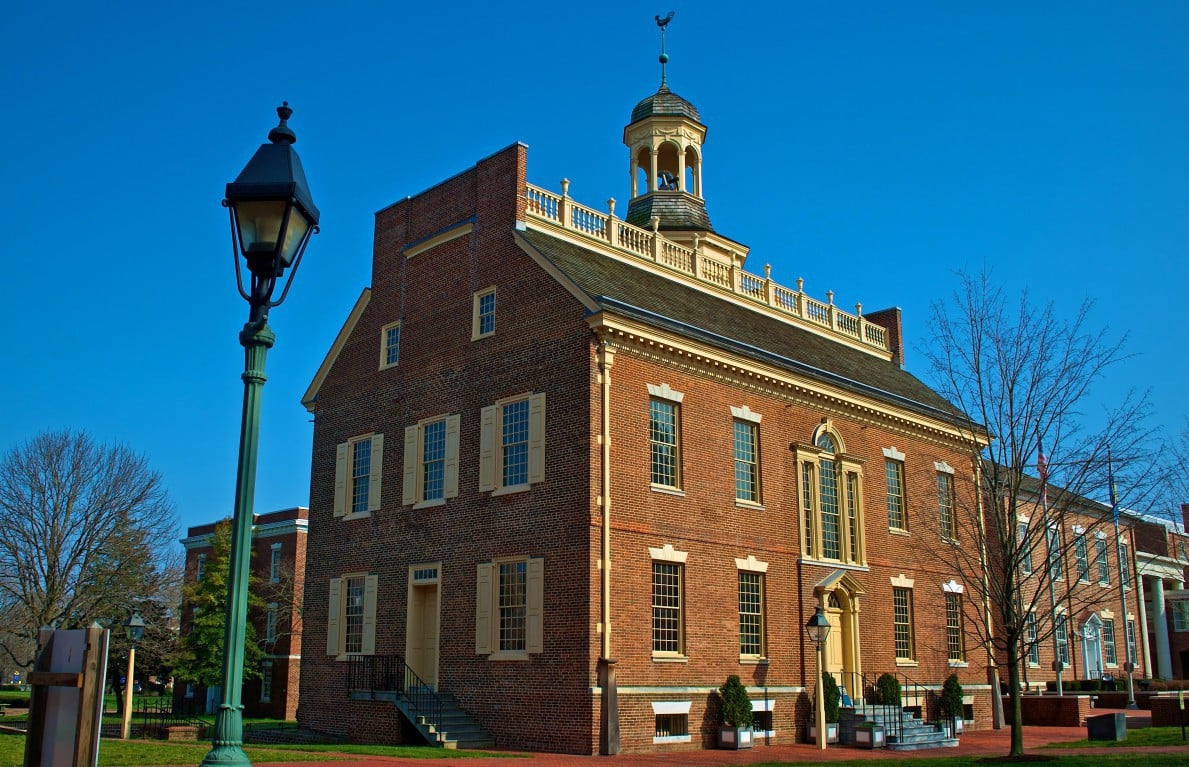
25. Delaware
> 1-yr. real GDP change: +0.1% (2nd smallest growth)
> Avg. salary: $53,148 (14th highest)
> Adults w/ bachelor’s degree: 31.0 (tied — 20th highest)
> Patents issued: 37.9 (16th most)
> Working-age population chg. 2010-2020: +6.3% (20th largest growth)
Functional and reliable transportation infrastructure are important for many businesses to succeed. In Delaware, just 4.9% of bridges are considered structurally deficient and 3.9% of roadways are in poor condition — each well below the respective 9.1% and 6.6% shares across the United States as a whole. Businesses in the state also report benefitting from a low tax rate. Just 42.9% of business owners surveyed cite taxes as a negative impact on their operation, the third smallest share of any state.
Not all conditions in Delaware are ideal for businesses, however. Traffic congestion is a considerable problem. Congestion cost the trucking transportation industry an average of $323,713 per mile in 2016, the second highest loss attributable to congestion of any state.
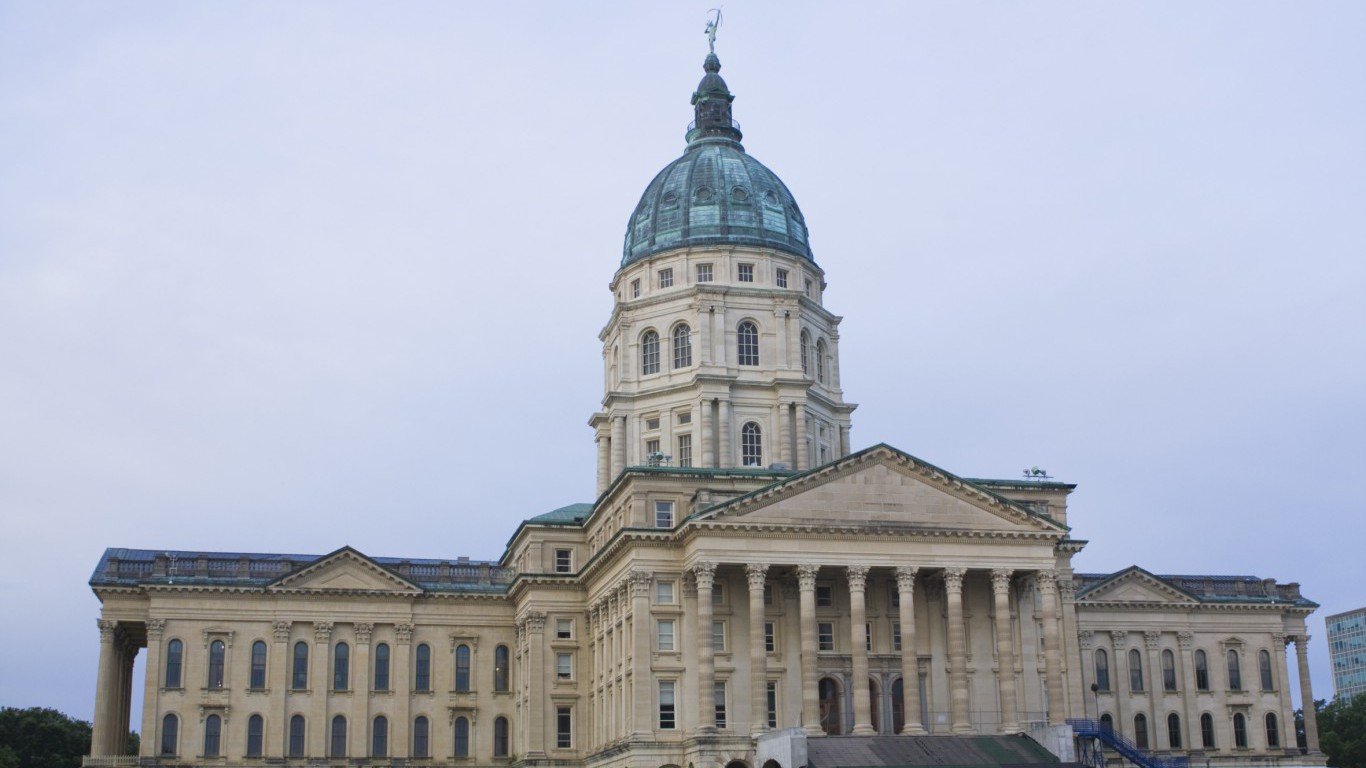
26. Kansas
> 1-yr. real GDP change: -0.9% (6th largest decrease)
> Avg. salary: $45,343 (16th lowest)
> Adults w/ bachelor’s degree: 32.8 (15th highest)
> Patents issued: 31.5 (22nd most)
> Working-age population chg. 2010-2020: +2.6% (8th smallest growth)
Ranking where it does, Kansas unsurprisingly has some attributes that are good for business and some that are not. A state’s infrastructure condition is important, as travel delays and poor commutes can eat into profits. In Kansas, less than 1% of roadways are in poor condition, the lowest share of any state. Also, the average commute time for state residents is less than 20 minutes, compared to a national average of 26.6 minutes.
However, unlike most states, Kansas’ economy is not growing. The state’s GDP contracted by 0.9% in 2016 — just as the national economy expanded by 1.5%. A lack of capital for small businesses might help partially explain the state’s stagnant economy. There were just 1,439 small business loans per employee in 2015, the second fewest in the country.
[in-text-ad]

27. Oregon
> 1-yr. real GDP change: +3.8% (2nd largest growth)
> Avg. salary: $50,424 (20th highest)
> Adults w/ bachelor’s degree: 32.7 (16th highest)
> Patents issued: 57.8 (8th most)
> Working-age population chg. 2010-2020: +5.5% (16th smallest growth)
Oregon’s economy has been growing recently, a good sign for existing and prospective businesses. State GDP increased by 3.8% in 2016, the second largest growth rate of any state. The previous year, the number of private businesses in the state increased by 2.3%, the sixth largest increase of any state. However, one factor weighing on Oregon’s rank is the relative unaffordability of doing business in the state. Median ownership costs are among the most expensive in the country relative to incomes.
[recirclink id=440394]

28. Nevada
> 1-yr. real GDP change: +1.4% (22nd largest growth)
> Avg. salary: $48,343 (25th highest)
> Adults w/ bachelor’s degree: 23.5 (6th lowest)
> Patents issued: 24.7 (23rd fewest)
> Working-age population chg. 2010-2020: +17.5% (2nd largest growth)
The quality of life in a given state can have an impact on the ease with which employers can entice candidates to relocate there. Nevada businesses are at somewhat of a disadvantage, as the state ranks poorly in key measures of quality of life. For example, Nevada has the third highest violent crime rate in the country, at 678 incidents per 100,000 people — nearly double the national violent crime rate.
The state also has relatively few highly-educated workers and relatively few working in science, technology, engineering, and math. A highly-educated workforce with many workers in STEM fields signifies a growing and innovative economy. Just 8.1% of Nevada adults have a graduate or professional degree, the second lowest share among states. Similarly, just 3% of jobs in the state are in STEM fields, also the second lowest share in the country.

29. New Jersey
> 1-yr. real GDP change: +0.7% (10th smallest growth)
> Avg. salary: $62,222 (5th highest)
> Adults w/ bachelor’s degree: 38.6 (tied — 4th highest)
> Patents issued: 51.5 (11th most)
> Working-age population chg. 2010-2020: +1.0% (4th smallest growth)
A high cost of living is a potential deterrent for any business as it translates to less disposable consumer income and high costs of doing business. And New Jersey is a particularly expensive state. Goods and services in in the state cost about 13% more than they do nationwide. Both commercial real estate and commercial electricity are more expensive in New Jersey than in the vast majority of states. In addition, the Tax Foundation ranks the state dead last for its business tax climate.
One of the state’s greatest assets, however, is its highly skilled workforce. Of adults in the state, 38.6% have at least a bachelor’s degree, and 14.9% have a graduate or professional degree — the fourth and seventh largest shares among states, respectively. Partially as a result, 5.6% of all jobs in Garden State are in STEM fields, a larger share than in all but 10 other states.
[in-text-ad-2]

30. Tennessee
> 1-yr. real GDP change: +2.9% (6th largest growth)
> Avg. salary: $46,961 (22nd lowest)
> Adults w/ bachelor’s degree: 26.1 (10th lowest)
> Patents issued: 15.2 (13th fewest)
> Working-age population chg. 2010-2020: +5.3% (15th smallest growth)
While Tennessee ranks below most states in business friendliness, the state’s low cost of living may be a boon to businesses in the area. Goods and services in the state cost 11.1% less than they do nationwide, the ninth lowest price parity of any state. Also, taxes paid by Tennessee residents amount to just 7.3% of income, the fourth lowest tax burden in the country.
Tennessee has also reported faster growth and more business activity than most states. The state’s real GDP grew 2.9% in 2016, nearly twice the national GDP growth rate of 1.5%. Some 36,000 new business permits were issued in the state that year, the 12th most of any state when adjusted for population. Tennessee is also one of just 11 states with a triple-A rating and stable outlook from both Moody’s and S&P, a sign of a stable economy.
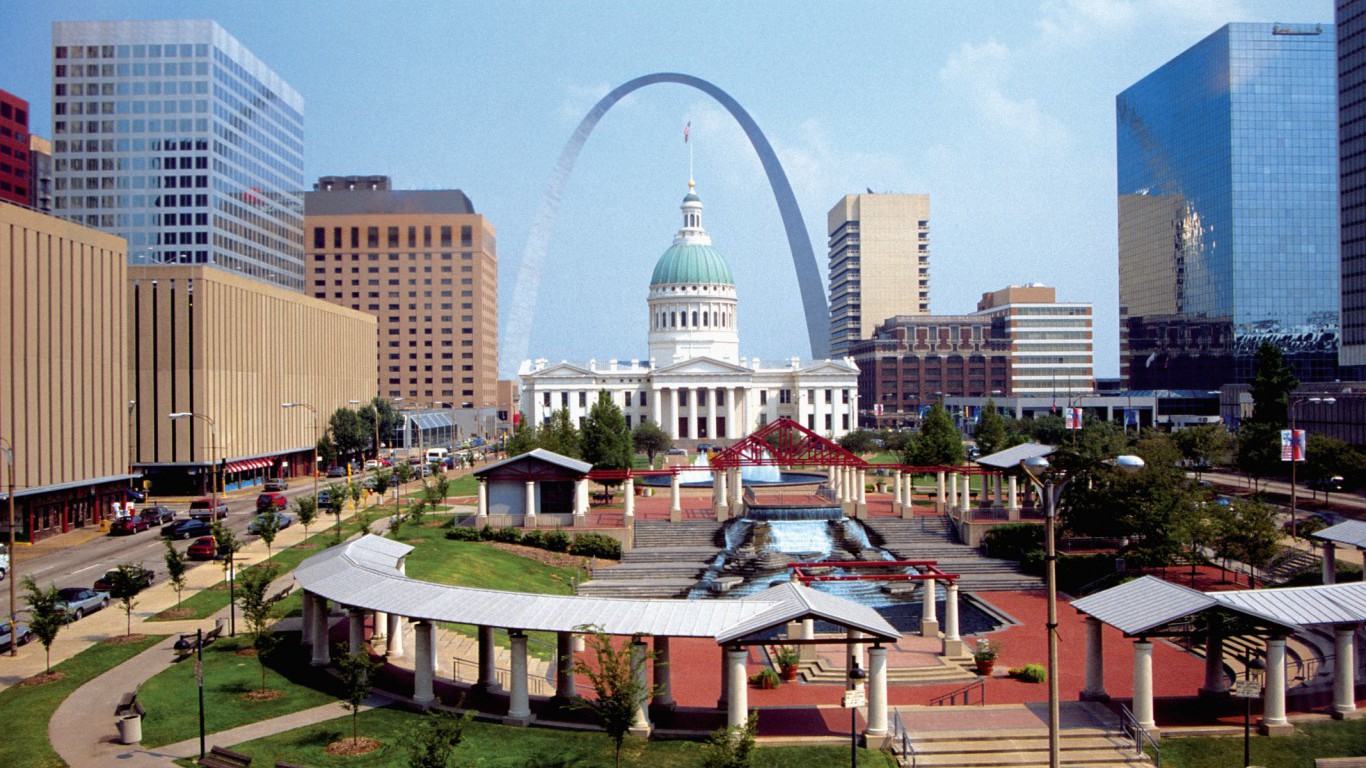
31. Missouri
> 1-yr. real GDP change: +0.3% (5th smallest growth)
> Avg. salary: $47,193 (23rd lowest)
> Adults w/ bachelor’s degree: 28.5 (18th lowest)
> Patents issued: 17.8 (16th fewest)
> Working-age population chg. 2010-2020: +0.9% (3rd smallest growth)
For a state that ranks 31st in favorability for business, Missouri does not rank particularly poorly in any single category, but is consistently average or below average across many important factors. For example, the state ranks slightly below average in measures of technology and innovation such as the share of jobs in STEM fields.
Missouri is also roughly in the middle of all states in measures of human capital. For example, 28.5% of state adults have a bachelor’s degree, which is slightly below the national figure of 31.3%.
[in-text-ad]
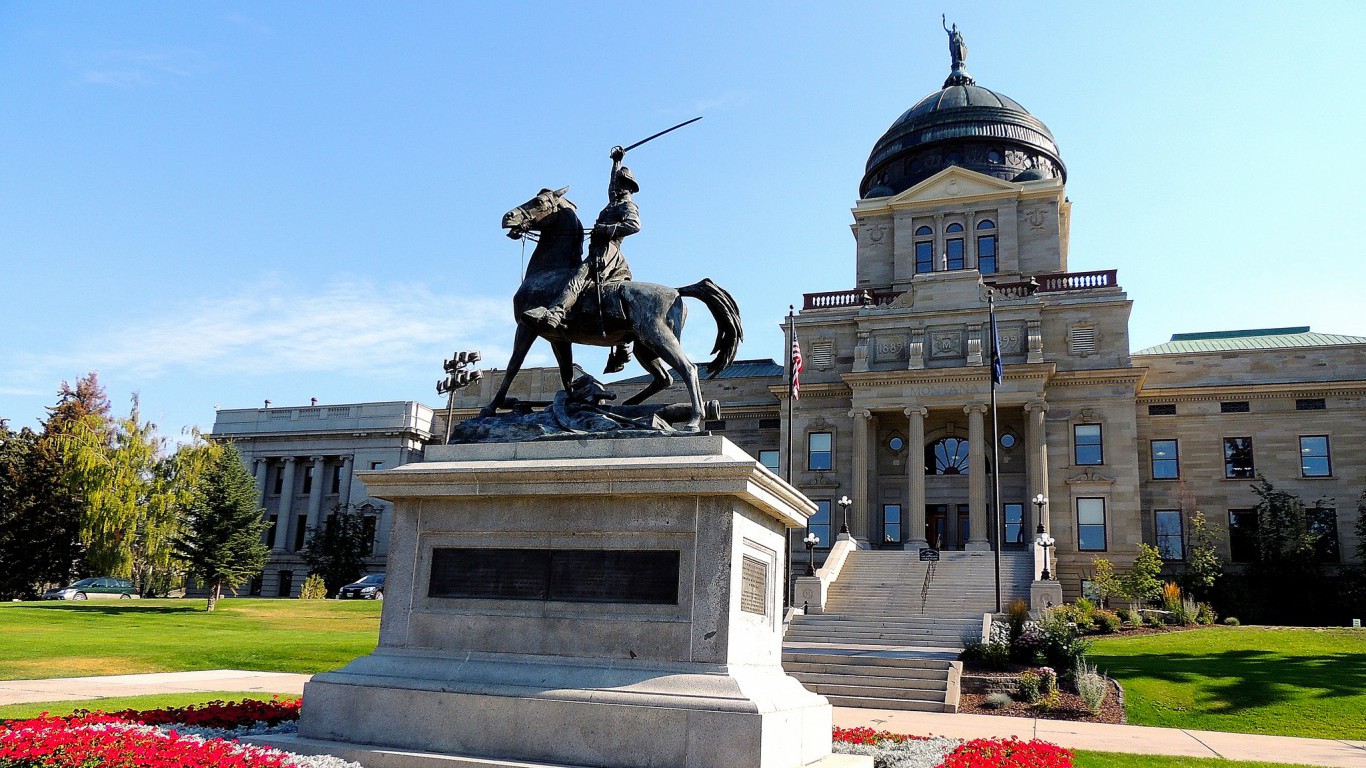
32. Montana
> 1-yr. real GDP change: +1.1% (16th smallest growth)
> Avg. salary: $40,943 (4th lowest)
> Adults w/ bachelor’s degree: 31.0 (tied — 20th highest)
> Patents issued: 13.6 (10th fewest)
> Working-age population chg. 2010-2020: +6.1% (17th smallest growth)
Business loans are relatively easy to access and inexpensive in Montana. Just 5.4% of surveyed entrepreneurs reported a negative impact to business due to lack of access to financial capital, and just 7.6% reported a negative impact due to the cost of financial capital — each the smallest such shares of any state in the country. Still, 32.7% of business owners reported struggling to find qualified workers — a larger than typical share. The state’s small share of advanced degree holders may be partially to blame. Only about 1 in 10 adults in the state have a graduate or professional degree, a smaller share than in most states.
Relatively few tech startups and innovative companies choose Montana as a place to do business. Ony 14 patents were issued in the state for every 100,000 residents in 2015, and there were only 22 venture capital deals in 2016 — both among the smallest such shares nationwide.
[recirclink id=440150]

33. Indiana
> 1-yr. real GDP change: +2.5% (10th largest growth)
> Avg. salary: $45,378 (17th lowest)
> Adults w/ bachelor’s degree: 25.6% (9th lowest)
> Patents issued/100,000 people: 30.6 (25th most)
> Working-age population chg. 2020-2030: +2.0% (7th smallest growth)
In states with highly educated populations, businesses have a more skilled and flexible workforce to draw from. In Indiana, while a slightly higher than the national figure of 88.4% of adults have a high school diploma, just 25.6% of adults have a bachelor’s degree. Nationwide, 31.3% of adults have a bachelor’s degree. The state also ranks below average in measures of quality of life, including health insurance coverage and the concentration of art, entertainment, and recreational establishments, which can point to the state being less attractive not only to potential businesses, but also to employees.
34. Wisconsin
> 1-yr. real GDP change: +1.3% (23rd largest growth)
> Avg. salary: $46,659 (21st lowest)
> Adults w/ bachelor’s degree: 29.5 (23rd lowest)
> Patents issued: 35.3 (19th most)
> Working-age population chg. 2010-2020: -1.3% (11th largest decrease)
Starting up a business in Wisconsin appears to be less expensive than in most states. Goods and services on the whole cost about 93 cents on the dollar compared to average prices nationwide. The price of commercial real estate in the state is also among the most affordable in the country.
On the other hand, Wisconsin’s tax structure may be less than ideal both to business and potential employees. In the Census Bureau’s Annual Survey of Entrepreneurs, 52.8% said their business had been negatively impacted by the state’s tax policies. High taxes for individuals may also discourage workers from moving to the state. As of fiscal 2012, the average state and local taxes paid in Wisconsin amounted to 11% of state income per capita, the fifth highest proportion in the country.
[in-text-ad-2]

35. New York
> 1-yr. real GDP change: +0.4% (6th smallest growth)
> Avg. salary: $67,266 (the highest)
> Adults w/ bachelor’s degree: 35.7 (9th highest)
> Patents issued: 42.9 (14th most)
> Working-age population chg. 2010-2020: -1.6% (10th largest decrease)
Attributable largely to the high cost of living in New York City, the average cost of goods and services is about 15% higher in New York state than it is nationwide. These high costs make conducting business in the state especially pricey. Commercial real estate prices in New York are the highest of any state after only Hawaii. Additionally, the Tax Foundation ranks New York’s business tax climate as the worst of any state after only Hawaii.
Employee productivity and satisfaction are likely impacted by long commute times in New York state. The average commute time for workers in the state is 33 minutes — the longest of any state in the country.

36. South Carolina
> 1-yr. real GDP change: +1.8% (16th largest growth)
> Avg. salary: $44,134 (12th lowest)
> Adults w/ bachelor’s degree: 27.2% (tied — 13th lowest)
> Patents issued/100,000 people: 19.1 (18th fewest)
> Working-age population chg. 2020-2030: +7.1% (17th largest growth)
Businesses operating in states with a higher quality of life are more likely to be able to attract new employees. South Carolina rates as one of the worst states in quality of life, ranking among the worst states in measures such as the presence of arts, entertainment, and recreation facilities and the presence of violent crime. That the state is a less attractive place to live might help explain why it also has a relatively small share of professionals. South Carolina has a below average share of adults with bachelor’s degrees and adults with graduate and professional degrees.
[in-text-ad]
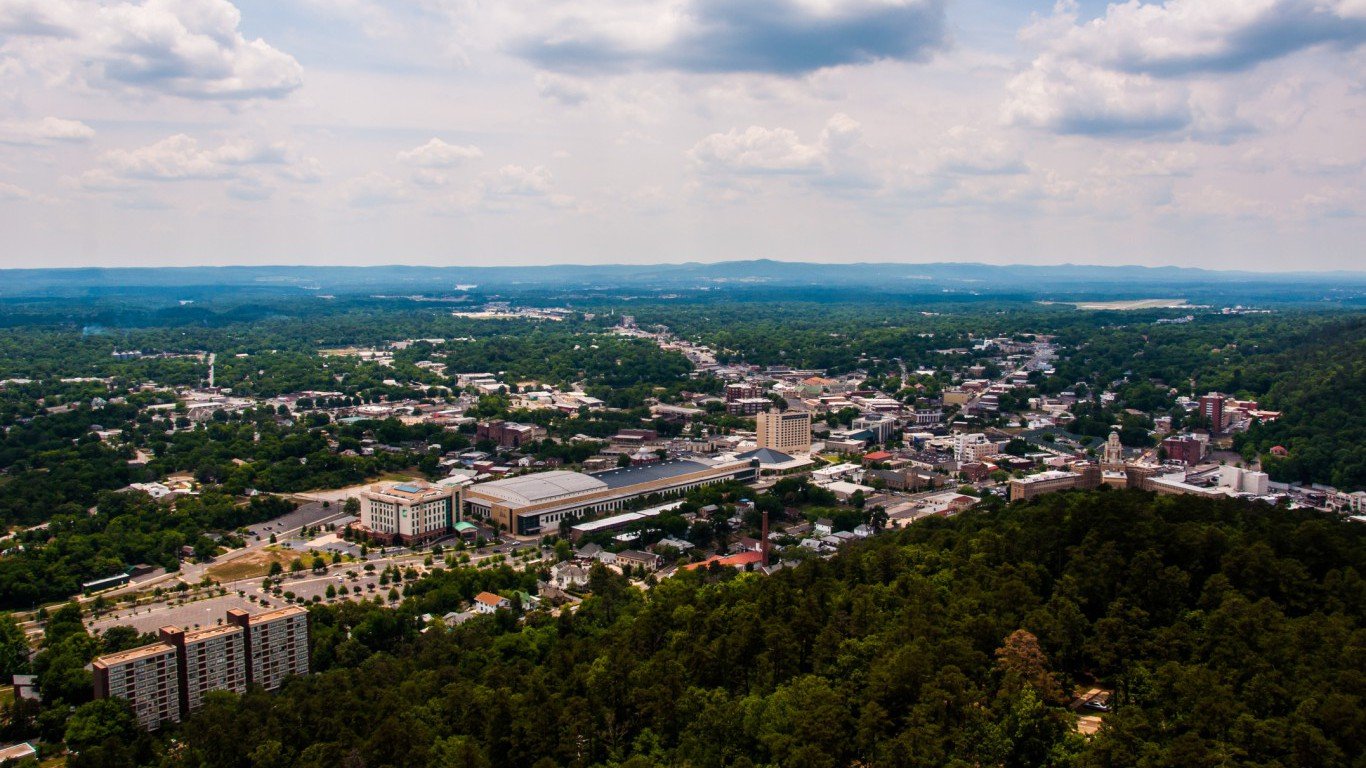
37. Arkansas
> 1-yr. real GDP change: +0.9% (13th smallest growth)
> Avg. salary: $42,157 (6th lowest)
> Adults w/ bachelor’s degree: 22.4% (3rd lowest)
> Patents issued/100,000 people: 7.8 (4th fewest)
> Working-age population chg. 2020-2030: +4.3% (14th smallest growth)
Businesses in a state with a high poverty rate can find it harder to turn a profit as consumers are less likely to have disposable income to spend on goods and services. In Arkansas, 17.2% of the population lives below the poverty line, the sixth highest poverty rate in the country. Also, the state’s median household income of $44,334 a year is the third lowest among states.
In addition, Arkansas has one of the highest violent crime rates of any state, at 550 incidents per 100,000 people, compared to a national violent crime rate of 386 incidents per 100,000. Local violent crime can drive away business, and areas with a reputation for crime are less likely to attract potential employees.
[recirclink id=440088]
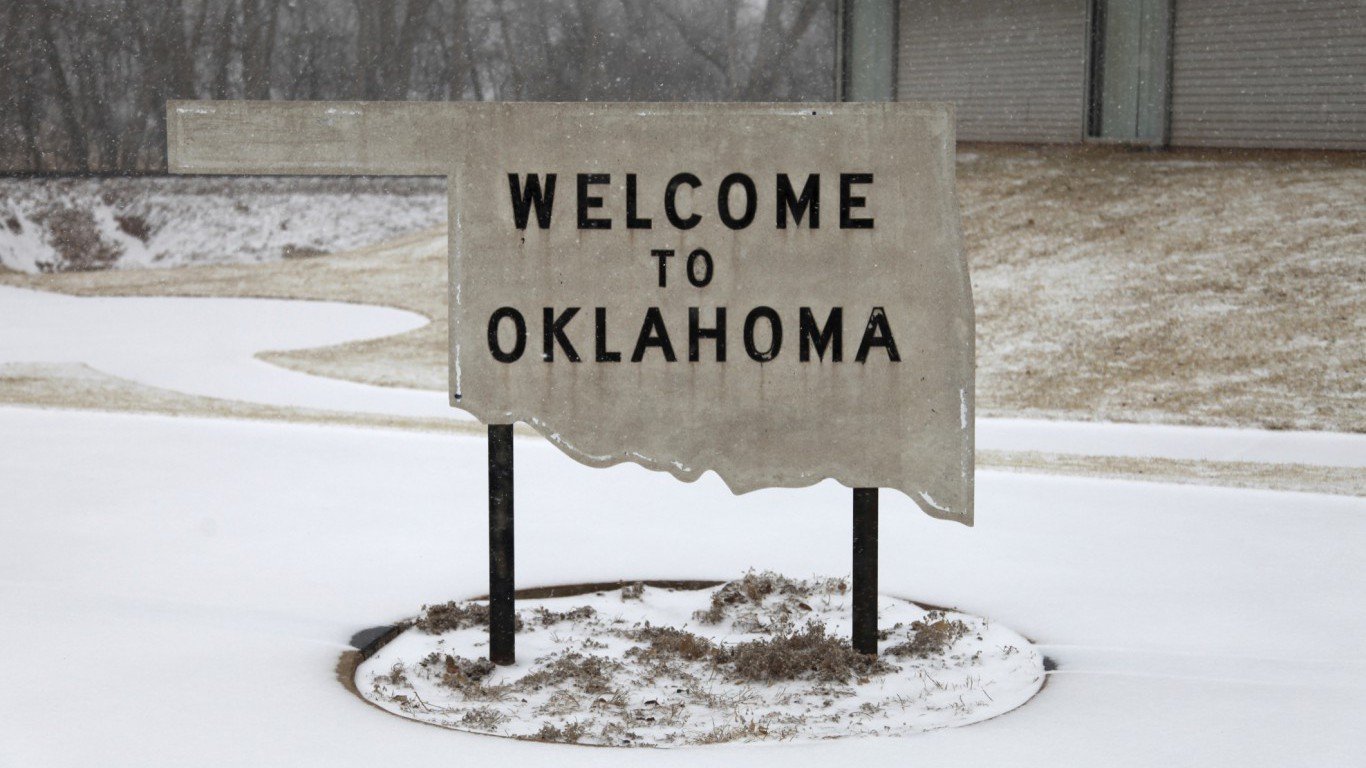
38. Oklahoma
> 1-yr. real GDP change: -4.1% (3rd largest decrease)
> Avg. salary: $44,781 (14th lowest)
> Adults w/ bachelor’s degree: 25.2 (8th lowest)
> Patents issued: 13.6 (9th fewest)
> Working-age population chg. 2010-2020: +7.8% (15th largest growth)
A high violent crime rate can discourage businesses from relocating to an area. In Oklahoma, there were 450 violent crimes for every 100,000 residents in 2016, more than in the majority of states and well above the U.S. violent crime rate of 386 per 100,000. Due to a range of socioeconomic factors, Oklahoma’s economy is struggling. The state’s GDP contracted by 4.1% between 2015 and 2016, nearly the largest decline of any state.
Employers in the state may also struggle to find enough skilled workers. Only 25.2% of adults have a bachelor’s degree, a smaller share than in the vast majority of states.

39. Maine
> 1-yr. real GDP change: +1.6% (19th largest growth)
> Avg. salary: $43,843 (8th lowest)
> Adults w/ bachelor’s degree: 30.1 (25th highest)
> Patents issued: 15.1 (12th fewest)
> Working-age population chg. 2010-2020: -6.1% (2nd largest decrease)
A focus on technology and innovation can benefit the economy as a whole and contribute to a friendly business environment, but Maine ranks among the worst in this category. Just 201 of the 140,969 patents issued by the U.S. Patent and Trademark Office in 2015 went to state enterprises. Also, there are relatively few venture capital deals in the state, and their average size is relatively small.
Maine’s is unfavorable also in some measures of infrastructure. The state has a low concentration of airports relative to its size. This can make transportation of goods, as well as businesses-related trips, more difficult.
[in-text-ad-2]

40. Pennsylvania
> 1-yr. real GDP change: +0.6% (9th smallest growth)
> Avg. salary: $51,323 (18th highest)
> Adults w/ bachelor’s degree: 30.8 (22nd highest)
> Patents issued: 29.9 (24th fewest)
> Working-age population chg. 2010-2020: -0.1% (13th largest decrease)
In the 2015 American Survey of Entrepreneurs, Pennsylvania businesses were among the most likely to report a negative impact on their business from unpredictable conditions, late or non paying customers, and slow business or lost sales. State businesses are also among the most likely in the country to suffer from lost business due to problems with transportation infrastructure. A higher than average 20% of the state’s bridges are structurally deficient or obsolete, and an above average share of roadways are in poor condition. Such poor conditions can cause delays in the shipment of goods in state.

41. Hawaii
> 1-yr. real GDP change: +1.9% (15th largest growth)
> Avg. salary: $49,601 (21st highest)
> Adults w/ bachelor’s degree: 31.9 (18th highest)
> Patents issued: 8.9 (6th fewest)
> Working-age population chg. 2010-2020: +3.7% (12th smallest growth)
While Hawaii is an attractive place to live, it is also one of the most expensive places to do business. On Average, goods and services cost 18% more in the state than they do nationwide, the most expensive state in the country. Housing, as measured by home ownership costs relative to incomes, is one of the least affordable in the country.
Perhaps due to the state’s expensive real estate, relatively few new businesses have started in Hawaii recently. The number of private businesses in the state increased by just 0.4% in 2015, the fifth smallest increase in of all states. Just 236 new building permits were issued in the state per 100,000 residents, compared to a national average of 373 per 100,000 residents.
[in-text-ad]
42. Ohio
> 1-yr. real GDP change: +1.1% (17th smallest growth)
> Avg. salary: $48,486 (24th highest)
> Adults w/ bachelor’s degree: 27.5 (14th lowest)
> Patents issued: 30.9 (23rd most)
> Working-age population chg. 2010-2020: -3.3% (8th largest decrease)
A struggling economy is not conducive to good business environment, and Ohio’s economy shows signs of continued stagnation in a number of measures. Both in the most recent year and on aggregate over the last five years, the state’s economy grew at a slower pace than the national economy. The number of non-government establishments in the state has grown one of the smallest annual growth rates. Ohio was also one of just seven states with fewer than 200 building permits issued per 100,000 residents in 2016. Nationally, there were 373 building permits issued for every 100,000 residents.
In the most recent American Survey of Entrepreneurs, Ohio businesses were among the most likely to report a lack of access to qualified labor. Just 27.5% of the state’s adults have a bachelor’s degree, compared to 31.3% of American adults.
[recirclink id=439690]

43. Illinois
> 1-yr. real GDP change: +1.0% (15th smallest growth)
> Avg. salary: $57,505 (8th highest)
> Adults w/ bachelor’s degree: 34.0 (13th highest)
> Patents issued: 39.3 (15th most)
> Working-age population chg. 2010-2020: -3.9% (5th largest decrease)
Compared to other states, Illinois’ new businesses and those looking to expand may find it more difficult, as the state’s working-age population is projected to decline by 3.9% between 2020 and 2030, the fifth largest decrease of any state. The state’s declining population is indicative of many other economic problems that reflect a poor business environment. Illinois has one of the highest unemployment rates in the country, a below average GDP growth rate, and the fifth fewest building permits issued per 100,000 people. Illinois also has the worst credit rating of any state from both Moody’s and S&P. Its BBB- rating from S&P is just one level above junk status. A state credit default could have serious and wide-reaching effects on Illinois’ private sector.

44. Rhode Island
> 1-yr. real GDP change: +0.5% (8th smallest growth)
> Avg. salary: $52,109 (16th highest)
> Adults w/ bachelor’s degree: 34.1 (12th highest)
> Patents issued: 30.7 (24th most)
> Working-age population chg. 2010-2020: -3.7% (7th largest decrease)
Growth in Rhode Island’s private sector is at a virtual standstill relative to most states. There were just 116 building permits issued in the state per 100,000 people, the fewest of any state and well below the nationwide average of 373 permits issued per 100,000 residents. Small business lending in the state may also contribute to a less positive business environment. The average loan amount in the state is the fourth smallest, at just $1,545 lent per employee. In the most recent American Survey of Entrepreneurs, state businesses were among the most likely to report a negative effect on their businesses from a lack of access to financial capital.
[in-text-ad-2]

45. Alabama
> 1-yr. real GDP change: +1.5% (20th largest growth)
> Avg. salary: $44,211 (13th lowest)
> Adults w/ bachelor’s degree: 24.7 (7th lowest)
> Patents issued: 9.7 (7th fewest)
> Working-age population chg. 2010-2020: +0.4% (2nd smallest growth)
The typical Alabama household earns only $46,257 a year, or about $11,000 less than the typical American household. Additionally, 17.1% of state residents live in poverty, a far larger share than the 14.0% of Americans. Low incomes often translate to lower consumer spending, and in the Census’ American Survey of Entrepreneurs, 45.8% of business establishments in Alabama report struggling with slow sales — one of the highest shares in the country.
Employers in Alabama may also find it hard to fill positions in the coming years. The state’s working-age population is projected to increase by only 0.4% between 2020 and 2030, well below the corresponding 4.6% national growth.

46. Kentucky
> 1-yr. real GDP change: +1.2% (19th smallest growth)
> Avg. salary: $43,957 (10th lowest)
> Adults w/ bachelor’s degree: 23.4 (tied — 5th lowest)
> Patents issued: 14.9 (11th fewest)
> Working-age population chg. 2010-2020: +1.1% (5th smallest growth)
Southern U.S. states typically have low cost of goods and services, affordable real estate, and relatively low tax burdens. Such favorable measures certainly help make states like Kentucky more business friendly.
Beyond these advantages, however, Kentucky rates poorly in a number of measures of doing business. Generally, an educated workforce helps companies flourish. In Kentucky, though, just 24.3% of adults have a bachelor’s degree, nearly the lowest such percentage of all states. Educational attainment tracks closely with measures of innovation in a state, which are also indicative of a favorable business environment. In Kentucky, venture capital deals, patents awarded per capita, and the share of STEM jobs are all relatively low compared to other states.
[in-text-ad]

47. West Virginia
> 1-yr. real GDP change: -1.1% (5th largest decrease)
> Avg. salary: $41,241 (5th lowest)
> Adults w/ bachelor’s degree: 20.8 (the lowest)
> Patents issued: 6.9 (3rd fewest)
> Working-age population chg. 2010-2020: -4.2% (4th largest decrease)
In West Virginia, population loss and outbound migration have led to slowed economic growth. The state’s working-age population is projected to decline by 1.0% in the decade between 2020 and 2030, even as the comparable population nationwide is projected to grow by 4.6%. More businesses closed than opened in West Virginia in 2013, with the total number falling by 0.6% — the largest decline of any state.
West Virginia has one of the least active entrepreneurial environments nationwide. There was just one venture capital deal in 2014, and just seven patents were issued per 100,000 residents. Nationwide there were 44 patents issued per 100,000 Americans. Also, just 3.4% of workers are employed in STEM jobs in the state, the fourth smallest share in the country.
[recirclink id=439852]

48. New Mexico
> 1-yr. real GDP change: +0.2% (3rd smallest growth)
> Avg. salary: $43,661 (7th lowest)
> Adults w/ bachelor’s degree: 27.2 (tied — 13th lowest)
> Patents issued: 20.5 (20th fewest)
> Working-age population chg. 2010-2020: +1.6% (6th smallest growth)
A less affluent population with little disposable income are less than ideal consumers. In New Mexico, nearly 20% of the population lives in poverty, compared to the national poverty rate of 14.0%. The typical household income is just $46,748 annually, about $10,000 less than the national median household income.
Due to the high crime rate in the state, New Mexico is potentially a less attractive place to live, which can impact businesses’ ability to attract employees. New Mexico had the second highest violent crime rate in the country in 2016, at over 700 incidents per 100,000 residents, compared to the national rate of 386 incidents per 100,000 Americans.

49. Mississippi
> 1-yr. real GDP change: +1.2% (20th smallest growth)
> Avg. salary: $39,071 (the lowest)
> Adults w/ bachelor’s degree: 21.8 (2nd lowest)
> Patents issued: 4.6 (the fewest)
> Working-age population chg. 2010-2020: -2.4% (9th largest decrease)
While Mississippi has a relatively low cost of living and cheap business startup expenses, the state’s stagnant economy is likely a drag on commercial activity statewide. Mississippi’s GDP is unchanged from five years ago, and the state’s 22% poverty rate is the highest in the country. An estimated 5.8% of Mississippi’s workforce is unemployed, higher than the national unemployment rate of 4.9%. Mississippi’s talent pool is relatively shallow in comparison to the rest of the country.
Just 21.8% of adults have a bachelor’s degree, and just 8.2% have a graduate or professional degree — two of the smallest such shares of any state. Many of the most advanced, high-paying jobs require higher education. Mississippi’s low educational attainment is likely one reason for the 2.8% of workers employed in STEM fields, the lowest share nationwide.
[in-text-ad-2]
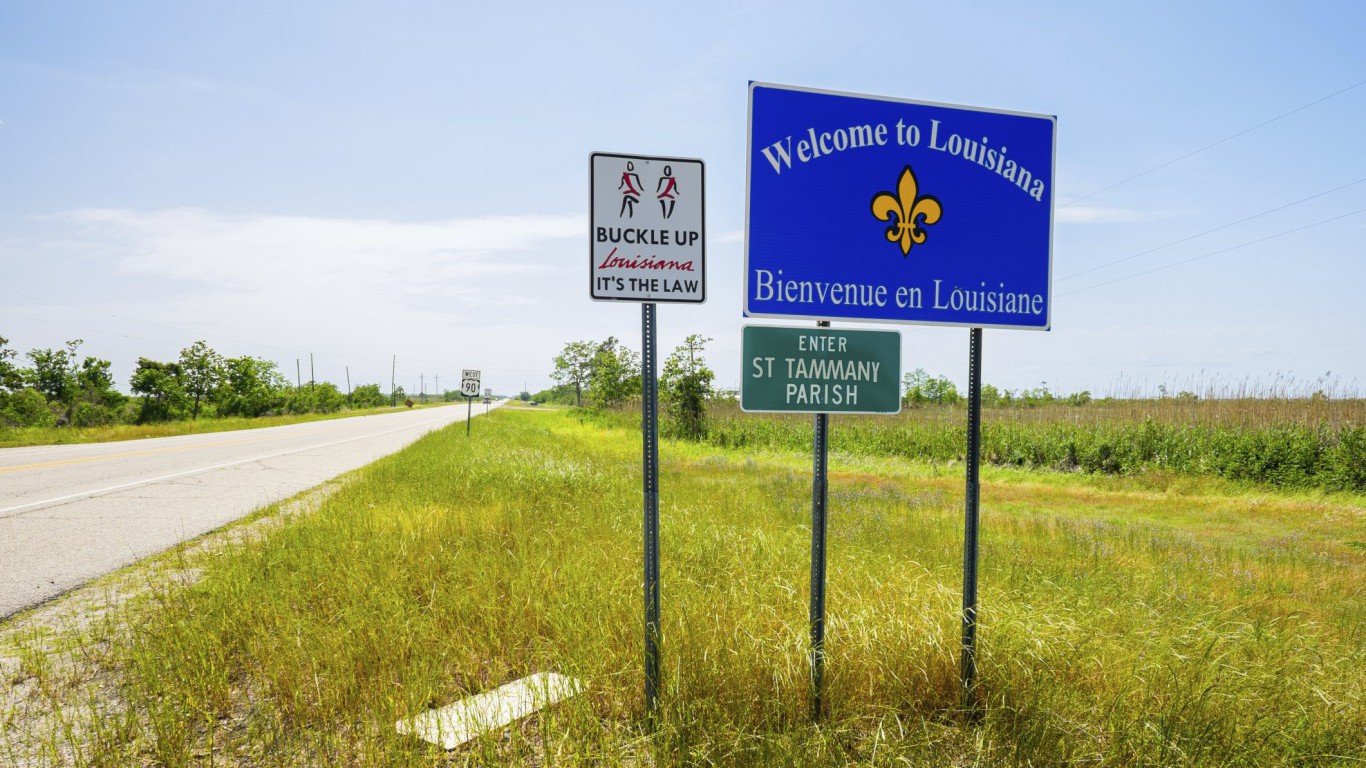
50. Louisiana
> 1-yr. real GDP change: +0.2% (4th smallest growth)
> Avg. salary: $46,643 (20th lowest)
> Adults w/ bachelor’s degree: 23.4 (tied — 5th lowest)
> Patents issued: 8.5 (5th fewest)
> Working-age population chg. 2010-2020: +0.3% (the smallest growth)
No state is worse for business than Louisiana. Working-age Louisianans are less likely than working-age Americans to have the qualifications for higher-skilled, higher-paying jobs. Just 23.4% of adults in the state have a bachelor’s degree, nearly the lowest percentage of all states.
The presence of science, technology, engineering, and mathematics-related occupations usually reflects a business-friendly environment where companies can grow. In Louisiana, just 3.2% of occupations are STEM jobs, the third lowest share of all states. Also, unlike most states, Louisiana’s working-age population is also declining. In the Census’ American Survey of Entrepreneurs, 46% of state businesses reported unpredictable conditions having a negative impact on their business, and 48% reported slow business or lost sales, each among the highest shares in the country.
Detailed Findings
A number of region-specific policies, costs, and regulations affect a state’s business climate, including liability and oversight laws, utility costs, insurance requirements, and tax policy.
For many businesses, the most important consideration for choosing one place over another is human capital. Corporations will often choose to locate in major metropolitan area, where costs are higher but where the workforce tends to be more skilled. States that have high shares of adults with bachelor’s and advanced degrees, and states that show growth among the working-age population present a greater diversity of potential hires for corporations.
For many corporations, the potential livability of an area is just as important as the talent pool to be found there. Workers might be more willing to relocate to or stay in a city or state with a lower cost of living, with easier access to airports, less congestion, and more cultural and recreational opportunities. We considered all of these measures in our index.
Another reason businesses choose to locate to a given city or state is to be near other related operations and close to innovation and growth opportunities created and shared by related industries. Such interaction and focus on new technologies can be found in California’s Silicon Valley and North Carolina’s Research Triangle.
Many of the best states for business foster a healthy entrepreneurial atmosphere, with high volumes of venture capital deals and patents issued. Many of these states have a high share of jobs in STEM fields — science, technology, engineering, and math — allowing them to better facilitate technologically advanced business activity. The high presence of STEM jobs, patents, and venture capital indicate the potential for growth and innovation that can allow local businesses to adapt and thrive.
It is important to note that while this index is an attempt to measure the best states for businesses, this list should by no means be treated as the best states for workers. In states with more lax regulations on businesses, workers are more likely exposed to risks and have fewer rights. In our index, we favored states where wages tend to be lower compared to the average compensation across the country, but lower wages are of course a significant negative for workers.
A common argument is that what is good for business is also, in the end, good for workers. Indeed, incomes tend to be higher and unemployment lower in the higher-ranked states on our list, and keeping workers happy is an important consideration for many businesses. But the recent economic recovery appears to have favored corporations more than individuals. While business incomes are higher than ever, the national poverty rate has increased. At the very least, the relationship between what is good for business and what is good for workers is complicated.
Methodology
To determine the best and worst states for business, 24/7 Wall St. compiled 47 measures into eight categories: economic conditions, business costs, state infrastructure, the availability and skill level of the workforce, quality of life, regulations, technology and innovation, and cost of living. Each category aimed to capture essential elements that businesses consider when deciding where to locate.
Each category consists of several measures. We created an index for each category using a geometric mean. We then used the geometric mean of each index score to calculate the overall scores.
Two categories — labor and human capital, and technology and innovation — received double weight, and quality of life and cost of living were given half weights. Cost of business, infrastructure, economy, and regulation received full weight.
The business costs index contains business expenses that can vary between states. A state’s ranking in the Tax Foundation’s 2017 Tax Climate Index was included to capture the impact of state-level taxes on business. We also looked at 2016 commercial prices of electricity from the Energy Information Administration (EIA). From the Bureau of Economic Analysis (BEA), we included average compensation per job in 2015 computed as a percentage of average wages and salaries, as well as average wages and salaries in each state.
The cost of living index considers costs to both households and businesses. We included a housing affordability ratio, calculated using median annual homeownership costs as a percentage of median household income. Both measures are from the U.S. Census Bureau’s 2015 American Community Survey (ACS). Also included were regional price parity, a measure of the cost of living, for 2014 from the BEA, and the average state and local tax burden as a percent of per capita income from the Tax Foundation. Tax Foundation figures are for the 2012 fiscal year.
Economy is the broadest category and was designed to measure each state’s productivity, growth potential, and labor market. We included both one- and five-year growth rates in real GDP from the BEA, as well as annual and average five-year unemployment rates from the Bureau of Labor Statistics (BLS). We also included data on the number of population-adjusted building permits issued in 2015 from the Department of Housing and Urban Development.
Because many businesses benefit from higher consumer spending, the economy index includes state poverty rates and the individual earnings gap between men and women, both from the 2015 ACS. We added the value of goods shipped from each state in 2016, as well as the growth of non-government establishments between 2014 and 2015 from the County Business Patterns (CBP). Both datasets are produced by the Census. Population density per square land mile from the Census. Finally, we created a composite rank of each state’s credit ratings from Standard & Poor’s and Moody’s Investor Service.
The infrastructure index captures the importance of transportation to businesses and employees. From the Federal Highway Administration (FHWA) we looked at the percentage of bridges deemed structurally deficient or functionally obsolete as of the end of 2016. Also from the FHWA, we used the percentage of rural and urban interstate miles in poor condition. Poor was defined as interstate roads with an International Roughness Index score greater than 170. We also considered FHWA data on state investments per road mile in 2014. From the Federal Aviation Administration, we looked at the number of public use airports in each state, as well as estimated costs to commercial trucking due to traffic congestion in 2016 from the American Transportation Research Institute. Lastly, we used workers’ average commute time in each state from the 2016 ACS.
The labor and human capital index offers a look at the quality of a state’s labor force. We included data on high school, bachelor’s, and graduate educational attainment rates from the 2015 ACS. We also looked at per-pupil education expenditures in each state for 2014 from Education Week. Finally, we incorporated our own population projections from 2010 through 2020, using both the growth in total population as well as the projected growth in the working-age population. Population projections were calculated using the cohort component method and used population data from the ACS and birth and survival rates from the Centers for Disease Control and Prevention.
The quality of life index was constructed to offer insight into why employees may decide to reside in particular areas. We included each state’s 2016 violent crime rate from the FBI, and the percentage of people without health insurance in 2015 from the ACS. We also used the United Health Foundation’s 2015 State Health ranking. From the Department of Education, we incorporated the total number of post-secondary schools in each state. We also looked at the number of art, entertainment, and recreation establishments per 100,000 state residents in 2015 from the CBP.
The regulation index includes each state’s status as a right-to-work state, as well as the share of non-agricultural workers who were union members as of 2014 from UnionStats. Additionally, the index includes parts of the Mercatus Center’s 2016 Regulatory Freedom Index, and the Institute for Legal Reform’s 2015 Lawsuit Climate Index, an indication of how fair and reasonable a state’s legal system is perceived to be by businesses.
The technology and innovation index includes data on the average venture capital investment in businesses in each state as well as the frequency of venture capital deals. Both metrics are from the National Venture Capital Association and are for 2014. From the U.S. Patent and Trade Office, we included the number of patents issued to state residents in 2015. We used the Milken Institute’s 2016 State Technology and Science Index and the number of science, technology, engineering, and mathematics (STEM) jobs as a share of all jobs calculated from BLS occupation data.
Additionally, we considered the 2015 results of the U.S. Census Bureau’s American Survey of Entrepreneurs. The ASE is annual survey of business owners, who reported on the ease of doing business in their state based on measures such as tax policy, business conditions, access to qualified labor, and other regional factors.
Contact [email protected] for any questions or corrections.