[cnxvideo id=”507734″ placement=”ros”]Violent crime is a broad designation consisting of the most egregious infractions — aggravated assault, robbery, rape, and murder. According to the FBI, there were 386 violent crimes for every 100,000 people in the United States in 2016. While the crime rate has fluctuated slightly in recent years, the incidence of violent crime in the United States remains effectively unchanged from half a decade ago.
The national violent crime rate does not tell the whole story, however. Crime is a local issue, and in some parts of the country, violence is surging.
The causes for the increases in violent crime vary from one city to the next, be it worsening socioeconomic conditions, soaring drug-related crime, or changes in policing, among other factors. In some cases, the increases were largely the result of one major year-over-year spike in crime, while in other cities the increases resulted from steady upticks over the last five years. Differences aside, the incidence of violent crime has climbed by over 30% in every metro area on this list.
24/7 Wall St. reviewed FBI data for nearly 200 metropolitan areas nationwide to identify the cities where crime is soaring.
Click here to see the cities where crime is soaring.
Click here to see our detailed findings and methodology.

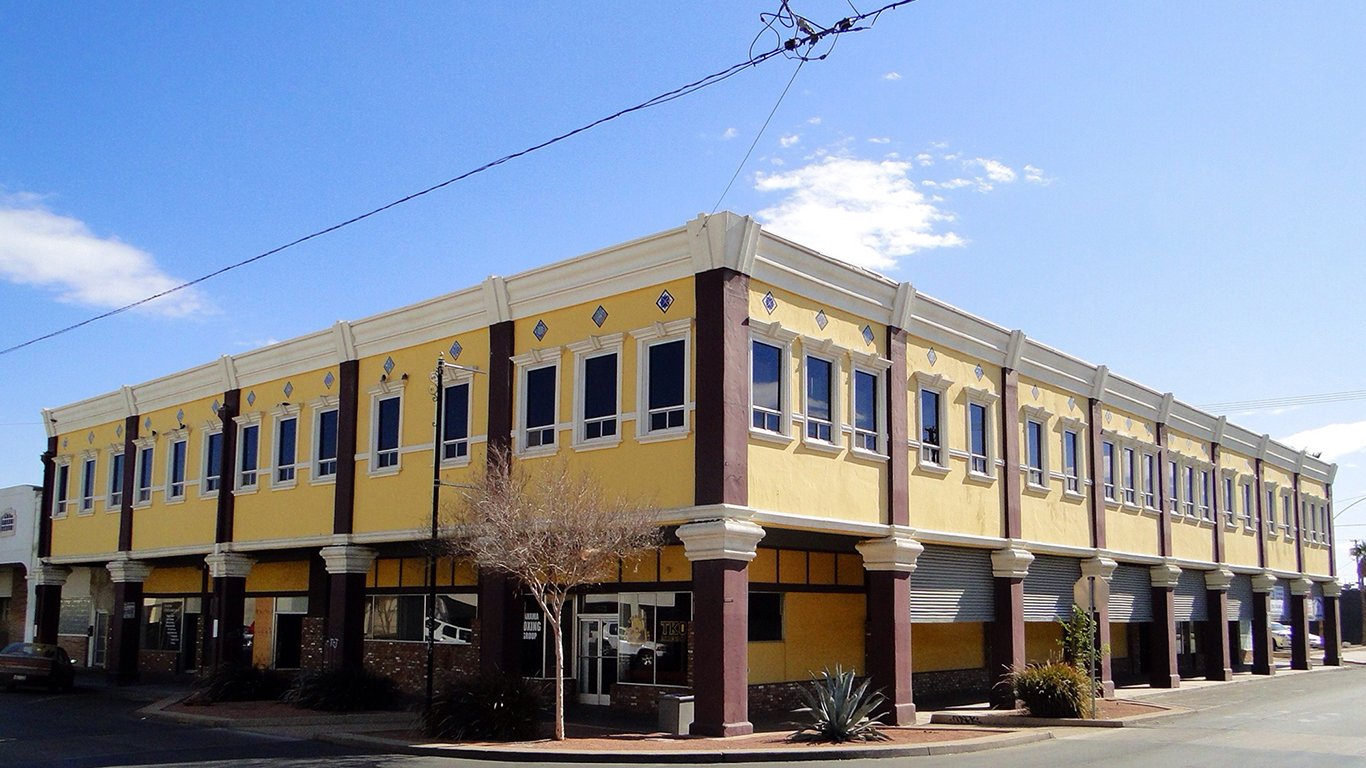
25. San Angelo, TX
> 5-yr. violent crime rate change: +32.7%
> 2011 violent crime rate: 251.4 per 100,000 (total: 287)
> 2016 violent crime rate: 333.5 per 100,000 (total: 403)
> December unemployment rate: 3.4%
> Poverty rate: 11.8%
While violent crime has remained relatively flat nationwide over the last five years, in San Angelo the crime rate rose from 251 incidents per 100,000 residents in 2011 to 334 per 100,000 in 2016 — one of the largest increases of any metro area. Crime is closely tied to changes in economic conditions and will often increase if incomes in an area decline or poverty and unemployment rise. While the U.S. median household income rose 7.4% over the last five years, incomes remained statistically stagnant in San Angelo.
Despite the spike in crime, San Angelo’s violent crime rate is still lower than the national rate of 386 incidents per 100,000 Americans.
[in-text-ad]

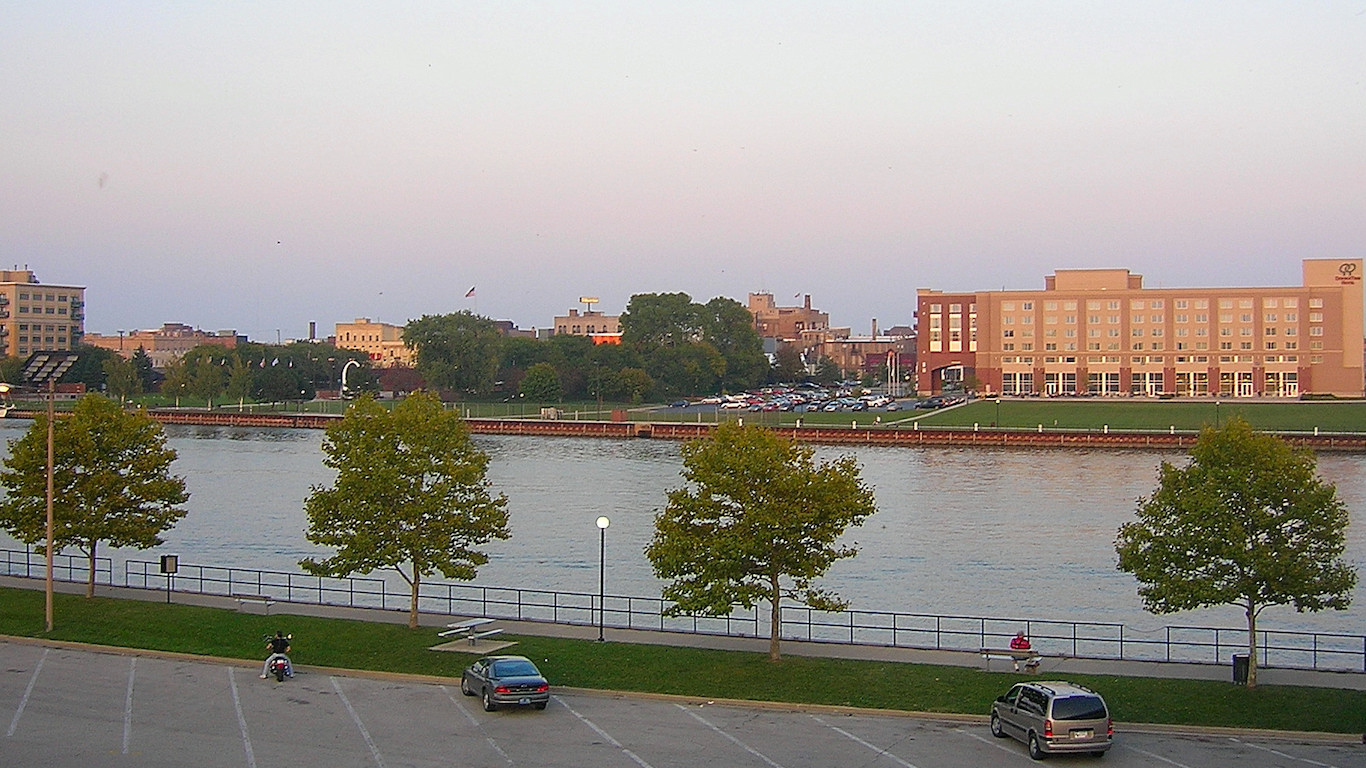
24. Waterloo-Cedar Falls, IA
> 5-yr. violent crime rate change: +33.5%
> 2011 violent crime rate: 331.4 per 100,000 (total: 559)
> 2016 violent crime rate: 442.4 per 100,000 (total: 756)
> December unemployment rate: 3.2%
> Poverty rate: 14.6%
Over the last five years, the violent crime rate in the Waterloo-Cedar Falls, Iowa metro area climbed by 33.5%. The metro area used to be safer than the nation as a whole, but due to a climbing violent crime rate over the past half decade, even as the U.S. violent crime rate remained relatively flat, that is no longer the case. There were 442 violent crimes in the area for every 100,000 residents in 2016, more than the 386 per 100,000 U.S. violent crime.
The area’s surge in violent crime coincided with slower than typical economic improvement. While the U.S. unemployment rate fell from 8.9% to 4.9% over the last five years — a 4 percentage point improvement — the jobless rate in the Waterloo-Cedar Falls metro area fell by just 1 percentage point over the same period, from 5.5% to 4.5%.
[recirclink id=444492]
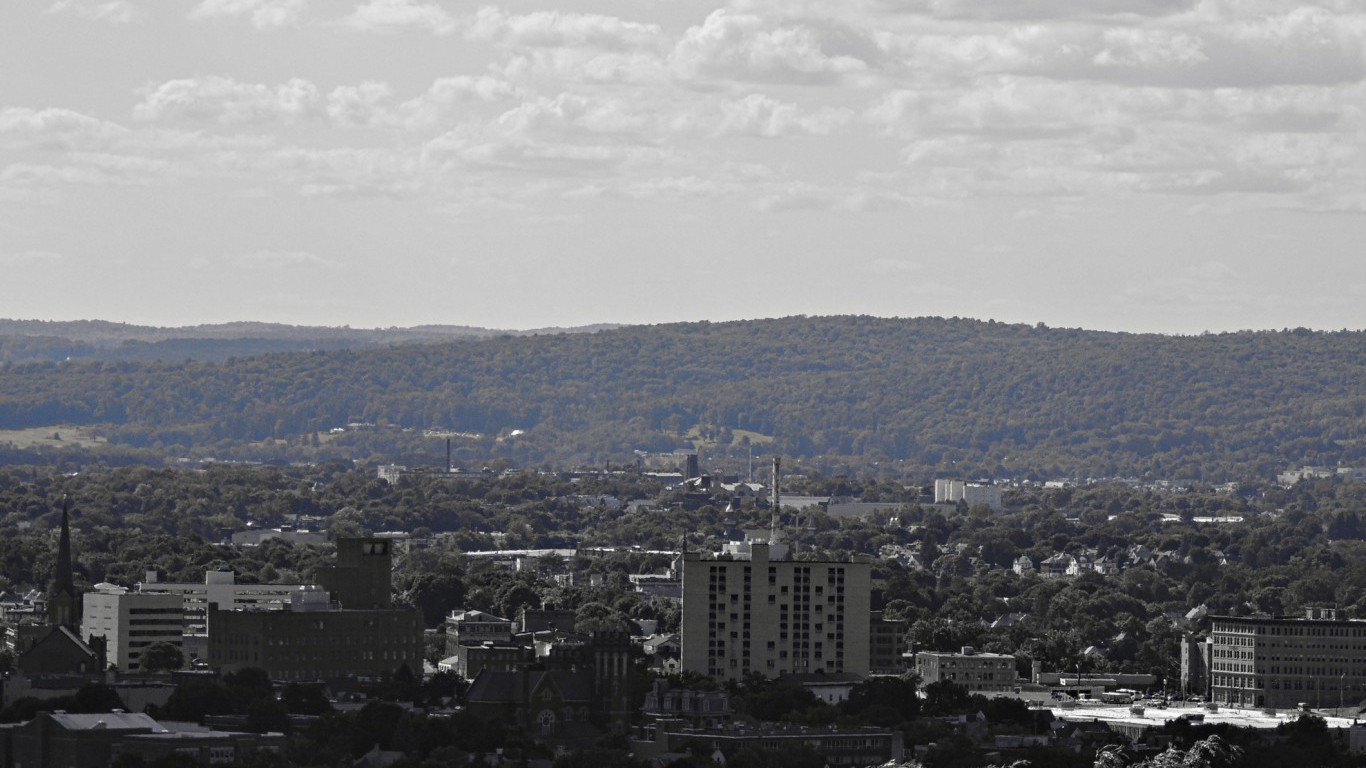
23. Binghamton, NY
> 5-yr. violent crime rate change: +33.5%
> 2011 violent crime rate: 216.7 per 100,000 (total: 548)
> 2016 violent crime rate: 289.3 per 100,000 (total: 704)
> December unemployment rate: 5.5%
> Poverty rate: 16.0%
There were 289 violent crimes per 100,000 residents in Binghamton in 2016, up from 217 incidents per 100,000 residents in 2011. While the violent crime rate in the city surged 33.5% over the last five years, the property crime rate fell 19.1%. There were 2,128 burglaries, larcenies, and motor vehicle thefts per 100,000 Binghamton residents in 2016, down from 2,629 property crimes per 100,000 in 2011.
Crime often fluctuates with income and poverty, rising in areas that become poorer and falling in areas gaining wealth. While the U.S. median household income rose 7.4% over the last five years and the poverty rate fell from 15.9% to 14.0%, incomes and poverty in the Binghamton metro area did not improve meaningfully.

22. Fort Wayne, IN
> 5-yr. violent crime rate change: +33.6%
> 2011 violent crime rate: 223.5 per 100,000 (total: 935)
> 2016 violent crime rate: 298.5 per 100,000 (total: 1,288)
> December unemployment rate: 3.0%
> Poverty rate: 14.5%
While the violent crime rate nationwide has remained largely unchanged from five years ago, in Fort Wayne crime rose from 224 incidents per 100,000 residents in 2011 to 299 per 100,000 in 2016. The 33.6% increase in violent crime was the second largest spike of any metro area in Indiana and one of the largest in the country. Despite the increase, Fort Wayne’s violent crime rate remains far below the national rate of 386 violent crimes per 100,000 Americans.
Like many metro areas with increasing violent crime rates, Fort Wayne’s economy is relatively stagnant. As the national poverty rate fell from 15.9% in 2012 to 14.0% in 2016 and the median household income rose 7.4%, poverty and incomes remained statistically unchanged in Fort Wayne.
[in-text-ad-2]
21. Des Moines-West Des Moines, IA
> 5-yr. violent crime rate change: +33.8%
> 2011 violent crime rate: 277.7 per 100,000 (total: 1,590)
> 2016 violent crime rate: 371.7 per 100,000 (total: 2,352)
> December unemployment rate: 2.6%
> Poverty rate: 9.5%
The violent crime rate in the Des Moines-West Des Moines metro area is 33.8% higher now than it was five years ago. With the exception of a slight dip in violent crime in 2013, the incidence of violent crime has increased in the metro area in each of the last five years. Despite the increase, Des Moines remains a relatively safe place. There were 372 violent crimes for every 100,000 metro area residents in 2016, slightly lower than the 386 per 100,000 U.S. violent crime rate.
A rising crime rate coincided with an expanding population in the metro area. The number of people living in Des Moines-West Des Moines increased by 7.8% over the last half decade, making it one of the fastest growing metro areas in the country.
20. Bay City, MI
> 5-yr. violent crime rate change: +35.0%
> 2011 violent crime rate: 273.9 per 100,000 (total: 295)
> 2016 violent crime rate: 369.7 per 100,000 (total: 389)
> December unemployment rate: 5.7%
> Poverty rate: 15.9%
The violent crime rate rose 35.0% in Bay City over the past five years, from 274 incidents per 100,000 residents in 2011 to 370 per 100,000 in 2016 — the largest increase of any metro area in Michigan and one of the largest nationwide. Despite the increase, Bay City’s violent crime rate remains far below the national rate of 386 incidents per 100,000 Americans.
As is the case in many metro areas with increasing violent crime rates, some economic conditions are relatively stagnant in Bay City, Michigan. While nationwide the poverty rate fell from 15.9% to 14.0% over the past five years, Bay City’s poverty rate remained effectively unchanged over the same period.
[in-text-ad]
19. Chico, CA
> 5-yr. violent crime rate change: +35.7%
> 2011 violent crime rate: 258.8 per 100,000 (total: 576)
> 2016 violent crime rate: 351.2 per 100,000 (total: 790)
> December unemployment rate: 5.1%
> Poverty rate: 19.9%
The violent crime rate in Chico rose from 259 incidents per 100,000 residents in 2011 to 351 per 100,000 residents in 2016. The 35.7% increase in violent crime was the third largest of any metro area in California and one of the largest in the country. There was also a substantial increase in property crime in the city. The property crime rate rose 34.5% over the past five years, from 2,415 instances of burglary, larceny, and motor vehicle theft per 100,000 residents in 2011 to 3,248 property crimes per 100,000 residents in 2016 — the second largest increase in the nation.
While crime tends to rise with unemployment, Chico’s unemployment rate has fallen by more than half over the past five years, from 13.7% in 2011 to 6.5% in 2016 — one of the largest declines in the nation.
[recirclink id=444468]
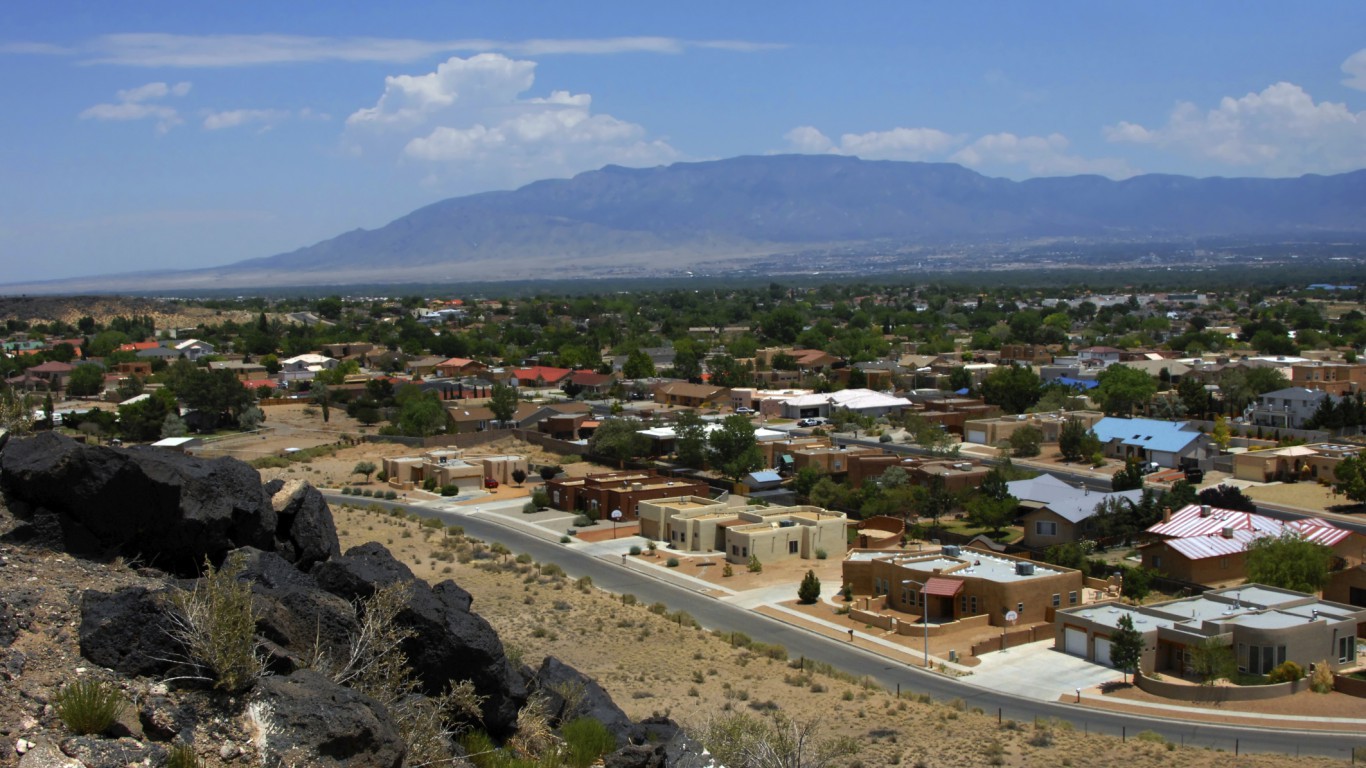
18. Albuquerque, NM
> 5-yr. violent crime rate change: +36.1%
> 2011 violent crime rate: 662.0 per 100,000 (total: 5,938)
> 2016 violent crime rate: 901.0 per 100,000 (total: 8,173)
> December unemployment rate: 5.5%
> Poverty rate: 16.9%
With a violent crime rate of 901 documented incidents per 100,000 residents, Albuquerque, New Mexico, is one of the most dangerous metro areas in the United States. The metro area is also a far more dangerous place than it was five years ago. Since 2011, the incidence of violent crime in New Mexico’s largest metro area climbed by 36.1%, one of the steepest increases in the country.
The city of Albuquerque is taking active measures to reduce crime in the coming months and years. In February 2018, officers from the New York City Police Department worked with officers in Albuquerque to find areas for improvement. Mayor Tim Keller believes the city can benefit from the help as New York City reported a 75% reduction in crime over the last 35 years. Additionally, the the city council recently voted to raise taxes, partially in order to bolster staffing in the city’s police department.
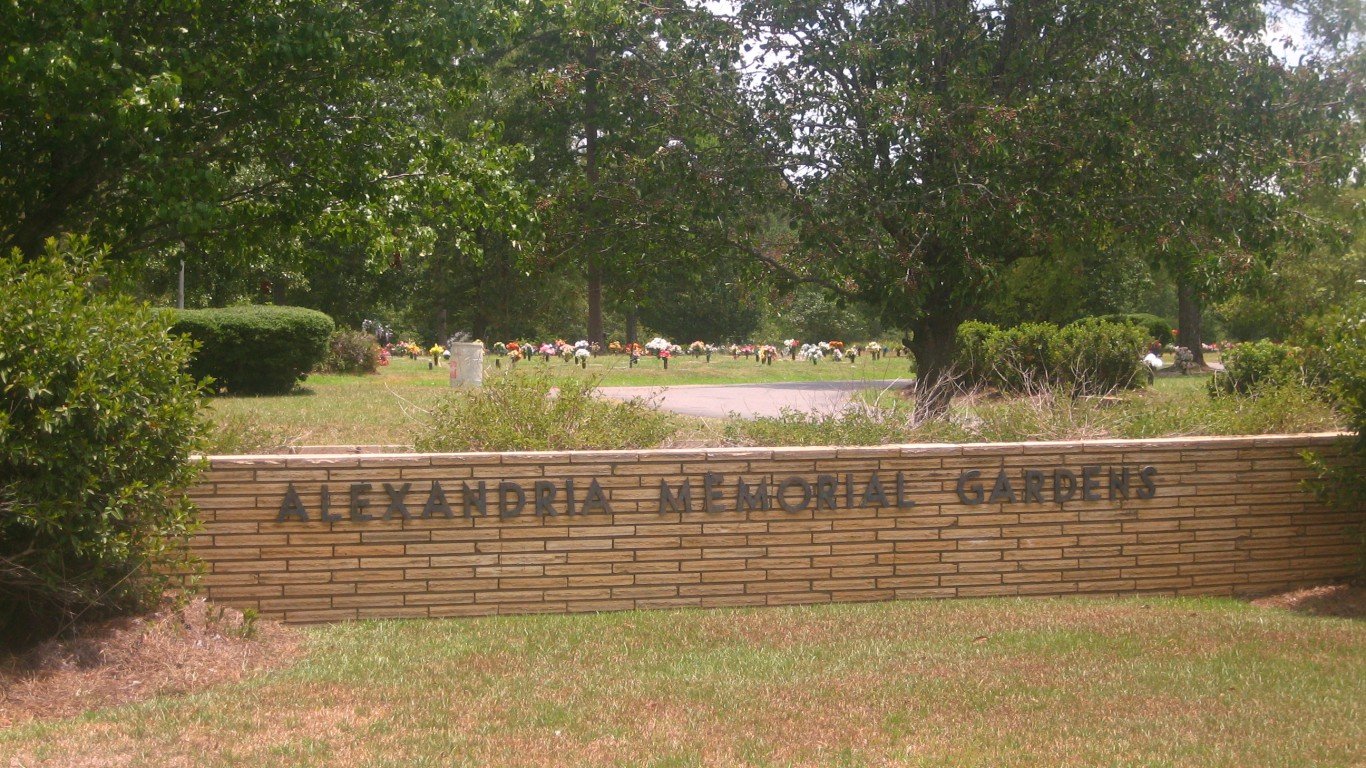
17. Alexandria, LA
> 5-yr. violent crime rate change: +36.2%
> 2011 violent crime rate: 677.9 per 100,000 (total: 1,053)
> 2016 violent crime rate: 923.2 per 100,000 (total: 1,422)
> December unemployment rate: 4.9%
> Poverty rate: 19.7%
The violent crime rate in Alexandria, Louisiana, of 923 incidents for every 100,000 residents is higher than in all but three other metro areas tracked by the FBI. As is the case nationwide, aggravated assaults accounted for the vast majority of reported violent crimes in the city in 2016. And as is the case with every other metro area on this list, Alexandria is a far more dangerous place now than it was five years ago. Since 2011, the incidence of reported violent crimes climbed by 36.2% across the metro area.
Alexandria Mayor Jacques Roy announced in September 2017 plans to create a new division within the police department to engage with at risk youth. Whether or not the mayor’s plan will help to reduce the violent crime rate in the city remains to be seen.
[in-text-ad-2]

16. Danville, IL
> 5-yr. violent crime rate change: +37.3%
> 2011 violent crime rate: 588.7 per 100,000 (total: 482)
> 2016 violent crime rate: 808.3 per 100,000 (total: 634)
> December unemployment rate: 6.0%
> Poverty rate: 20.9%
The incidence of violent crime in the Danville metro area increased by 37.3% over the last five years, even as the violent crime rate nationwide remained relatively flat. As a result of the steep increase, there were 808 violent crimes in the metro area per 100,000 residents in 2016, more than double the comparable rate nationwide of 386 per 100,000. Despite the near nation-leading violent crime rate and increase in crime, the metro area reported no homicides in 2016 compared to three in 2011. As is the case in nearly every metro area, aggravated assault accounted for the bulk of reported violent crimes in Danville in 2016.
Economically depressed areas are more likely to report higher crime rates. In Danville, 20.9% of the population lives below the poverty line, a far greater share than the 14.0% U.S. poverty rate.
15. Harrisonburg, VA
> 5-yr. violent crime rate change: +37.3%
> 2011 violent crime rate: 118.4 per 100,000 (total: 150)
> 2016 violent crime rate: 162.6 per 100,000 (total: 214)
> December unemployment rate: 3.5%
> Poverty rate: 18.1%
The violent crime rate in Harrisonburg rose from 118 incidents per 100,000 residents in 2011 to 163 per 100,000 in 2016. The increase of 37.3% was the largest spike of any Virginia metro area and one of the largest of any metro area nationwide. The city also recorded a slight increase in property crime. While nationwide the number of burglaries, larcenies, and motor vehicle thefts per 100,000 Americans fell by 15.7% over the past five years, in Harrisonburg it rose by 3.9%, from 1,312 property crimes per 100,000 residents in 2011 to 1,363 per 100,000 in 2016.
Despite the increase, the violent and property crime rates in Harrisonburg remain far lower than the national rates of 386 violent incidents and 2,451 property crimes per 100,000 Americans, and among the lowest in the country.
[in-text-ad]

14. Logan, UT-ID
> 5-yr. violent crime rate change: +38.8%
> 2011 violent crime rate: 47.7 per 100,000 (total: 61)
> 2016 violent crime rate: 66.2 per 100,000 (total: 90)
> December unemployment rate: 2.7%
> Poverty rate: 12.3%
Not all metro areas with a rising violent crime rate are dangerous. Logan is one such area. Violent crime in Logan, Utah, is up 38.8% from half a decade ago. Despite the increase, the city is the safest metro area of those tracked by the FBI. There were only 66 reported violent crimes for every 100,000 residents in 2016, nearly one-sixth the comparable U.S. violent crime rate of 386 incidents per 100,000 people. Unadjusted for population, there were a total of just 90 reported violent crimes in Logan in 2016.
[recirclink id=444391]

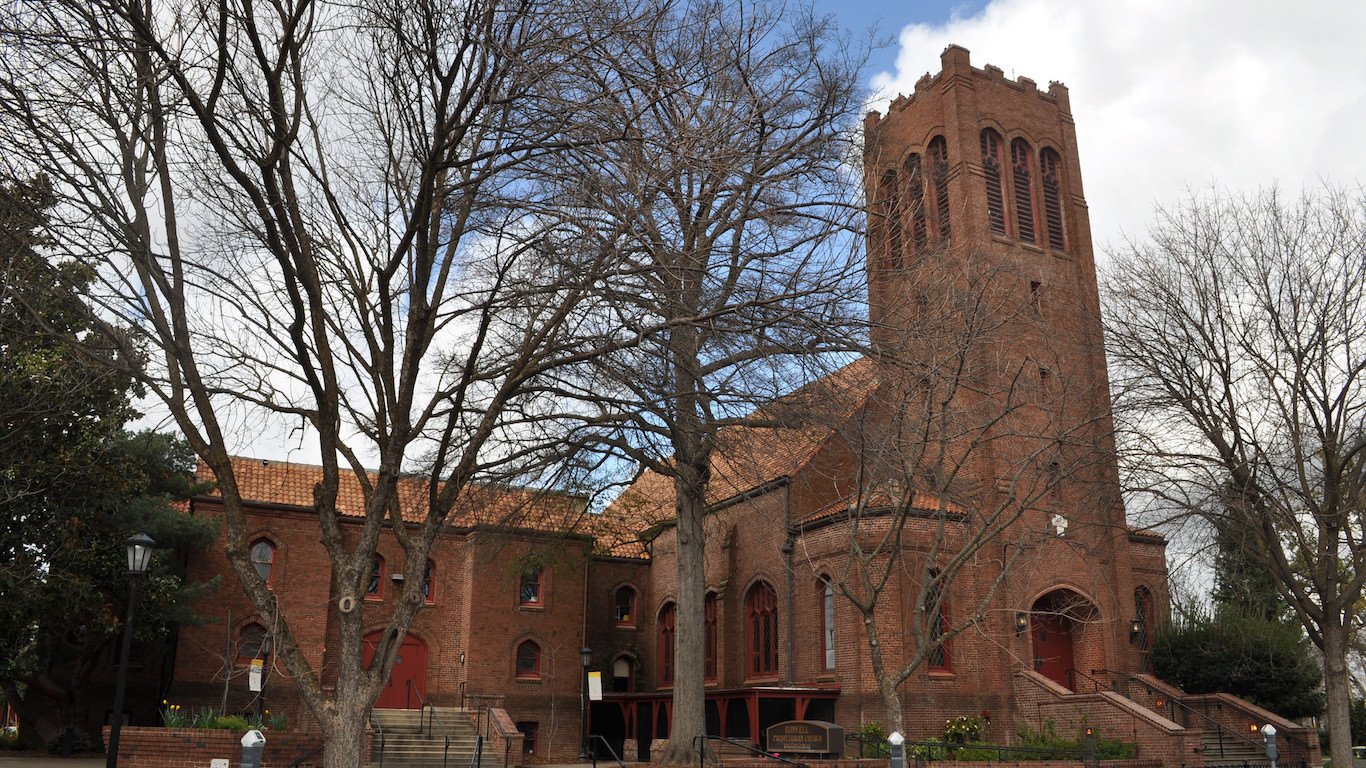
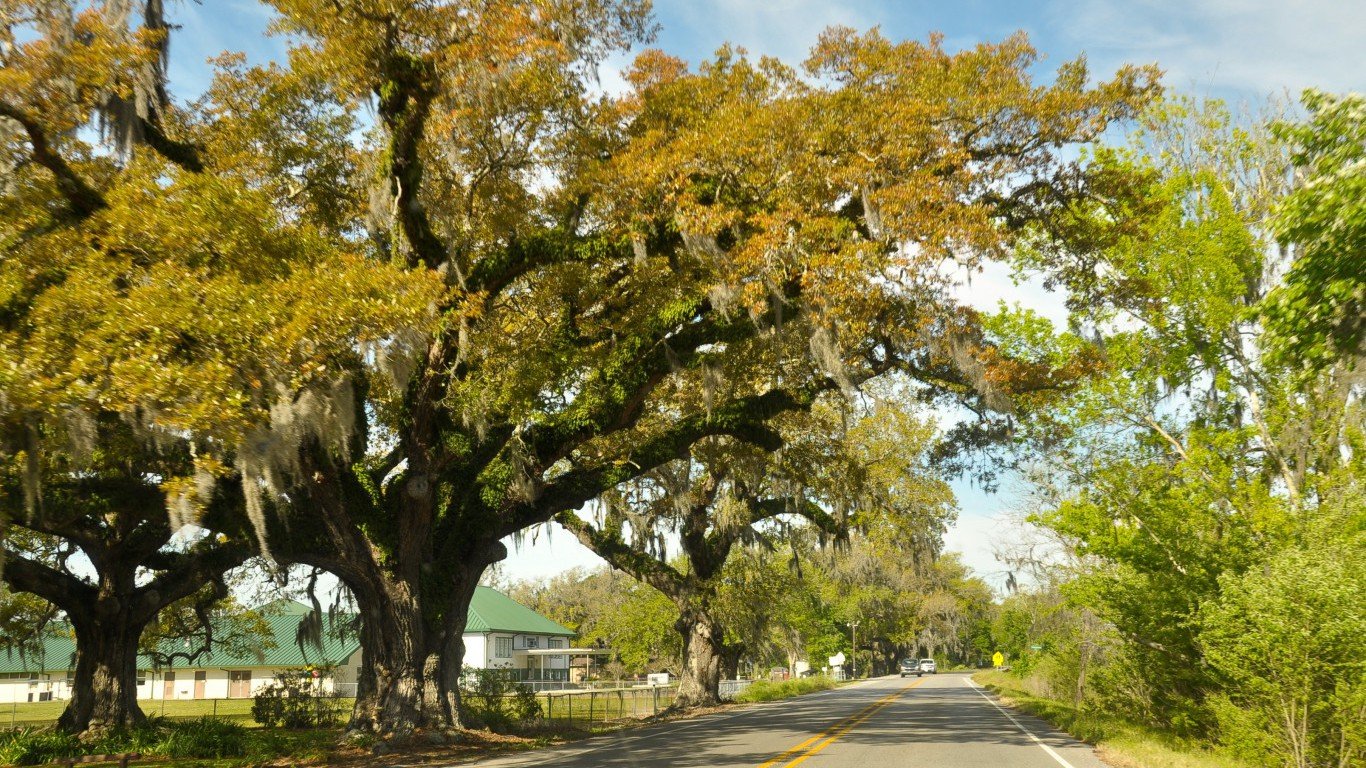
13. Albany, GA
> 5-yr. violent crime rate change: +39.2%
> 2011 violent crime rate: 527.7 per 100,000 (total: 841)
> 2016 violent crime rate: 734.8 per 100,000 (total: 1,121)
> December unemployment rate: 5.2%
> Poverty rate: 25.0%
The incidence of violent crime climbed by 39.2% in the Albany metro area in the last five years. Today, with a violent crime rate of 735 incidents per 100,000 residents, Albany is the most dangerous metro area in Georgia for which data is available. Though murder comprises the smallest share of all violent crimes in the metro area, it is a bigger problem in Albany than in any other metro area on this list. There were about 12 homicides in the metro area for every 100,000 people in 2016, more than double the U.S. murder rate of 5 per 100,000.
Crime rates are often higher in economically depressed areas, and in the Albany metro area, 1 in every 4 residents live in poverty, a far greater share than the 14.0% U.S. poverty rate.

12. Anchorage, AK
> 5-yr. violent crime rate change: +41.3%
> 2011 violent crime rate: 789.2 per 100,000 (total: 2,454)
> 2016 violent crime rate: 1,114.9 per 100,000 (total: 3,519)
> December unemployment rate: 6.7%
> Poverty rate: 7.2%
After climbing by a near nation-leading 41.3% in the last five years, the violent crime rate in Anchorage, Alaska, is the second highest of any metro area tracked by the FBI. There were 1,115 violent crimes in the metro area for every 100,000 residents in 2016, nearly three times the violent crime across the U.S. as a whole.
Disengaged members of society are more likely to commit serious crimes than actively engaged citizens, and the relatively high unemployment rate in Anchorage may be indicative of too few jobs to support the population. As of December, 6.7% of the metro area’s workforce were out of a job, one of the highest unemployment rates of any U.S. metro area and well above the comparable 4.1% U.S. rate.
[in-text-ad-2]

11. Springfield, MO
> 5-yr. violent crime rate change: +41.7%
> 2011 violent crime rate: 426.0 per 100,000 (total: 1,867)
> 2016 violent crime rate: 603.6 per 100,000 (total: 2,775)
> December unemployment rate: 3.1%
> Poverty rate: 15.8%
Springfield, Missouri, is one of only a dozen metro areas to report a more than a 40% spike in the violent crime rate in the last five years. Violent crime in the city increased from 426 reported incidents per 100,000 residents in 2011 to 604 per 100,000 in 2016, climbing steadily almost every year.
As is the case nationwide, aggravated assault accounted for the majority of violent crimes in the Springfield metro area. There were 1,926 reported cases of aggravated assault in the metro area in 2016, more than four times the number of robberies, the next most common violent crime.
10. Houma-Thibodaux, LA
> 5-yr. violent crime rate change: +42.8%
> 2011 violent crime rate: 314.6 per 100,000 (total: 661)
> 2016 violent crime rate: 449.1 per 100,000 (total: 954)
> December unemployment rate: 4.6%
> Poverty rate: 20.9%
Houma-Thibodaux is one of three Louisiana metro areas to make this list. As recently as five years ago, it was the safest city in the state. There were 315 violent crimes per 100,000 people in the area in 2011 — the least of any Louisiana metro area tracked by the FBI and far below the 387 per 100,000 U.S. violent crime rate at the time. By 2016, the metro area was no longer the safest in the state, recording a violent crime rate of 449 incidents per 100,000 residents — well above the U.S. rate of 386 per 100,000.
The surge in crime is a relatively recent phenomenon in Houma-Thibodaux. The area’s violent crime rate fell or remained relatively steady from 2011 through 2014 — only to spike sharply in 2015 and remain high in 2016. Crime rates often increase in periods of economic decline, and Houma-Thibodaux is one of only two metro areas considered to report a higher poverty rate in 2016 than in 2011. Half a decade ago, 16.0% of the population lived in poverty compared to a 20.9% poverty rate in 2016.
[in-text-ad]
9. El Centro, CA
> 5-yr. violent crime rate change: +43.8%
> 2011 violent crime rate: 270.7 per 100,000 (total: 478)
> 2016 violent crime rate: 389.3 per 100,000 (total: 701)
> December unemployment rate: 20.0%
> Poverty rate: 24.6%
The violent crime rate in El Centro, California, increased by 43.8% in the last five years, a larger increase than in all but eight other U.S. metro areas. Meanwhile, the U.S. crime rate remained relatively flat over the same period. Despite the increasing violence, El Centro is about as safe as the U.S. as a whole. There were 389 violent crimes in the metro area in 2016 for every 100,000 residents, in line with 386 per 100,000 U.S. violent crime rate.
Poor areas with lagging economies are often more dangerous than prosperous parts of the country, and improved economic conditions in El Centro may go a long way in reducing crime. Currently, about 1 in every 4 metro area residents live below the poverty line, and about 1 in every 5 metro area workers are unemployed — each among the largest such shares nationwide. In comparison, 14% of Americans live in poverty and 4.1% of the labor force is unemployed.
[recirclink id=444326]

8. Farmington, NM
> 5-yr. violent crime rate change: +51.6%
> 2011 violent crime rate: 625.1 per 100,000 (total: 822)
> 2016 violent crime rate: 947.4 per 100,000 (total: 1,100)
> December unemployment rate: 6.7%
> Poverty rate: 16.9%
Farmington, New Mexico, is one of only eight U.S. metro areas to report a more than 50% surge in violent crime over the last five years. Due to the steep increase, Farmington is now the most dangerous metro area in the state. Half a decade ago, the metro area’s violent crime rate of 625 incidents per 100,000 residents was lower than the comparable rate in the Albuquerque metro area. Though Albuquerque is also considerably more dangerous than it was in 2011, its 2016 violent crime rate is lower than the Farmington’s rate of 947 incidents per 100,000 people.
Crime became more common in Farmington as its job market worsened. While unemployment fell nationwide from 8.9% to 4.9% in the last five years, Farmington’s unemployment rate broke from the trend and climbed from 7.9% to 8.9% over the same period.
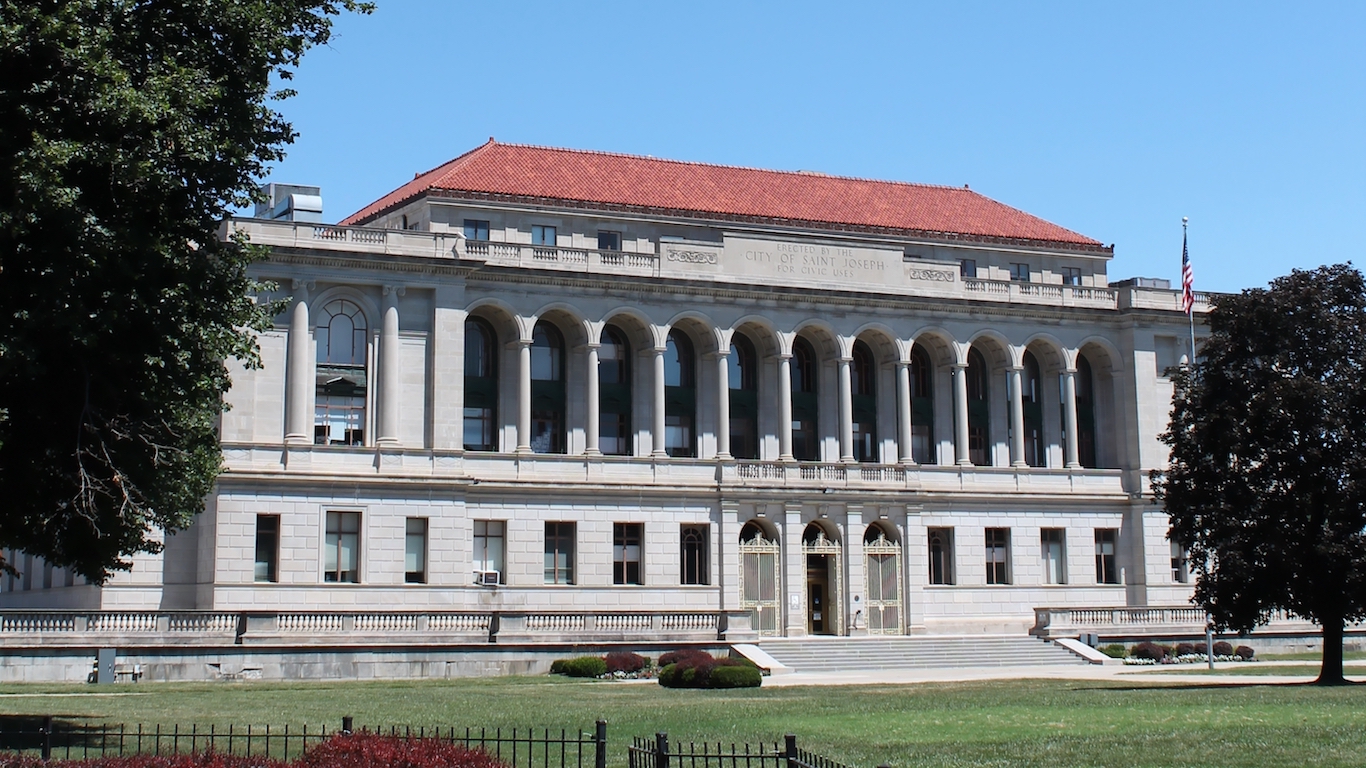
7. St. Joseph, MO-KS
> 5-yr. violent crime rate change: +52.6%
> 2011 violent crime rate: 275.4 per 100,000 (total: 352)
> 2016 violent crime rate: 420.2 per 100,000 (total: 532)
> December unemployment rate: 3.3%
> Poverty rate: 16.2%
As recently as five years ago, the St. Joseph metro area was safer than the U.S. as a whole. There were just 275 violent crimes in the metro area for every 100,000 residents in 2011, compared to 387 per 100,000 nationwide. However, the incidence of violent crime has since soared by 52.6% in the St. Joseph metro area, while it remained relatively flat nationwide. As of 2016, there were 420 violent crimes in the metro area for every 100,000 people, above the comparable nationwide rate.
Officials in the St. Joseph metro area point to drugs as a leading cause of crime. In recent years, shifts in drug use from marijuana and crack cocaine to meth, prescription pills, and black tar heroin have coincided with climbing crime rates.
[in-text-ad-2]

6. Dubuque, IA
> 5-yr. violent crime rate change: +56.5%
> 2011 violent crime rate: 155.1 per 100,000 (total: 146)
> 2016 violent crime rate: 242.8 per 100,000 (total: 237)
> December unemployment rate: 2.9%
> Poverty rate: 10.6%
Over the last five years, Dubuque experienced one of the largest increases in violent crime of any city. The incidence of violent crime in the metro area rose by 56.5%, from 155 violent crimes per 100,000 residents in 2011 to 243 per 100,000 in 2016 — the sixth largest increase in the country. Dubuque also had a slight increase in property crime. While nationwide the number of burglaries, larcenies, and motor vehicle thefts per 100,000 U.S. residents fell by 15.7% over the past five years, property crime rose by 3.7% in the metro area, from 2,030 instances per 100,000 residents in 2011 to 2,104 per 100,000 in 2016.
Despite the increases in crime, Dubuque remains one of the safest places in the country. The metro area’s violent and property crime rates are far lower than the national rates of 386 violent crimes and 2,451 property crimes per 100,000 Americans, and among the lower such figures in the country.
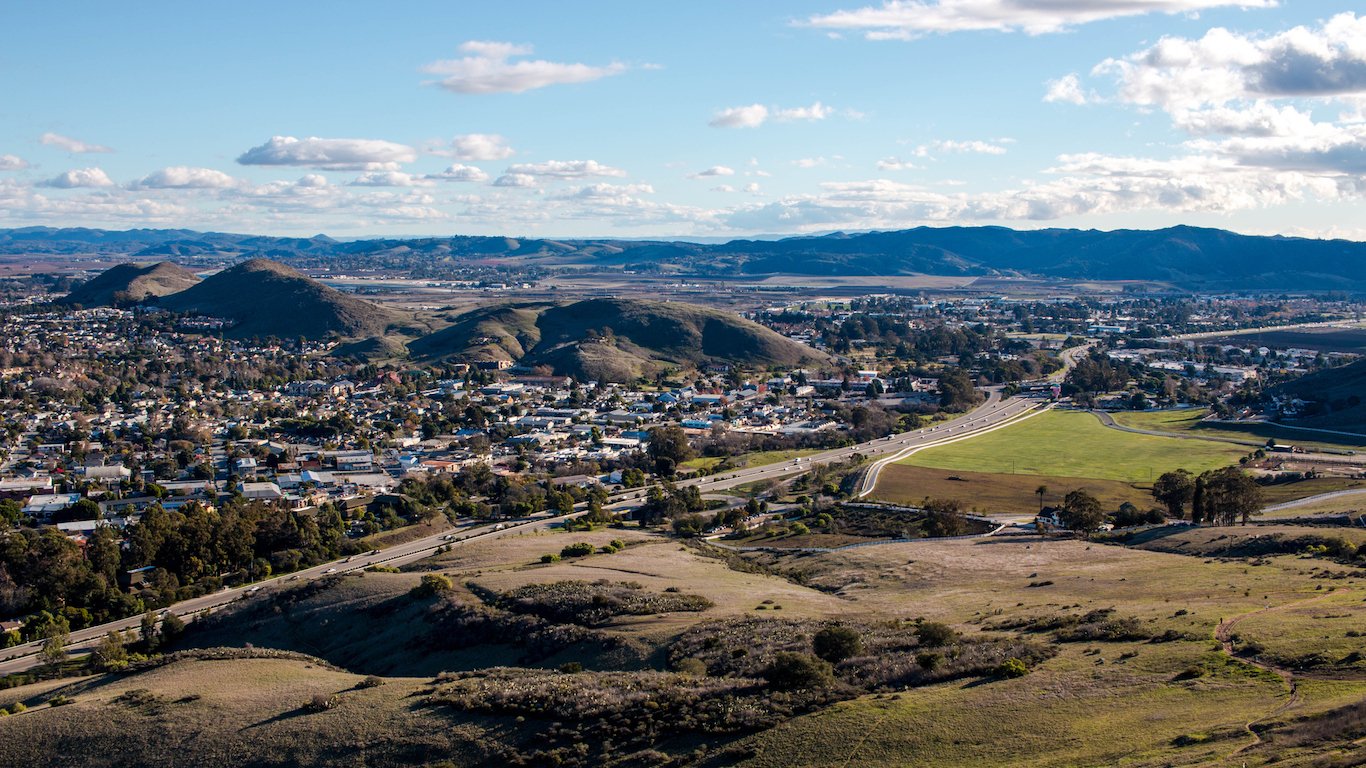
5. San Luis Obispo-Paso Robles-Arroyo Grande, CA
> 5-yr. violent crime rate change: +58.7%
> 2011 violent crime rate: 249.3 per 100,000 (total: 680)
> 2016 violent crime rate: 395.6 per 100,000 (total: 1,115)
> December unemployment rate: 3.1%
> Poverty rate: 10.6%
The violent crime rate in the San Luis Obispo-Paso Robles-Arroyo Grande metro area climbed by 58.7% over the last five years. Over the same period, the violent crime rate nationwide remained relatively flat. Despite the crime spike, the metro area’s 2016 crime rate of 396 incidents per 100,000 residents is only slightly higher than the 386 per 100,000 U.S. violent crime rate. Additionally, the metro area remains a safer place than most of California’s 25 other metro areas for which data is available.
While violence is more common in the metro area than it was five years ago, San Luis Obispo-Paso Robles-Arroyo Grande has gotten safer in recent years. The metro area’s 2016 violent crime rate is a considerable improvement from the 2014 rate of 421 crimes per 100,000 people.
[in-text-ad]

4. Gainesville, GA
> 5-yr. violent crime rate change: +67.3%
> 2011 violent crime rate: 156.0 per 100,000 (total: 284)
> 2016 violent crime rate: 261.0 per 100,000 (total: 512)
> December unemployment rate: 3.7%
> Poverty rate: 13.2%
The incidence of violent crime in Gainesville soared 67.3% over the last five years, the largest increase of any metro area in Georgia and one of the largest in the country. Most of the increase took place between 2015 and 2016. The metro area also reported a slight increase in property crime. Despite falling in four of the last five years, the incidence of burglary, larceny and motor vehicle theft rose by 3.5% from 2,475 incidents per 100,000 residents in 2011 to 2,562 per 100,000 in 2016. Nationwide, the incidence of property crime fell by 15.7% over the same period.
While violent crime increased in Gainesville more than in all but three other metro areas in the past five years, it remains well below the national rate of 386 violent crimes per 100,000 Americans.
[recirclink id=444046]

3. Michigan City-LaPorte, IN
> 5-yr. violent crime rate change: +79.5%
> 2011 violent crime rate: 167.8 per 100,000 (total: 188)
> 2016 violent crime rate: 301.2 per 100,000 (total: 333)
> December unemployment rate: 4.2%
> Poverty rate: 16.2%
The violent crime rate in the Michigan City-LaPorte metro area climbed by nearly 80% over the last five years — the third steepest increase of any U.S. metro area. While the violent crime rate has been steadily climbing for years in many metro areas on this list, Michigan City-LaPorte is not one of them. The metro area’s violent crime rate remained relatively flat between 2011 and 2015, only to nearly double from 156 incidents per 100,000 residents in 2015 to 301 per 100,000 in 2016.
Despite the recent spike in the violent crime, Michigan City-LaPorte remains relatively safe. The city’s 2016 violent crime rate is lower than in the majority of metro areas in Indiana and well below the 386 per 100,000 violent crime rate nationwide.

2. Sioux Falls, SD
> 5-yr. violent crime rate change: +80.4%
> 2011 violent crime rate: 215.1 per 100,000 (total: 497)
> 2016 violent crime rate: 388.1 per 100,000 (total: 994)
> December unemployment rate: 3.1%
> Poverty rate: 8.9%
The violent crime rate in Sioux Falls has ticked up nearly every year in the last half decade. Steady year-over-year increases resulted in an 80.4% overall surge in the metro area’s violent crime rate, from 215 incidents per 100,000 residents in 2011 to 388 per 100,000 in 2016. Despite the steep increase in crime, Sioux Falls remains safer than Rapid City, the only other metro area in South Dakota for which the FBI tracks violent crime. There were 495 violent crimes for every 100,000 people in the Rapid City metro area in 2016.
Preliminary reports for 2017 indicate that violent crime may be on its way down in Sioux Falls. However, as is the case in much of the country, drug-related crimes are on the rise in the area.
[in-text-ad-2]
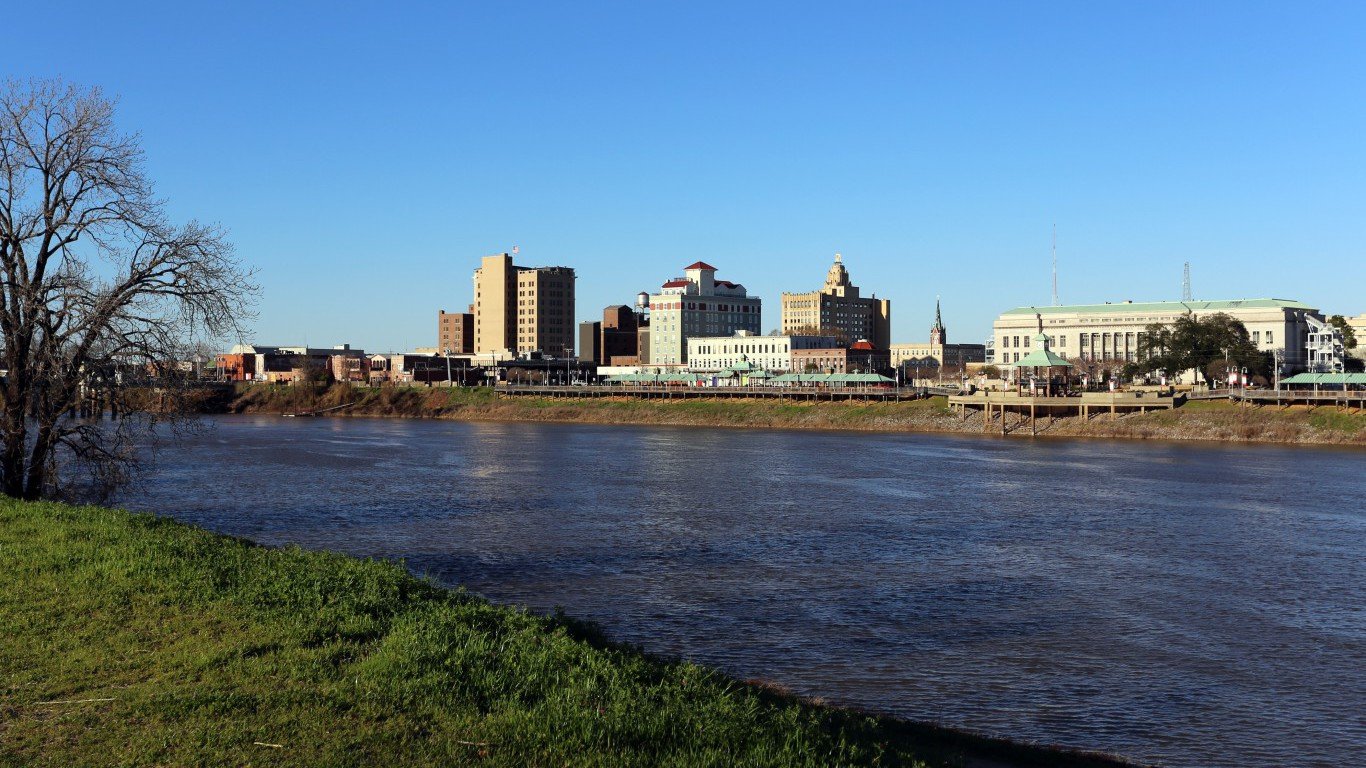
1. Monroe, LA
> 5-yr. violent crime rate change: +85.5%
> 2011 violent crime rate: 639.7 per 100,000 (total: 1,139)
> 2016 violent crime rate: 1,186.9 per 100,000 (total: 2,126)
> December unemployment rate: 4.7%
> Poverty rate: 24.0%
Violent crime surged by 85.5% in the Monroe, Louisiana, metro area over the last five years — the largest increase of any metro area in the country. Due to the increase, the Monroe’s violent crime rate of 1,187 incidents per 100,000 people is now the highest of any U.S. metro area. The total number of 20 murders and 324 robberies logged by police in 2016 were each more than double the number of murders and robberies recorded in 2011. Economically depressed areas are at greater risk of high crime rates, and in the Monroe metro area, 24.0% of the population lives below the poverty line — well above the 14.0% U.S. poverty rate.
In mid-2017, Monroe Mayor Jamie Mayo argued that youth intervention and gun-buyback programs aimed at preventing crimes were a preferable tactic to addressing violence in the metro area than increased policing and arrests. What impact the mayor’s approach will have remains to be seen.
Detailed Findings & Methodology
Among the metro areas on this list, reported increases in the violent crime rate between 2011 and 2016 range from 32.7% to 85.5%. Despite the steep increases in violence, not all metro areas on this list are dangerous places.
The violent crime rate is lower than the U.S. rate of 386 incidents per 100,000 people in 11 of the 25 metro areas with the largest surges in violent crime. In Logan, Utah, for example, despite a 38.8% five-year increase in violence, there were just 66 reported violent crimes for every 100,000 people in 2016 — the lowest violent crime rate of any U.S. metro area for which data was available.
On the other hand, while every city on this list is a more dangerous place than it was half a decade ago, some rank among the most dangerous places in the country. Six of the metro areas reporting the greatest spikes in violence have a violent crime rate more than double the U.S. rate as a whole. In Monroe, Louisiana, the 85.5% increase in violent crime over the last five years was the greatest increase of any metro area. Partially as a result, with a violent crime rate of 1,187 incidents for every 100,000 people, Monroe now ranks as the most dangerous metro area in the country.
While explanations for the rising incidence of violent crime vary by city, there are some common factors that many cities on this list share. The United States is in the midst of a drug crisis on an unprecedented scale. According to the Substance Abuse and Mental Health Services Administration, some 11.5 million American teens and adults misused prescription painkillers in 2016. An estimated 2 million of them are addicted to pain medication, and for many addicts, heroin is a less expensive and easier to obtain alternative to prescription opioids. In many cities on this list, local authorities point to surging illicit drug activity as a primary cause of increasing violence.
Low-income areas with lagging economies are also often more likely to report higher rates of violent crime. While nationwide, unemployment has fallen considerably since 2011, four metro areas tracked by the FBI reported an increase in unemployment between 2011 and 2016. In three of those — including Farmington, New Mexico and Houma-Thibodaux, Louisiana, which are on this list — the violent crime rate rose over the same period.
Similarly, Waterloo-Cedar Falls, Iowa and Houma-Thibodaux were the only two metro areas to report a higher poverty rate in 2016 than in 2011. Both metro areas reported near nation-leading increases in violent crime over the same period, at 33.5% and 42.8%, respectively.
To identify the cities where crime is soaring, 24/7 Wall St. reviewed the percent change in the violent crime rate for metropolitan statistical areas between 2011 and 2016 from the FBI’s annual Uniform Crime Report. To be considered, areas had to have retained the same geographic boundaries during the period covered. Total violent crimes, property crimes, and each of their constituent crime types also came from the FBI.
We also considered for each MSA various social and economic data from the U.S. Census Bureau’s 2016 American Community Survey, including the median household income and poverty rate.
Contact [email protected] for any questions or corrections.