Special Report
Cities Where Crime Is Plummeting

Published:
Last Updated:

Violent crime rate in the United States rose slightly in 2015, from 362 incidents per 100,000 people in 2014 to 373 incidents per 100,000 Americans. Still, the long-term trend of violent crime nationwide has been one of steady improvement. In 1996, there were 637 violent crimes per 100,000 Americans, and the rate has declined nearly every year since.
Violent crime is a broad category that includes rape, robbery, aggravated assault, and murder. These crimes have become less common across the country, but in some metropolitan areas, the decline has been much more pronounced. In Bend-Redmond, Oregon, the violent crime rate fell by 46.6%, from 331 reported incidents per 100,000 people in 2011 to 177 incidents per 100,000 people in 2015 — one of the lowest rates in the country. Based on figures published by the FBI, these are the metropolitan areas where the violent crime rate is plummeting.
[in-text-ad]
Violent and nonviolent crimes do not always have the same root causes, and factors driving down burglary and theft may have little impact on murder and assault. Still, there appears to be some relationship, as all 15 cities on this list where there was a decline in violent crime also reported a decline in property crime. In all but four of the 15 metropolitan areas, property crime declined faster than the national decline of 11.7% over the five year period.
Click link to see the cities where crime is plummeting.
The cities that reported large five-year decreases in violent crime rates tended to relatively safer to begin with. Of the 15 metro areas on this list, all but four had violent crime rates below the national rate of 387 reported incidents per 100,000 Americans in 2011. Of the remaining four, in two the violent crime rates declined to below the national rate of 373 per 100,000 by 2015. The exceptions to this are Farmington, New Mexico and Flint, Michigan. Flint had the worst violent crime rate in the country in 2011 among major metropolitan areas, at 841 incidents per 100,000 residents. The metro’s current rate of 581 incidents per 100,000 is now 27th worst.
In Flint, and in many of the other cities on this list, the declines in violent crime are likely due to a recovery from the effects of the recession. This includes the Bend metro area. The city had a dramatic spike in violent crime between 2007 and 2011 as its economy suffered from the effects of the recession
The relationship between economic prosperity and crime in cities like Bend is complicated. In an interview with 24/7 Wall St., John Roman, senior fellow at the independent research organization NORC at the University of Chicago, explained that violent crime rates go hand in hand with several socioeconomic measures. There is much evidence that in areas without economic opportunities, residents — young men in particular — are more likely to turn to drug dealing and other kinds of crime.
Roman added that the relationship between economic development and crime is not one-way. Businesses and potential residents are less likely to choose to locate to a high crime neighborhood. “[You] really need to do something about crime and violence before you can see economic growth in a city,” Roman said.
Many of the cities on this list that reported sharp increases in violent crime during the recession were forced to find creative solutions to bring crime back down to pre-recession levels. Bend, for example, hired a crime analytics officer and developed a new records system to engage in predictive crime mapping. Other cities on this list hired officers to serve as neighborhood resources and develop community relationships, which can be a highly effective preventative strategy.
Based on figures published by the FBI’s Uniform Crime Report, 24/7 Wall St. identified the 15 metropolitan statistical areas where crime rates declined the most from 2011 to 2015, the most recent available year of data. In order to be considered, areas had to retain the same geographic boundaries during the period covered, and they had to retain consistent reporting practices. Additionally, we reviewed annual unemployment figures from the Bureau of Labor Statistics for 2011 and 2015, as well as unemployment figures from December 2016. We also considered data from the Census Bureau’s 2015 American Community Survey on household income, educational attainment rates, and poverty.
These are the 15 U.S. cities where violent crime is plummeting.

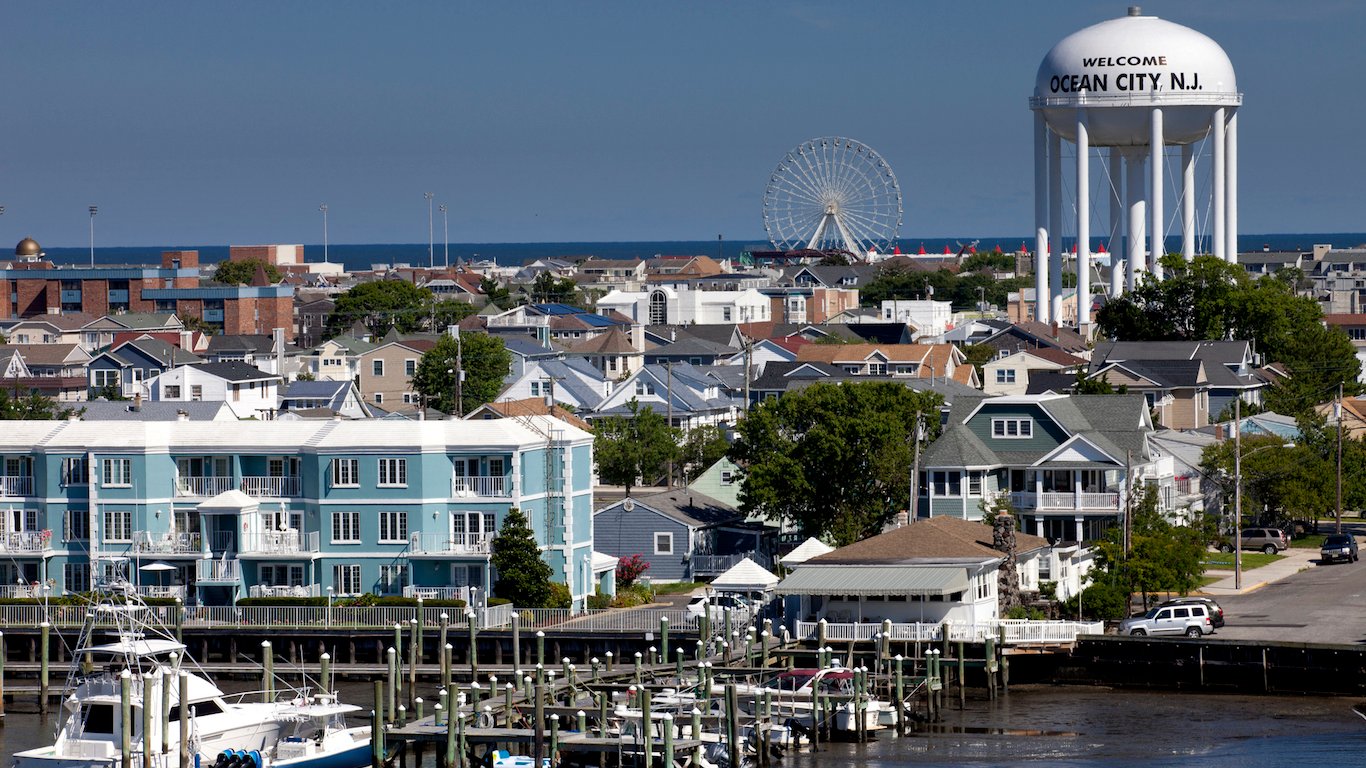
15. Ocean City, NJ
> 5-yr. violent crime rate change: -27.3%
> 2011 violent crime rate: 316.6 per 100,000
> 2015 violent crime rate: 230.2 per 100,000
> Murders in 2015: 1
Ocean City, New Jersey has become a considerably safer city in the last half decade. Since 2011, the metro area’s violent crime rate has dropped by 27.3%, the 15th largest such decline of all major metro areas. The city’s annual violent crime rate of 230 incidents for every 100,000 residents is well below the national rate of 373 incidents per 100,000 Americans.
As its violent crime rate fell, so too did Ocean City’s incidence of property crimes, such as burglary and theft. Throughout the metro area, 4,656 property crimes were reported for every 100,000 residents in 2011, a higher rate than in all but half a dozen other U.S. metro areas. Over the last five year’s the area’s property crime rate fell by 27.9% to 3,338 property crimes per 100,000 people.
[in-text-ad]

14. Cheyenne, WY
> 5-yr. violent crime rate change: -27.4%
> 2011 violent crime rate: 244.4 per 100,000
> 2015 violent crime rate: 177.4 per 100,000
> Murders in 2015: 7
Five years ago, 244 violent crimes were reported per 100,000 people in Cheyenne, Wyoming, far less than the national violent crime rate of 387 incidents per 100,000 people at the time. Since then, the U.S. violent crime rate has dropped by 3.9%, while Cheyenne’s violent crime rate dipped by 27.4%, one of the largest drops of any U.S. metro area.
In every city across the country, homicide contributes very little to the overall violent crime rate, which also includes, rape, aggravated assault, and robbery. Though Cheyenne’s overall violent crime rate is low, the metro area’s murder rate of 7.2 per 100,000 residents is surprisingly high — higher than in all but a few dozen other U.S. metros.

13. York-Hanover, PA
> 5-yr. violent crime rate change: -28.3%
> 2011 violent crime rate: 303.4 per 100,000
> 2015 violent crime rate: 217.5 per 100,000
> Murders in 2015: 19
Few U.S. metro areas have reported as steep a drop in violent crime rate as York-Hanover, Pennsylvania. There area’s crime rate fell from 303 per 100,000 residents in 2011 to 218 per 100,000 residents in 2015, a 28.3% drop. Over the same time period, the property crime rate also fell by 22.3% in the York-Hanover metro area.
Though there is not likely a single cause for the metro area’s crime reduction, improving economic conditions certainly did not hurt. The metro area’s annual unemployment rate fell from 7.5% in 2011 to 4.6% in 2015.

12. Kennewick-Richland, WA
> 5-yr. violent crime rate change: -28.5%
> 2011 violent crime rate: 254.9 per 100,000
> 2015 violent crime rate: 182.3 per 100,000
> Murders in 2015: 8
Many of U.S. metro areas with rapidly declining violent crime rates were relatively dangerous five years ago. Kennewick-Richland, Washington, on the other hand, was not. There were only 255 violent crimes for every 100,000 area residents in 2011, well below the national violent crime 387 incidents per 100,000 people the same year. Since then, the nation’s violent crime rate has declined by 3.9%, while Kennewick crime rate has plummeted by 28.5%.
Recent studies suggest that widespread violent crime can be a major drag on local economies. Kennewick-Richland’s improving crime rate may foreshadow coming economic improvements. Since 2011, the metro area’s unemployment rate has fallen from 8.5% to 6.7%, an impressive drop but a jobless rate that is still far above the national rate. Perhaps further improvements are on the way.
[in-text-ad-2]

11. Las Cruces, NM
> 5-yr. violent crime rate change: -28.9%
> 2011 violent crime rate: 367.7 per 100,000
> 2015 violent crime rate: 261.3 per 100,000
> Murders in 2015: 6
Las Cruces was once among the top 100 most violent metropolitan areas, but today it is relatively safe. The metro area’s violent crime rate fell from 368 incidents per 100,000 residents in 2011 to 261 incidents per 100,000 residents in 2015. The 28.9% drop in crime was one of the most substantial of any city.
The presence of crime often increases in tandem with poverty and unemployment, but Las Cruces bucks the trend. Despite the substantial drop in crime, the metropolitan area had the smallest improvement in unemployment of any city nationwide. While the national unemployment rate fell from 8.9% to 5.3% in the last five years, the Las Cruces annual unemployment rate inched lower from 7.5% to 7.4%, and remains one of the highest of any metro area.

10. Brunswick, GA
> 5-yr. violent crime rate change: -29.1%
> 2011 violent crime rate: 505.1 per 100,000
> 2015 violent crime rate: 358.2 per 100,000
> Murders in 2015: 3
Multiple closely-related socioeconomic conditions are improving considerably in Brunswick, Georgia. Most significantly, the metro area’s violent crime rate is falling more rapidly than most other U.S. metros. In 2011, there were 505 violent crimes for every 100,000 Brunswick residents, well above the 387 per 100,000 national violent crime rate. Following a 29.1% dip, Brunswick’s violent crime rate stands at 358 incidents per 100,000 residents, lower than the national 373 per 100,000 violent crime rate.
Economic development and violence reduction go hand in hand, and in addition to a falling violent crime rate, Brunswick’s population is growing rapidly. The metro area’s population has increased 7.7% since 2011, one of the largest growth rates in the country over the time period. The local economy is adjusting to the rapid growth well. The unemployment rate has declined in Brunswick from 10.8% in 2011 to its current level of 5.5%.
[in-text-ad]

9. Farmington, NM
> 5-yr. violent crime rate change: -29.1%
> 2011 violent crime rate: 625.1 per 100,000
> 2015 violent crime rate: 443.0 per 100,000
> Murders in 2015: 5
Farmington is one of two metro areas in New Mexico to report significant five-year declines in the violent crime rate. Just five years ago, the Farmington metro area ranked among the 20 most violent metros in the country. Since then, the violent crime rate has fallen 29.1%. Still, with 443.0 violent crimes for every 100,000 residents, Farmington remains more dangerous than the vast majority of U.S. metro areas. It is one of only two metros on this list where, despite a significant decline, the violent crime rate remains above the U.S. rate of 373 incidents per 100,000 residents.
One factor likely related to the area’s still-high violent crime is its struggling economy. Economic prosperity can have a cyclical relationship with criminal activity, as people are more likely to turn to crime in areas with fewer opportunities, and crime can often hinder economic growth. Farmington’s unemployment rate of 8.7% is well above the national unemployment rate of 4.7%, and one of the highest in the country.

8. Rome, GA
> 5-yr. violent crime rate change: -29.6%
> 2011 violent crime rate: 498.0 per 100,000
> 2015 violent crime rate: 350.5 per 100,000
> Murders in 2015: 11
Violent crime in the Rome metro area fell in the past five years. The metro’s violent crime rate in 2011 of 498 incidents per 100,000 residents was far higher than the national rate of 387 incidents per 100,000 Americans that year. By 2015, the area’s violent crime rate fell to 351 incidents per 100,000 residents, below the national rate of 373 incidents per 100,000.
Rampant job losses in most U.S. cities during the Great Recession led to near-record high levels of crime and unemployment. In 2011, an estimated 12.1% of Rome’s labor force was unemployed, far higher than the 8.9% national unemployment rate at the time. Over the past five years, however, Rome’s unemployment rate fell to just 5.7%, one of the largest improvements of any city nationwide. As economic conditions continue to improve, Rome’s crime rate may continue to decline.

7. Flint, MI
> 5-yr. violent crime rate change: -30.9%
> 2011 violent crime rate: 841.2 per 100,000
> 2015 violent crime rate: 581.4 per 100,000
> Murders in 2015: 53
Low violent crime levels help foster economic growth, which in turn helps lower the incidence of violence. This cyclical relationship is difficult to break, and many areas with falling crime rates were already relatively safe five years ago. Flint is an exception. There were 841 violent crimes reported per 100,000 Flint residents in 2011, the highest rate of all major metro areas that year. Since then, despite the 31% decline, the current rate of 581.4 violent crimes per 100,000 people remains among the highest in the country. The reduction is still remarkable, however. Recent research has shown that community programs, like the ones implemented by the Michigan Youth Violence Prevention Center, have played major roles in Flint’s crime drop.
Still, Flint continues to struggle with problems that can lead to greater violence, like segregation. Based on a standard measure of segregation — the dissimilarity index — Flint is the eighth most racially segregated large metropolitan area in the country.
[in-text-ad-2]

6. Bridgeport-Stamford-Norwalk, CT
> 5-yr. violent crime rate change: -31.4%
> 2011 violent crime rate: 293.6 per 100,000
> 2015 violent crime rate: 201.5 per 100,000
> Murders in 2015: 23
Between 2011 and 2015, the Bridgeport-Stamford-Norwalk violent crime rate fell from 294 incidents per 100,000 residents to 202 per 100,000. The 31.4% decrease was the sixth largest of any metro area, as the city reached its lowest level of crime in nearly 40 years. A news release from the Bridgeport government website attributes the improvement to a “growing economy,” and “efforts to crack down on gun and gang violence.” While Bridgeport’s median household income of $86,414 a year is the third highest of any metro area and rising, the city also has the largest income gap between rich and poor.

5. Lexington-Fayette, KY
> 5-yr. violent crime rate change: -32.6%
> 2011 violent crime rate: 380.3 per 100,000
> 2015 violent crime rate: 256.3 per 100,000
> Murders in 2015: 20
Lexington Police Commander Gregg Jones told reporters in 2015 that in response to violent crime, the department always directs “additional internal resources to areas where there’s been an uptick in criminal activity” to both investigate ongoing cases and prevent future crimes. It seems that efforts to curb criminal activity may have had some effect as the Lexington-Fayette violent crime rate fell from 380 incidents per 100,000 residents in 2011 to 256 per 100,000 in 2015. While the number of homicides reported in the metro area rose from 17 to 20 over the same period, there were 30 fewer robberies, and the number of aggravated assaults fell from 1,013 in 2011 to 448 in 2015.
[in-text-ad]

4. Columbus, IN
> 5-yr. violent crime rate change: -33.5%
> 2011 violent crime rate: 163.2 per 100,000
> 2015 violent crime rate: 108.6 per 100,000
> Murders in 2015: 1
The number of violent crimes reported per 100,000 residents in the Columbus metro area fell from 163 in 2011 to just 109 in 2015, nearly the best improvement of any U.S. city. The crime rate dropped in every category of violent crime, as well as every category all property crimes. The five-year 33.5% decrease in the area’s violent crime rate, which was roughly 10 times the national figure, was likely a welcome relief after the spike in the area’s violent crime between 2009 and 2013. Columbus is one of the safest metro areas nationwide.Just 20 robberies, 40 aggravated assaults, and one murder were reported in 2015. Adjusted for the city’s 81,000 person population, Columbus has the sixth lowest violent crime rate nationwide among major metropolitan areas.

3. Wenatchee, WA
> 5-yr. violent crime rate change: -36.2%
> 2011 violent crime rate: 157.2 per 100,000
> 2015 violent crime rate: 100.3 per 100,000
> Murders in 2015: 1
Between 2011 and 2015, the Wenatchee violent crime rate fell from 157 incidents per 100,000 residents to just 100 per 100,000 residents. The 36.2% improvement was nearly 10 times as large as the drop in the national crime rate, which fell from 387 incidents per 100,000 Americans to 373 per 100,000 over the same period. Research has shown that major impediments to curbing crime are poverty, unemployment, and income segregation. While the typical household in the Wenatchee metro is about as wealthy a typical American household, income is distributed more evenly across Wenatchee residents than nearly any other city. Additionally, just 2.8% of Wenatchee’s workforce is unemployed, a fraction of the 4.7% national unemployment rate.

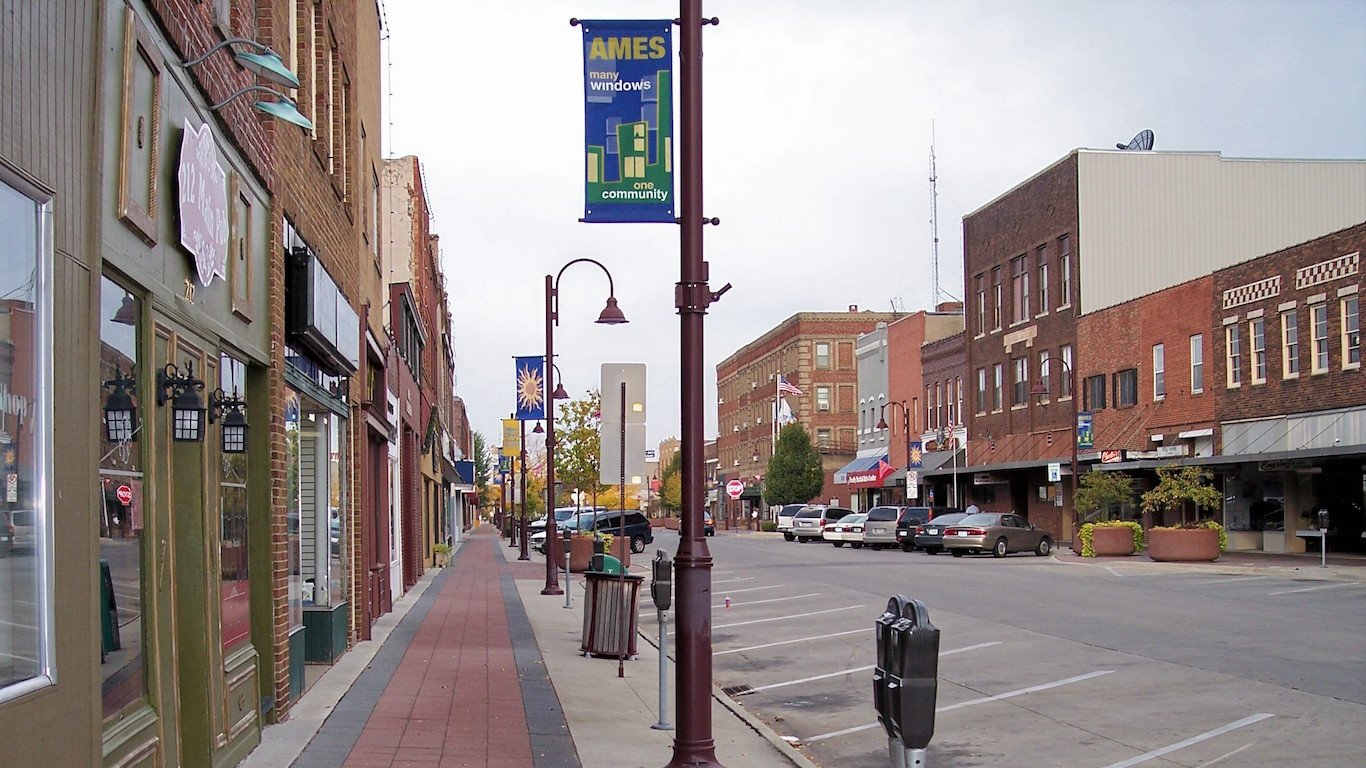
2. Ames, IA
> 5-yr. violent crime rate change: -42.9%
> 2011 violent crime rate: 277.7 per 100,000
> 2015 violent crime rate: 158.5 per 100,000
> Murders in 2015: 1
Roughly 100 fewer violent crimes were reported in the Ames metro area in 2015 than in 2011, even as the population grew at one of the fastest rates of any metropolitan area. Adjusted for population, violent crime fell from 278 incidents per 100,000 residents to just 159 per 100,000 residents. The 42.9% decline is the second largest improvement of any metro area. Today, Ames has one of the lowest crime rates in the country. According to the Ames Police Department, only one homicide has been reported in the last five years, and it was ruled an act of self-defense.
Improvements to the violent crime rate may be partially credited to preventative measures taken by Ames authorities. A few of these approaches include training landlords to curb criminal behavior, meeting with students at Iowa State University, and assigning resource officers to neighborhoods in the city.
[in-text-ad-2]

1. Bend-Redmond, OR
> 5-yr. violent crime rate change: -46.6%
> 2011 violent crime rate: 331.2 per 100,000
> 2015 violent crime rate: 176.8 per 100,000
> Murders in 2015: 3
The violent crime rate in the Bend-Redmond metro area fell between 2011 and 2015, from 331 incidents per 100,000 residents to 177 incidents per 100,000 residents. The 47% drop was the largest improvement in crime of any major metro area over the past five years. Today, crime levels in the metro area has returned to pre-recession levels. Bend experienced one of the sharpest spikes in crime during the recession, with the violent crime rate increasing 50% between 2007 and 2011 as the area’s economy weakened. In response to the rising crime, the City of Bend Police Department implemented a new records management system and hired a crime analyst to help map areas where criminal activity is most likely to occur. Five years later, Bend is even safer than it was before the rise in crime. Despite a rapidly expanding population, there were 33 fewer violent crimes reported in the Bend metro area in 2015 than in 2007.
Ever wanted an extra set of eyes on an investment you’re considering? Now you can speak with up to 3 financial experts in your area for FREE. By simply
clicking here you can begin to match with financial professionals who can help guide you through the financial decisions you’re making. And the best part? The first conversation with them is free.
Click here to match with up to 3 financial pros who would be excited to help you make financial decisions.
Thank you for reading! Have some feedback for us?
Contact the 24/7 Wall St. editorial team.