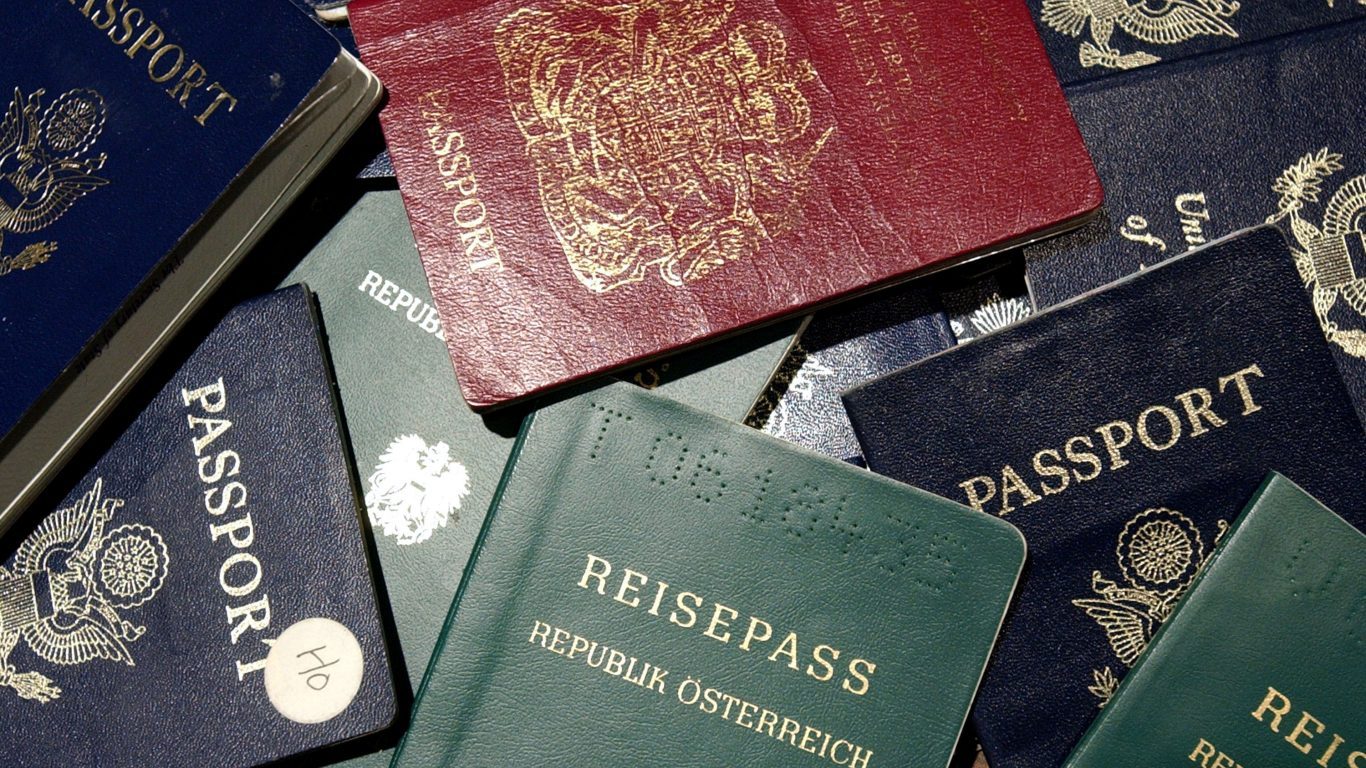
[cnxvideo id=”625494″ placement=”ros”]The promise that with hard work anyone in the United States can pursue their dreams and achieve success continues to attract large numbers of immigrants from around the world. Around one million are admitted as lawful permanent residents each year. Under the administration of President Donald Trump, however, the United States has become considerably less welcoming and safe for immigrants and refugees.
While the United States has long been one of the largest destinations of immigrants in the world, this is not the case for refugees. The United States accepted 146,158 refugees in 1975. Annual refugee admissions peaked in 1980 at 207,116 after a resettlement program during the American-led air strikes on Kosovo. Since then, annual refugee admissions have remained well below 1980 levels. Less than 100,000 refugees have been admitted to the United States each year since 1995.
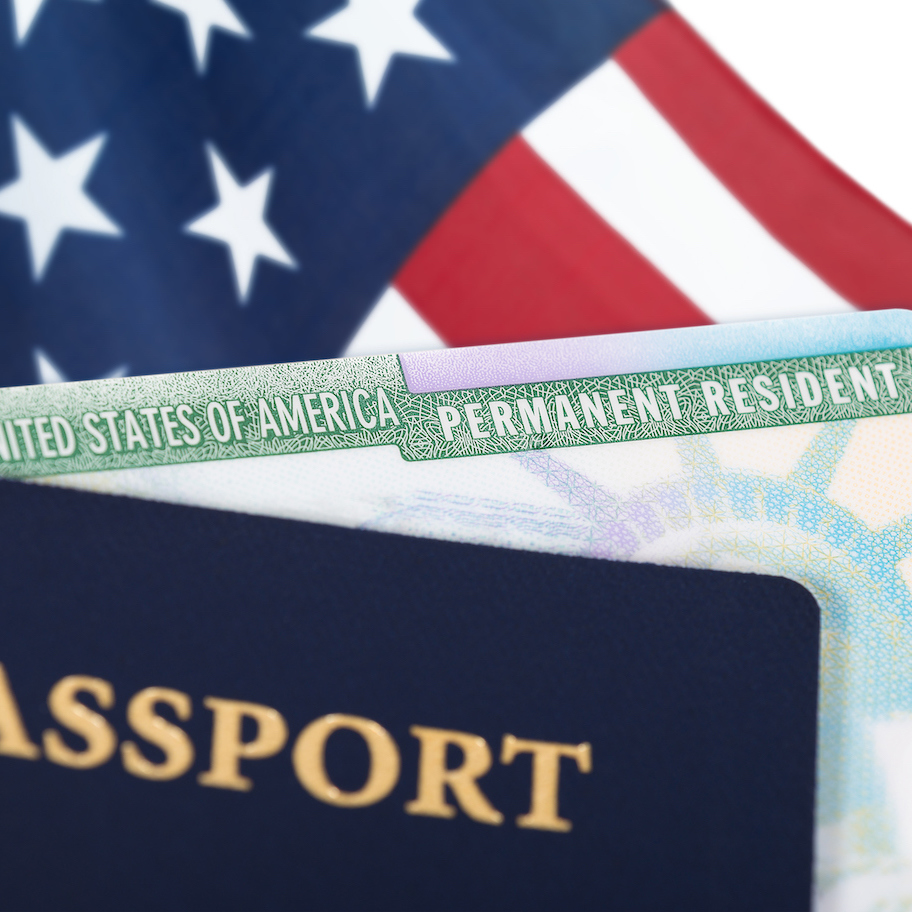
Because foreigners seeking employment and eventually citizenship in the United States almost always choose communities where they have families or friends, certain areas of the country continue to attract greater numbers of immigrants than others. The annual flow of green card-holding residents tends to be higher in states with larger foreign-born populations nearly without exception.
Using data published annually by the U.S. Department of Homeland Security, 24/7 Wall St. reviewed the number of green cards issued per capita in 2016 in each state.
Click here to see the most popular states for new legal immigrants.
Trump and his supporters have proposed numerous policy changes to U.S. immigration law. In the most publicized effort, Trump signed on Feb. 3, 2017 an executive order that banned U.S. visa-holders from seven “high risk” countries from entering the country. Trump’s justification for the order was security concerns, but the order seemed more targeted at lowering the influx of immigrants and refugees from these Muslim-majority nations. Between 1975 and the end of 2015, foreigners from these seven nations killed zero Americans on U.S. soil in terrorist attacks, according to a recent publication from the right-leaning think tank Cato Institute.
The travel ban order unleashed chaos as protests erupted and travelers were detained at airports across the country. The administration tweaked the order several times as courts have repeatedly blocked it on grounds that current immigration law prohibits discrimination based on nationality.
The Supreme Court allowed the ban to mostly take effect at the end of 2017. The court’s orders permitted the full enforcement of the new restrictions on travel from eight nations, exempting close relatives of people residing in the United States. Now, most citizens of Iran, Libya, Syria, Yemen, Somalia, Chad, and North Korea, as well as some people from Venezuela, will continue to be barred from entering the country.
And the saga continues to unfold. The Supreme Court will hear arguments in April and is expected to make a final ruling by July on the latest version of the travel ban. The rules governing immigration to the United States will likely remain unclear until then.
To identify the states issuing the most green cards, 24/7 Wall St. reviewed the number of green cards issued in 2016 to residents of each state from the report, Yearbook of Immigration Statistics: 2016, published in 2017 by the U.S. Department of Homeland Security, Office of Immigration Statistics. To compare states, we adjusted the number of green cards issued in 2016 to each state’s population. The population of foreign-born people in each state and the most common country of origin for each state’s foreign born population are from the 2016 American Community Survey (ACS) 5-Year estimates.

50. West Virginia
> Green cards issued in 2016: 50.7 per 100,000
> Immigrant pop.: 1.6% (the lowest)
> Most common country of origin: Mexico
> Mexican pop.: 2,472 (0.1% of state population)
[in-text-ad]

49. Montana
> Green cards issued in 2016: 54.3 per 100,000
> Immigrant pop.: 2.0% (2nd lowest)
> Most common country of origin: Canada
> Canadian pop.: 3,834 (0.4% of state population)
[recirclink id=444492]

48. Mississippi
> Green cards issued in 2016: 71.9 per 100,000
> Immigrant pop.: 2.3% (3rd lowest)
> Most common country of origin: Mexico
> Mexican pop.: 22,320 (0.7% of state population)

47. Wyoming
> Green cards issued in 2016: 78.9 per 100,000
> Immigrant pop.: 3.5% (8th lowest)
> Most common country of origin: Mexico
> Mexican pop.: 8,935 (1.5% of state population)
[in-text-ad-2]

46. Alabama
> Green cards issued in 2016: 97.4 per 100,000
> Immigrant pop.: 3.4% (6th lowest)
> Most common country of origin: Mexico
> Mexican pop.: 54,340 (1.1% of state population)

45. South Carolina
> Green cards issued in 2016: 102.9 per 100,000
> Immigrant pop.: 4.7% (14th lowest)
> Most common country of origin: Mexico
> Mexican pop.: 70,274 (1.4% of state population)
[in-text-ad]

44. Arkansas
> Green cards issued in 2016: 105.7 per 100,000
> Immigrant pop.: 4.7% (15th lowest)
> Most common country of origin: Mexico
> Mexican pop.: 62,315 (2.1% of state population)
[recirclink id=444468]

43. Missouri
> Green cards issued in 2016: 112.7 per 100,000
> Immigrant pop.: 3.9% (10th lowest)
> Most common country of origin: Mexico
> Mexican pop.: 41,696 (0.7% of state population)
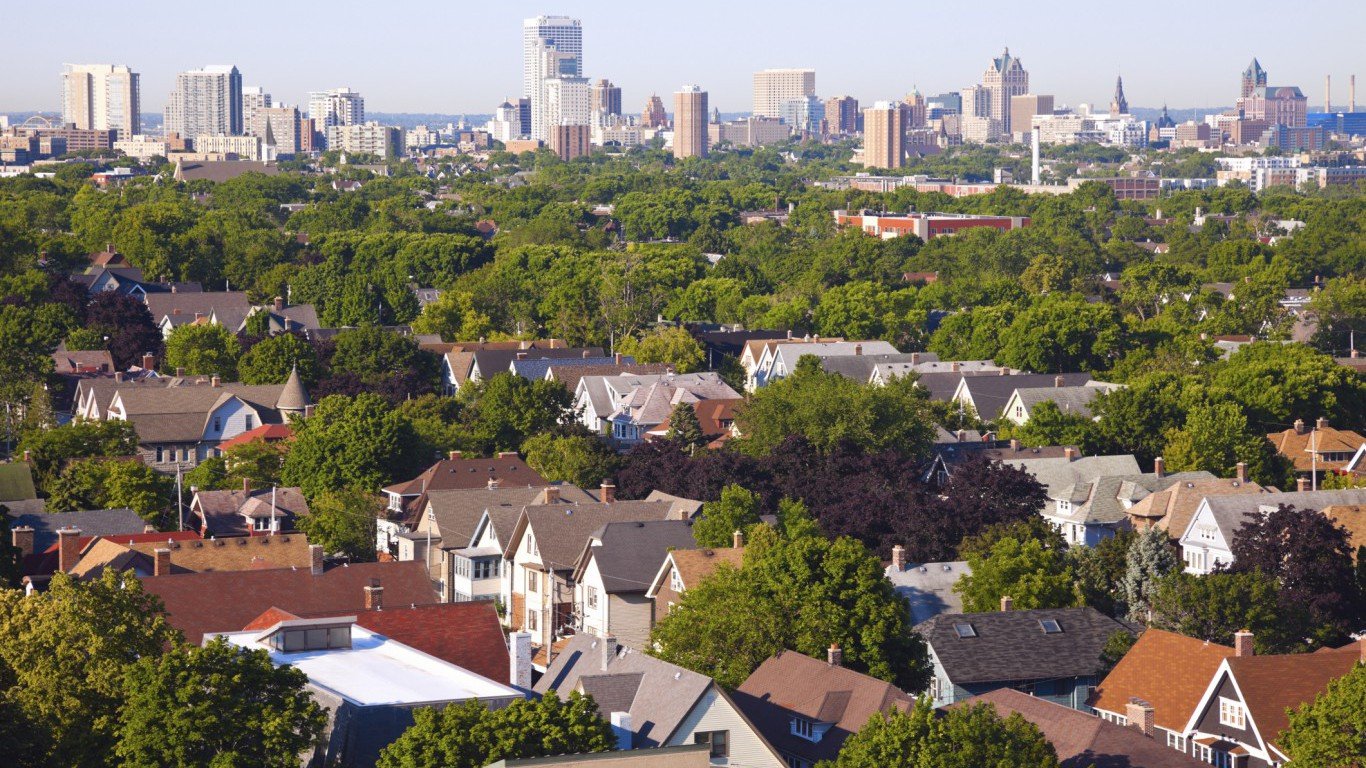
42. Wisconsin
> Green cards issued in 2016: 123.1 per 100,000
> Immigrant pop.: 4.8% (17th lowest)
> Most common country of origin: Mexico
> Mexican pop.: 91,179 (1.6% of state population)
[in-text-ad-2]

41. Louisiana
> Green cards issued in 2016: 123.5 per 100,000
> Immigrant pop.: 4.0% (11th lowest)
> Most common country of origin: Mexico
> Mexican pop.: 31,545 (0.7% of state population)

40. Maine
> Green cards issued in 2016: 131.3 per 100,000
> Immigrant pop.: 3.6% (9th lowest)
> Most common country of origin: Canada
> Canadian pop.: 10,525 (0.8% of state population)
[in-text-ad]

39. Vermont
> Green cards issued in 2016: 141.9 per 100,000
> Immigrant pop.: 4.4% (13th lowest)
> Most common country of origin: Canada
> Canadian pop.: 5,018 (0.8% of state population)
[recirclink id=444391]

38. South Dakota
> Green cards issued in 2016: 142.0 per 100,000
> Immigrant pop.: 3.1% (4th lowest)
> Most common country of origin: Mexico
> Mexican pop.: 2,838 (0.3% of state population)

37. Ohio
> Green cards issued in 2016: 148.5 per 100,000
> Immigrant pop.: 4.2% (12th lowest)
> Most common country of origin: India
> Indian pop.: 53,144 (0.5% of state population)
[in-text-ad-2]

36. Indiana
> Green cards issued in 2016: 149.9 per 100,000
> Immigrant pop.: 4.9% (19th lowest)
> Most common country of origin: Mexico
> Mexican pop.: 105,849 (1.6% of state population)
35. Tennessee
> Green cards issued in 2016: 150.8 per 100,000
> Immigrant pop.: 4.7% (16th lowest)
> Most common country of origin: Mexico
> Mexican pop.: 90,868 (1.4% of state population)
[in-text-ad]

34. Oklahoma
> Green cards issued in 2016: 151.9 per 100,000
> Immigrant pop.: 5.7% (20th lowest)
> Most common country of origin: Mexico
> Mexican pop.: 108,066 (2.8% of state population)
[recirclink id=444326]

33. Idaho
> Green cards issued in 2016: 152.2 per 100,000
> Immigrant pop.: 5.8% (22nd lowest)
> Most common country of origin: Mexico
> Mexican pop.: 50,737 (3.0% of state population)

32. Kentucky
> Green cards issued in 2016: 160.0 per 100,000
> Immigrant pop.: 3.5% (7th lowest)
> Most common country of origin: Mexico
> Mexican pop.: 32,407 (0.7% of state population)
[in-text-ad-2]

31. Iowa
> Green cards issued in 2016: 169.0 per 100,000
> Immigrant pop.: 4.8% (18th lowest)
> Most common country of origin: Mexico
> Mexican pop.: 41,611 (1.3% of state population)

30. New Hampshire
> Green cards issued in 2016: 174.7 per 100,000
> Immigrant pop.: 5.8% (21st lowest)
> Most common country of origin: Canada
> Canadian pop.: 9,246 (0.7% of state population)
[in-text-ad]

29. Kansas
> Green cards issued in 2016: 196.4 per 100,000
> Immigrant pop.: 6.9% (25th highest)
> Most common country of origin: Mexico
> Mexican pop.: 87,760 (3.0% of state population)
[recirclink id=444046]
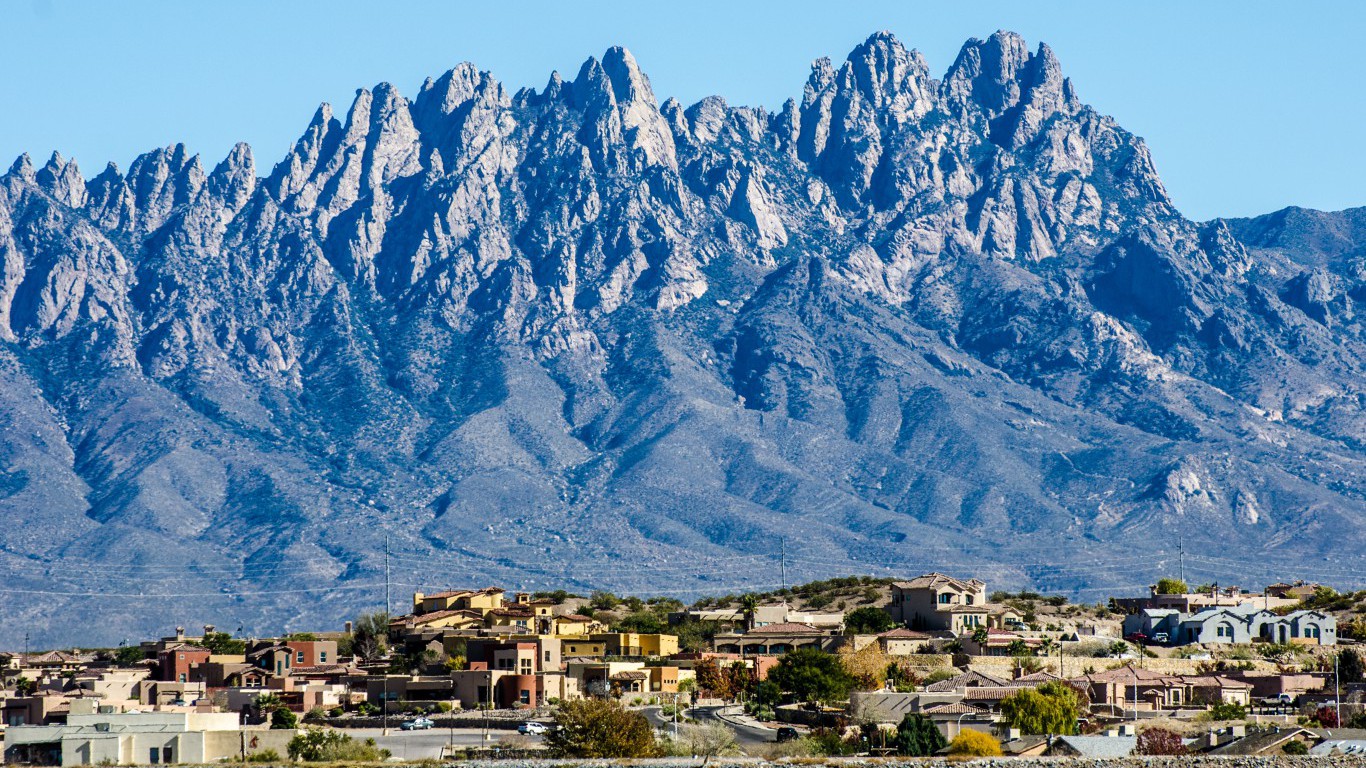
28. New Mexico
> Green cards issued in 2016: 197.2 per 100,000
> Immigrant pop.: 9.7% (16th highest)
> Most common country of origin: Mexico
> Mexican pop.: 142,416 (6.8% of state population)

27. North Carolina
> Green cards issued in 2016: 205.1 per 100,000
> Immigrant pop.: 7.6% (23rd highest)
> Most common country of origin: Mexico
> Mexican pop.: 243,996 (2.4% of state population)
[in-text-ad-2]

26. North Dakota
> Green cards issued in 2016: 210.4 per 100,000
> Immigrant pop.: 3.2% (5th lowest)
> Most common country of origin: Canada
> Canadian pop.: 2,554 (0.3% of state population)

25. Pennsylvania
> Green cards issued in 2016: 212.9 per 100,000
> Immigrant pop.: 6.4% (24th lowest)
> Most common country of origin: India
> Indian pop.: 81,115 (0.6% of state population)
[in-text-ad]
24. Michigan
> Green cards issued in 2016: 227.3 per 100,000
> Immigrant pop.: 6.4% (23rd lowest)
> Most common country of origin: Mexico
> Mexican pop.: 78,622 (0.8% of state population)
[recirclink id=443940]

23. Delaware
> Green cards issued in 2016: 231.5 per 100,000
> Immigrant pop.: 8.7% (20th highest)
> Most common country of origin: Mexico
> Mexican pop.: 15,377 (1.6% of state population)
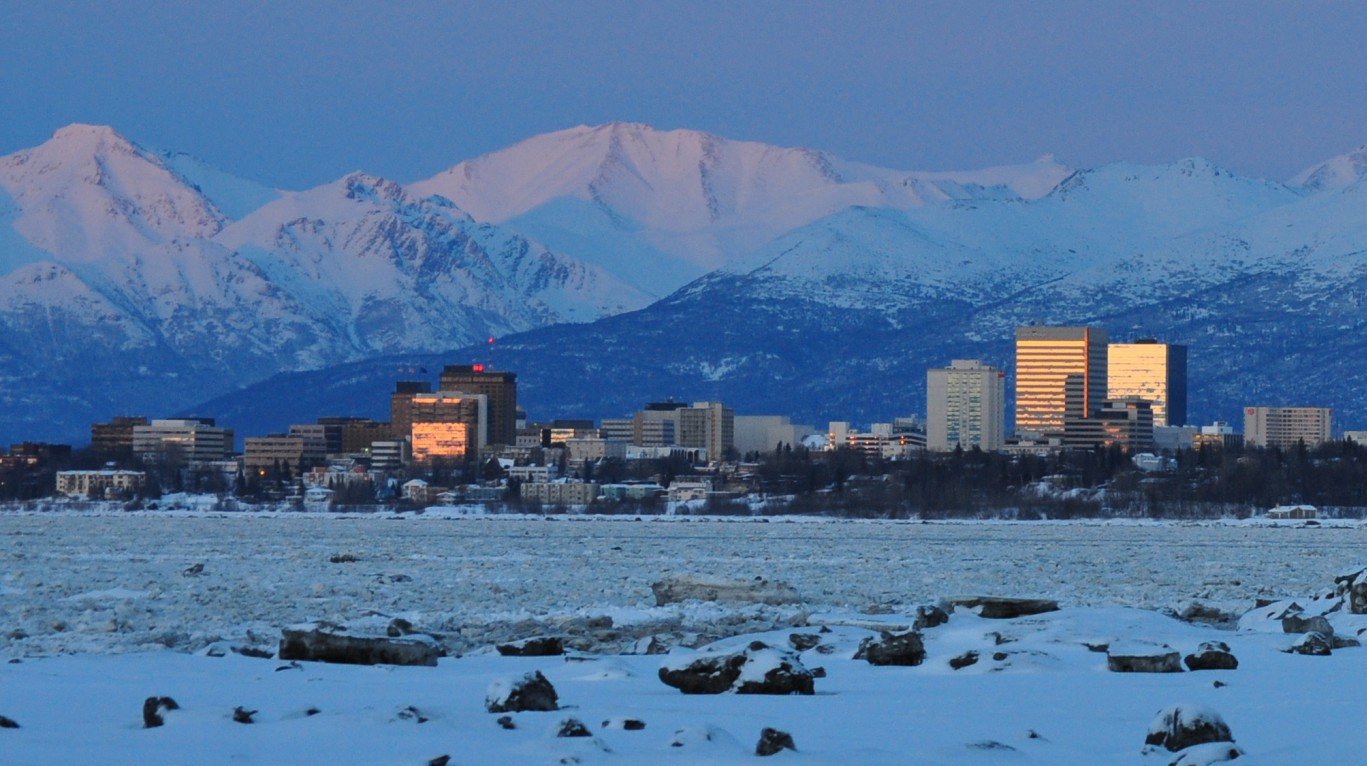
22. Alaska
> Green cards issued in 2016: 232.6 per 100,000
> Immigrant pop.: 7.4% (24th highest)
> Most common country of origin: Philippines
> Filipino pop.: 17,323 (2.3% of state population)
[in-text-ad-2]

21. Utah
> Green cards issued in 2016: 238.3 per 100,000
> Immigrant pop.: 8.0% (21st highest)
> Most common country of origin: Mexico
> Mexican pop.: 101,455 (3.3% of state population)

20. Oregon
> Green cards issued in 2016: 245.1 per 100,000
> Immigrant pop.: 9.5% (18th highest)
> Most common country of origin: Mexico
> Mexican pop.: 149,918 (3.7% of state population)
[in-text-ad]
19. Colorado
> Green cards issued in 2016: 256.7 per 100,000
> Immigrant pop.: 9.5% (19th highest)
> Most common country of origin: Mexico
> Mexican pop.: 230,002 (4.2% of state population)
[recirclink id=443564]

18. Minnesota
> Green cards issued in 2016: 282.7 per 100,000
> Immigrant pop.: 7.7% (22nd highest)
> Most common country of origin: Mexico
> Mexican pop.: 66,605 (1.2% of state population)

17. Georgia
> Green cards issued in 2016: 286.8 per 100,000
> Immigrant pop.: 9.6% (17th highest)
> Most common country of origin: Mexico
> Mexican pop.: 264,358 (2.6% of state population)
[in-text-ad-2]

16. Nebraska
> Green cards issued in 2016: 296.5 per 100,000
> Immigrant pop.: 6.6% (25th lowest)
> Most common country of origin: Mexico
> Mexican pop.: 48,359 (2.5% of state population)

15. Arizona
> Green cards issued in 2016: 298.6 per 100,000
> Immigrant pop.: 13.0% (14th highest)
> Most common country of origin: Mexico
> Mexican pop.: 510,855 (7.4% of state population)
[in-text-ad]

14. Illinois
> Green cards issued in 2016: 337.5 per 100,000
> Immigrant pop.: 14.0% (11th highest)
> Most common country of origin: Mexico
> Mexican pop.: 675,279 (5.3% of state population)
[recirclink id=443882]

13. Virginia
> Green cards issued in 2016: 347.6 per 100,000
> Immigrant pop.: 11.7% (15th highest)
> Most common country of origin: El Salvador
> El Salvadoran pop.: 95,616 (1.1% of state population)
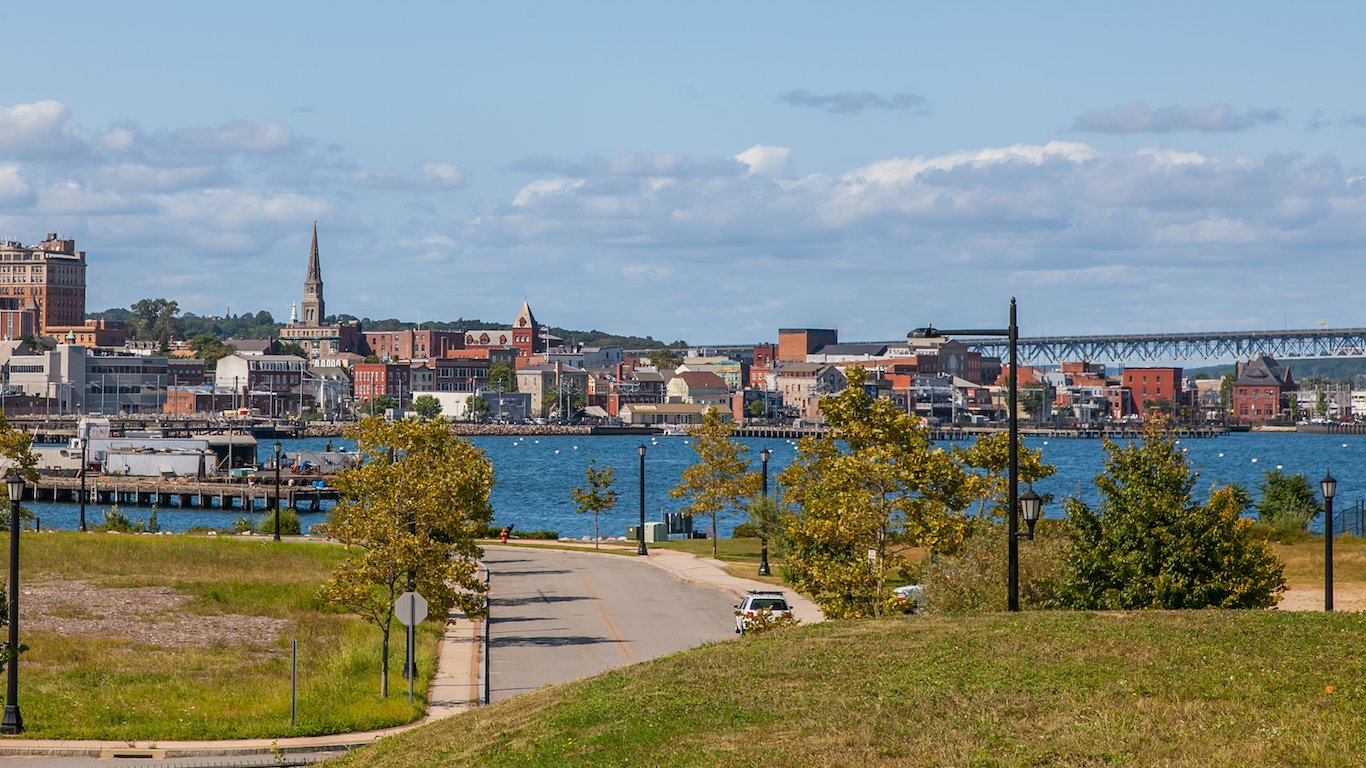
12. Connecticut
> Green cards issued in 2016: 354.2 per 100,000
> Immigrant pop.: 14.1% (10th highest)
> Most common country of origin: India
> Indian pop.: 38,324 (1.1% of state population)
[in-text-ad-2]

11. Washington
> Green cards issued in 2016: 374.6 per 100,000
> Immigrant pop.: 13.1% (13th highest)
> Most common country of origin: Mexico
> Mexican pop.: 234,345 (3.2% of state population)
10. Nevada
> Green cards issued in 2016: 393.0 per 100,000
> Immigrant pop.: 18.6% (5th highest)
> Most common country of origin: Mexico
> Mexican pop.: 225,751 (7.7% of state population)
[in-text-ad]

9. Rhode Island
> Green cards issued in 2016: 397.0 per 100,000
> Immigrant pop.: 13.5% (12th highest)
> Most common country of origin: Dominican Republic
> Dominican pop.: 24,894 (2.4% of state population)
[recirclink id=443620]
8. Texas
> Green cards issued in 2016: 397.1 per 100,000
> Immigrant pop.: 16.1% (7th highest)
> Most common country of origin: Mexico
> Mexican pop.: 2,529,134 (9.1% of state population)

7. Maryland
> Green cards issued in 2016: 433.4 per 100,000
> Immigrant pop.: 14.5% (9th highest)
> Most common country of origin: El Salvador
> El Salvadoran pop.: 106,434 (1.8% of state population)
[in-text-ad-2]

6. Hawaii
> Green cards issued in 2016: 440.0 per 100,000
> Immigrant pop.: 17.7% (6th highest)
> Most common country of origin: Philippines
> Filipino pop.: 116,532 (8.2% of state population)

5. Massachusetts
> Green cards issued in 2016: 524.2 per 100,000
> Immigrant pop.: 15.6% (8th highest)
> Most common country of origin: China, excluding Hong Kong and Taiwan
> Chinese pop.: 84,183 (1.2% of state population)
[in-text-ad]

4. California
> Green cards issued in 2016: 568.5 per 100,000
> Immigrant pop.: 26.6% (the highest)
> Most common country of origin: Mexico
> Mexican pop.: 4,227,816 (10.8% of state population)
[recirclink id=443575]

3. New Jersey
> Green cards issued in 2016: 628.2 per 100,000
> Immigrant pop.: 21.7% (3rd highest)
> Most common country of origin: India
> Indian pop.: 240,211 (2.7% of state population)

2. Florida
> Green cards issued in 2016: 661.4 per 100,000
> Immigrant pop.: 19.2% (4th highest)
> Most common country of origin: Cuba
> Cuban pop.: 915,378 (4.4% of state population)
[in-text-ad-2]
1. New York
> Green cards issued in 2016: 809.7 per 100,000
> Immigrant pop.: 22.5% (2nd highest)
> Most common country of origin: Dominican Republic
> Dominican pop.: 481,936 (2.4% of state population)
Contact [email protected] for any questions or corrections.