Large U.S. cities are among the most culturally diverse places to live in the world — but in a country with a long history as a beacon for immigrants, it’s not always the case that size matters. Diasporas from around the globe have established themselves in many parts of the country, not just major metropolitan areas.
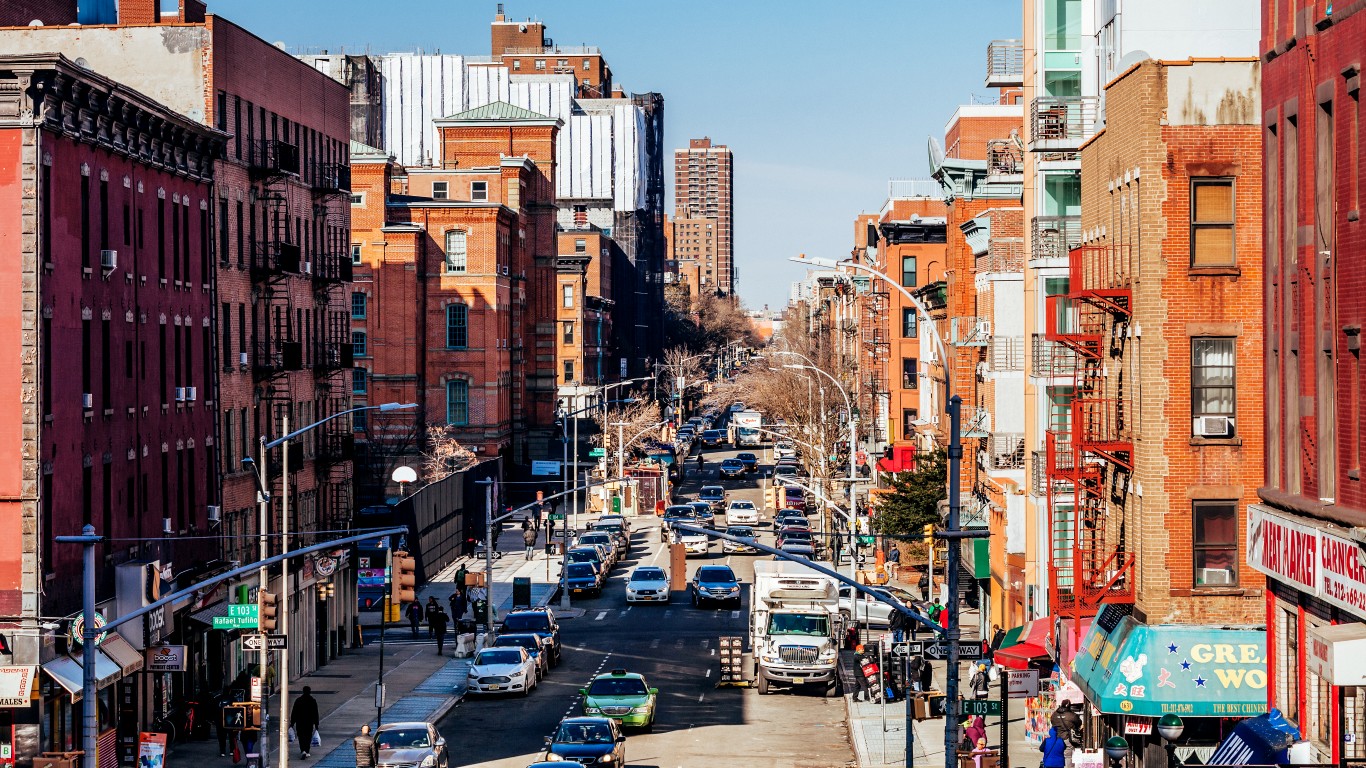
Take New York City as an example. The Migration Policy Institute nonpartisan think tank estimates that more than one in five Big Apple residents were foreign born in 2019, making it the largest most ethnically diverse city in the country.
But compared to the 25 small U.S. cities with the largest shares of foreign-born residents, New York would barely make the list. Eighteen of those cities have larger shares of foreign-born residents than New York, led by two Florida cities – The Hammocks and North Miami – where more than half of residents were born abroad, mostly from Haiti, Cuba, Colombia, Venezuela, and Nicaragua.
To determine the small cities attracting the most immigrants, 24/7 Wall St. reviewed data on foreign-born populations from the U.S. Census Bureau’s American Community Survey. Cities, towns, and Census-designated places were ranked based on the percentage-point change in foreign-born population as a percentage of the total population from 2016 to 2020. Supplemental data on country of origin and total population also came from the ACS. Only places with populations between 50,000 and 250,000 were considered. All data are five-year estimates.
Click here to see the small cities attracting the most immigrants
More than a third of residents in nine small cities – including Brockton, Massachusetts; Irvine, Texas; and Paterson, New Jersey – were born outside of the country.
The number of foreign-born immigrants in these 25 cities continues to grow. Between 2016 and 2020, the number of foreign-born residents in Gardena, California, increased by 4 percentage points, to more than 37%, thanks primarily to the influx of Mexicans, Koreans, Japanese, and Filipinos. In Sammamish, Washington, that rate of growth was 6.2 percentage points, led by immigration from India, China, Canada, and Taiwan.
Seven of these 25 cities are in Florida, followed by four each in Texas and Florida, illustrating that the largest states by population are also home to a majority of small cities attracting the newest immigrants.
A foreign-born resident is defined as anyone in the country who is a naturalized citizen, a lawful permanent immigrant, a refugee or asylee, a visa-holding temporary immigrant, or an immigrant residing in the country without authorization.
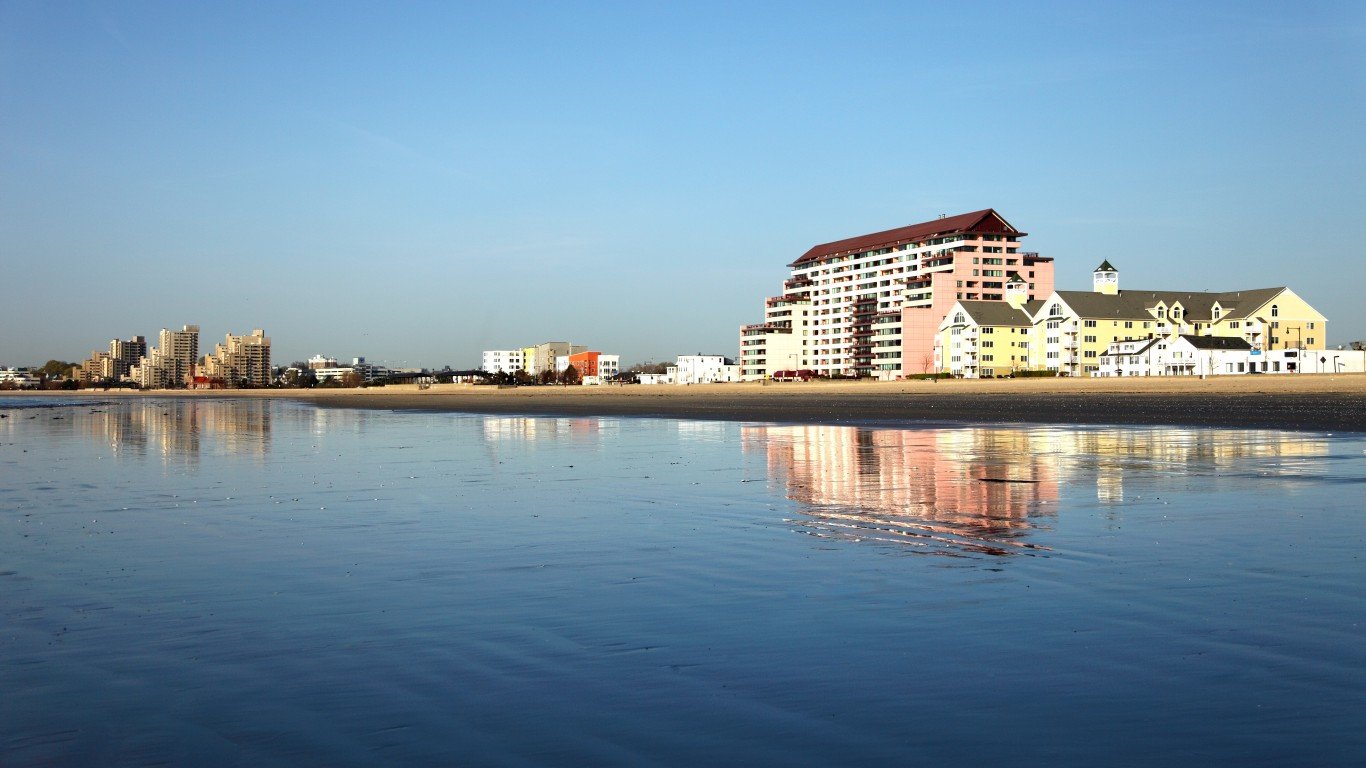
25. Revere, Massachusetts
> Foreign-born population, 2020: 40.1% (+3.7 ppts. since 2016)
> Largest immigrant group: Salvadorans (21.1% of foreign-born pop.)
> Other major immigrant groups: Colombians, Brazilians, Guatemalans
> Total population: 53,400
[in-text-ad]

24. Shoreline, Washington
> Foreign-born population, 2020: 22.6% (+3.8 ppts. since 2016)
> Largest immigrant group: Chinese (9.4% of foreign-born pop.)
> Other major immigrant groups: Koreans, Filipinos, Vietnamese
> Total population: 56,835
[recirclink id=1147757]
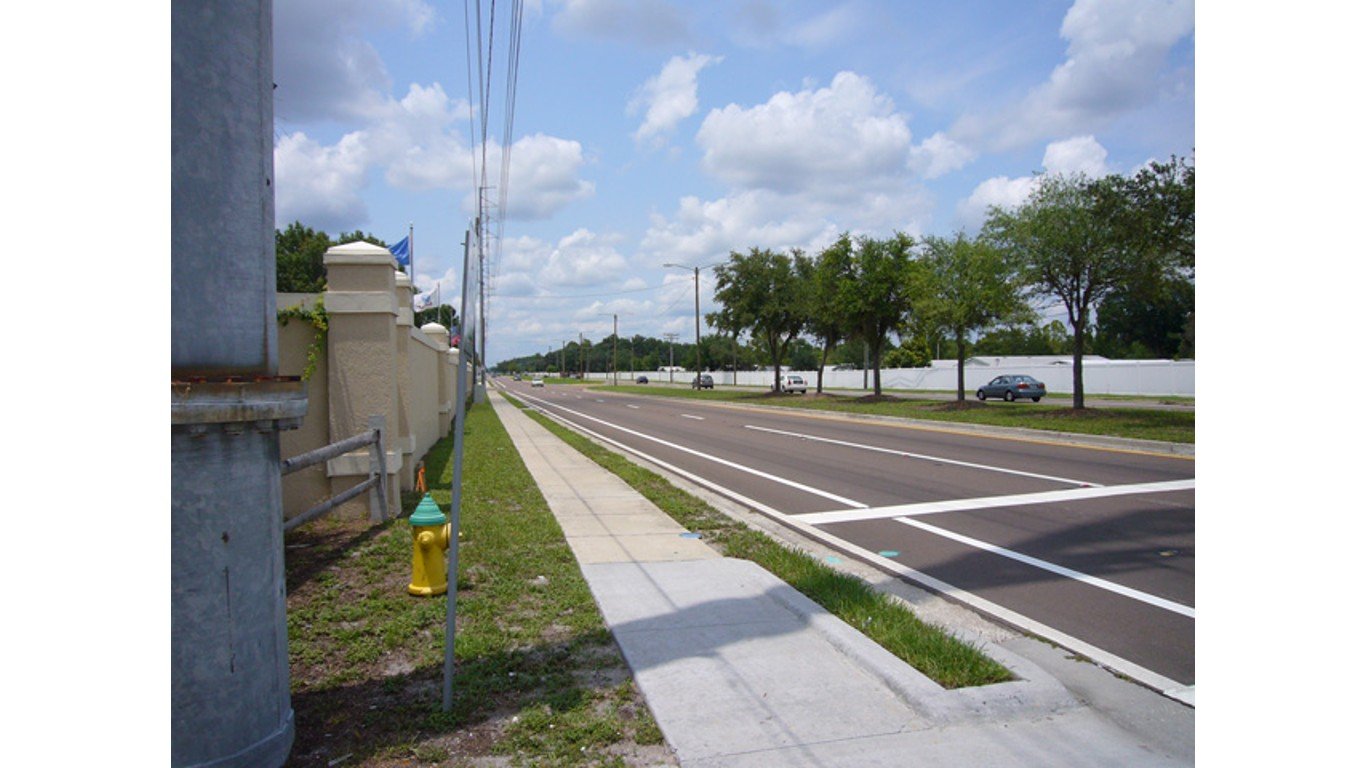
23. Town ‘n’ Country, Florida
> Foreign-born population, 2020: 32.1% (+3.8 ppts. since 2016)
> Largest immigrant group: Cubans (47.6% of foreign-born pop.)
> Other major immigrant groups: Colombians, Venezuelans, Dominicans
> Total population: 89,791

22. Irving, Texas
> Foreign-born population, 2020: 39.1% (+3.8 ppts. since 2016)
> Largest immigrant group: Mexicans (28.8% of foreign-born pop.)
> Other major immigrant groups: Indians, Salvadorans, Nepalis
> Total population: 240,475
[in-text-ad-2]
21. Palm Harbor, Florida
> Foreign-born population, 2020: 13.3% (+3.8 ppts. since 2016)
> Largest immigrant group: Egyptians (8.6% of foreign-born pop.)
> Other major immigrant groups: Canadians, Poles, Greeks
> Total population: 61,787

20. The Hammocks, Florida
> Foreign-born population, 2020: 55.3% (+4.0 ppts. since 2016)
> Largest immigrant group: Cubans (38.5% of foreign-born pop.)
> Other major immigrant groups: Colombians, Venezuelans, Nicaraguans
> Total population: 63,687
[in-text-ad]

19. Gardena, California
> Foreign-born population, 2020: 37.4% (+4.0 ppts. since 2016)
> Largest immigrant group: Mexicans (30.0% of foreign-born pop.)
> Other major immigrant groups: Koreans, Japanese, Filipinos
> Total population: 59,401
[recirclink id=1148037]

18. Collierville, Tennessee
> Foreign-born population, 2020: 11.5% (+4.1 ppts. since 2016)
> Largest immigrant group: Indians (31.5% of foreign-born pop.)
> Other major immigrant groups: Chinese, Mexicans, Pakistanis
> Total population: 50,596

17. Apple Valley, Minnesota
> Foreign-born population, 2020: 13.2% (+4.3 ppts. since 2016)
> Largest immigrant group: Ethiopians (12.4% of foreign-born pop.)
> Other major immigrant groups: Mexicans, Vietnamese, Filipinos
> Total population: 53,728
[in-text-ad-2]
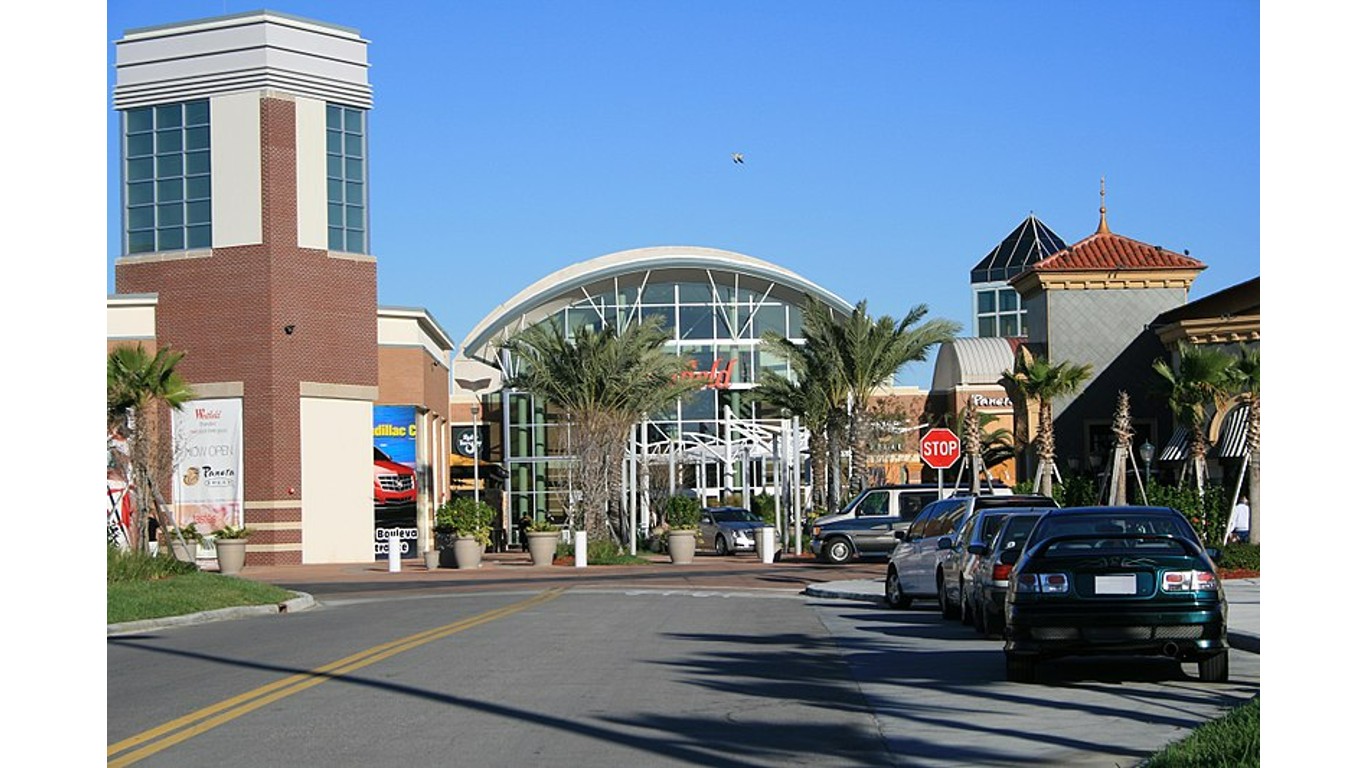
16. Brandon, Florida
> Foreign-born population, 2020: 17.1% (+4.5 ppts. since 2016)
> Largest immigrant group: Cubans (17.2% of foreign-born pop.)
> Other major immigrant groups: Indians, Dominicans, Venezuelans
> Total population: 115,909

15. Taylorsville, Utah
> Foreign-born population, 2020: 18.3% (+4.6 ppts. since 2016)
> Largest immigrant group: Mexicans (33.7% of foreign-born pop.)
> Other major immigrant groups: Vietnamese, Filipinos, Indians
> Total population: 59,926
[in-text-ad]

14. Leander, Texas
> Foreign-born population, 2020: 12.6% (+4.6 ppts. since 2016)
> Largest immigrant group: Mexicans (40.5% of foreign-born pop.)
> Other major immigrant groups: Indians, Filipinos, Poles
> Total population: 60,613
[recirclink id=1147748]
13. North Miami, Florida
> Foreign-born population, 2020: 55.5% (+4.8 ppts. since 2016)
> Largest immigrant group: Haitians (51.6% of foreign-born pop.)
> Other major immigrant groups: Cubans, Colombians, Nicaraguans
> Total population: 62,468
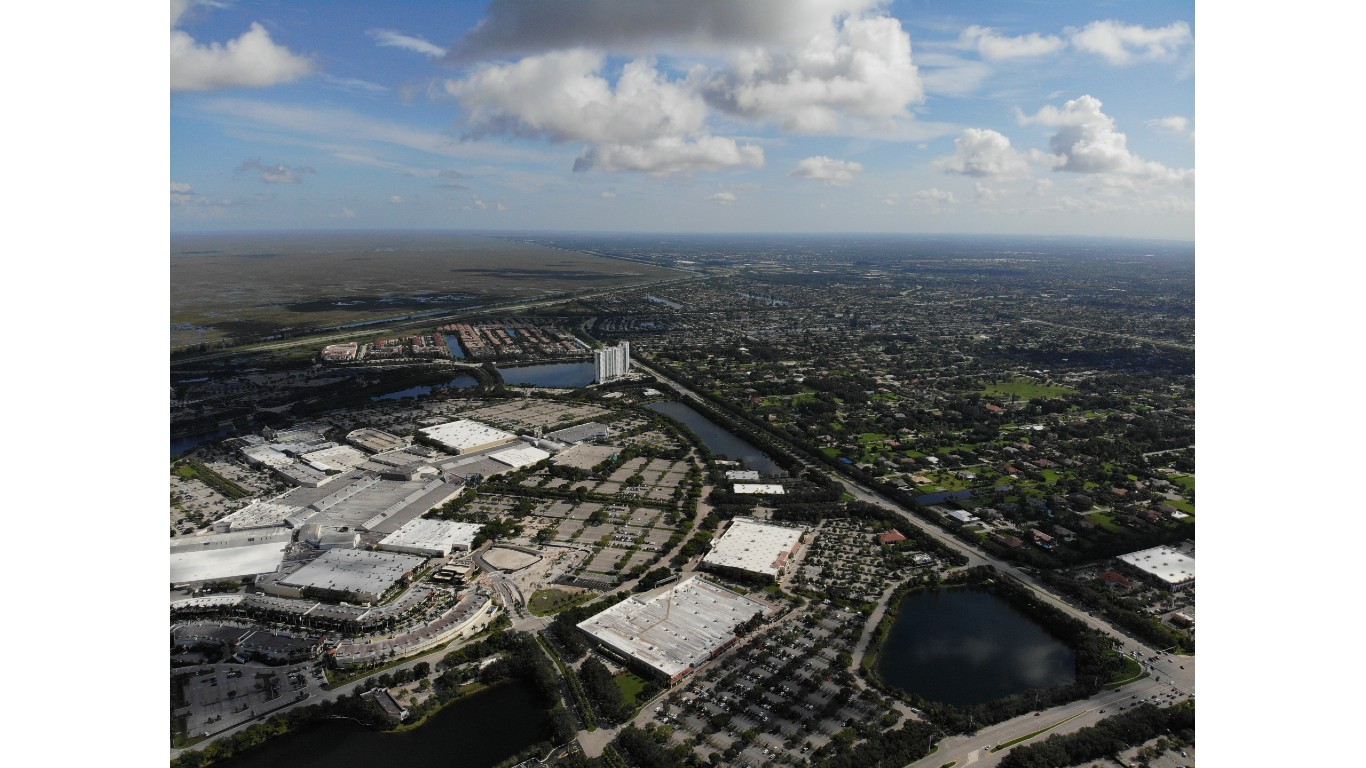
12. Sunrise, Florida
> Foreign-born population, 2020: 41.2% (+4.9 ppts. since 2016)
> Largest immigrant group: Jamaicans (17.8% of foreign-born pop.)
> Other major immigrant groups: Haitians, Colombians, Venezuelans
> Total population: 94,657
[in-text-ad-2]

11. Frisco, Texas
> Foreign-born population, 2020: 23.2% (+5.0 ppts. since 2016)
> Largest immigrant group: Indians (41.4% of foreign-born pop.)
> Other major immigrant groups: Mexicans, Pakistanis, Chinese
> Total population: 188,387

10. Brockton, Massachusetts
> Foreign-born population, 2020: 32.5% (+5.3 ppts. since 2016)
> Largest immigrant group: Cabo Verdeans (38.2% of foreign-born pop.)
> Other major immigrant groups: Haitians, Ecuadorians, Jamaicans
> Total population: 95,740
[in-text-ad]
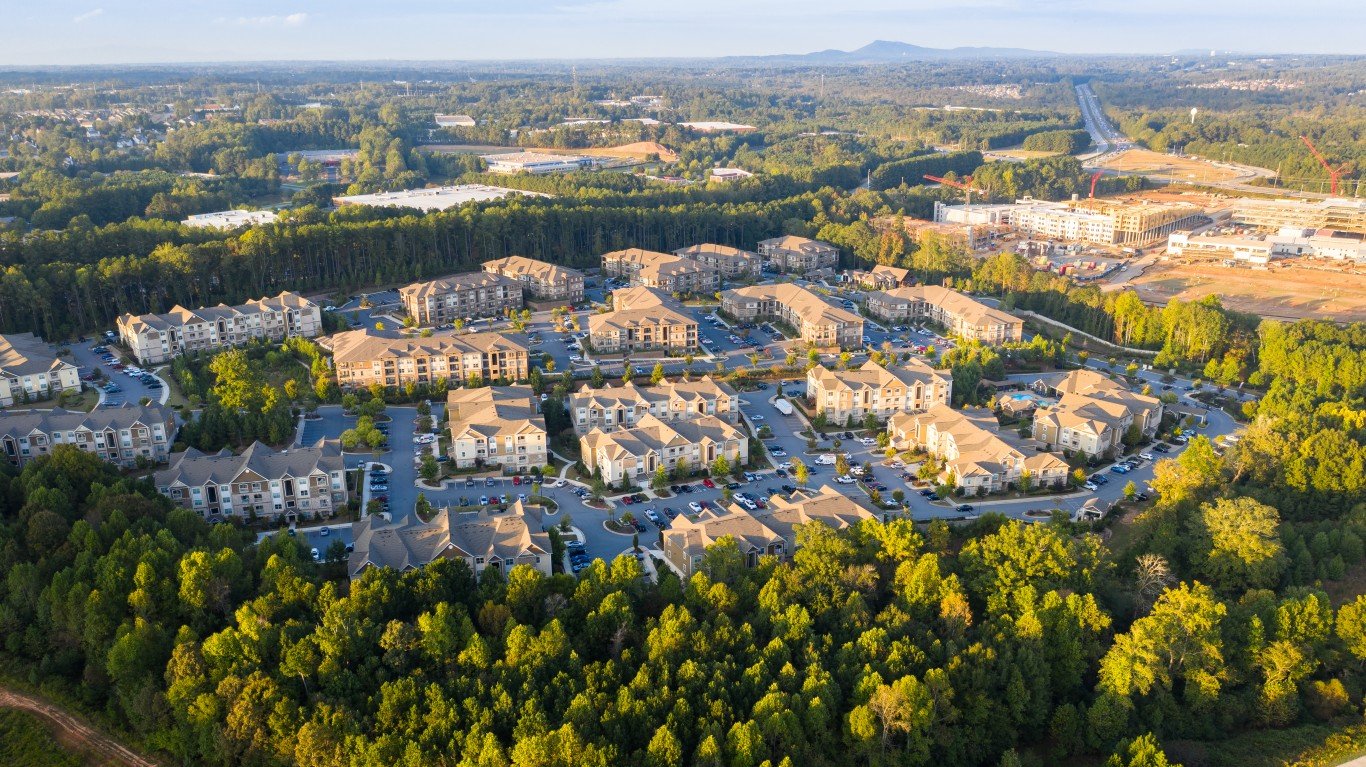
9. Alpharetta, Georgia
> Foreign-born population, 2020: 29.1% (+5.8 ppts. since 2016)
> Largest immigrant group: Indians (38.1% of foreign-born pop.)
> Other major immigrant groups: Chinese, Mexicans, Koreans
> Total population: 66,566
[recirclink id=1147429]

8. Methuen Town, Massachusetts
> Foreign-born population, 2020: 23.1% (+5.8 ppts. since 2016)
> Largest immigrant group: Dominicans (47.0% of foreign-born pop.)
> Other major immigrant groups: Lebanese, Indians, Nigerians
> Total population: 50,518

7. Pleasanton, California
> Foreign-born population, 2020: 32.8% (+5.9 ppts. since 2016)
> Largest immigrant group: Indians (34.5% of foreign-born pop.)
> Other major immigrant groups: Chinese, Koreans, Mexicans
> Total population: 79,975
[in-text-ad-2]

6. Wylie, Texas
> Foreign-born population, 2020: 18.2% (+6.0 ppts. since 2016)
> Largest immigrant group: Mexicans (22.1% of foreign-born pop.)
> Other major immigrant groups: Indians, Vietnamese, Salvadorans
> Total population: 51,251

5. Deerfield Beach, Florida
> Foreign-born population, 2020: 37.6% (+6.1 ppts. since 2016)
> Largest immigrant group: Brazilians (22.6% of foreign-born pop.)
> Other major immigrant groups: Haitians, Colombians, Canadians
> Total population: 80,822
[in-text-ad]

4. Sammamish, Washington
> Foreign-born population, 2020: 31.3% (+6.2 ppts. since 2016)
> Largest immigrant group: Indians (30.8% of foreign-born pop.)
> Other major immigrant groups: Chinese, Canadians, Taiwanese
> Total population: 65,265
[recirclink id=1147403]

3. Dublin, California
> Foreign-born population, 2020: 38.8% (+6.9 ppts. since 2016)
> Largest immigrant group: Indians (40.3% of foreign-born pop.)
> Other major immigrant groups: Chinese, Filipinos, Koreans
> Total population: 63,856

2. Arden-Arcade, California
> Foreign-born population, 2020: 22.5% (+6.9 ppts. since 2016)
> Largest immigrant group: Afghans (25.9% of foreign-born pop.)
> Other major immigrant groups: Mexicans, Filipinos, Ukrainians
> Total population: 93,719
[in-text-ad-2]
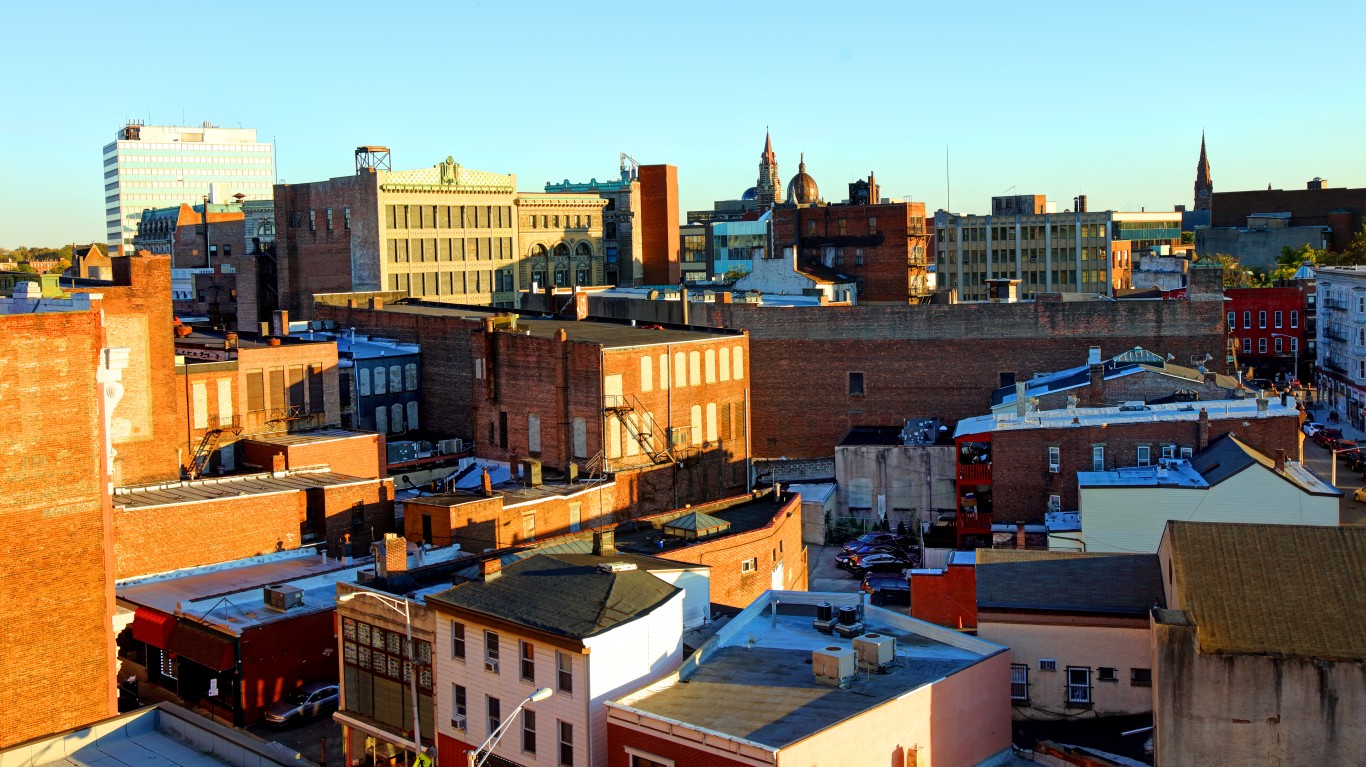
1. Paterson, New Jersey
> Foreign-born population, 2020: 42.5% (+7.4 ppts. since 2016)
> Largest immigrant group: Dominicans (44.4% of foreign-born pop.)
> Other major immigrant groups: Peruvians, Colombians, Jamaicans
> Total population: 145,484
Contact [email protected] for any questions or corrections.