
The importance of a full night’s sleep is difficult to overstate. Those who do not get enough sleep put not only their own health at risk, but also potentially jeopardize the safety of those they interact with on a daily basis — from the street to the workplace. Still, more than a third of American adults get dangerously little sleep.
According to the Centers for Disease Control and Prevention, American adults should get a minimum of seven hours of sleep per night. Failure to do so is linked to a number of chronic conditions including heart disease, obesity, and depression — and studies have shown that sleep-deprived drivers can be just as dangerous as drunk drivers.
Sleepiness is also a problem in the workplace, and implications range in severity from lost productivity to accidents that affect thousands. Sleep deprivation costs the U.S. economy an estimated $411 billion a year and has been cited as a factor in some of the world’s most devastating workplace accidents, including the Exxon Valdez oil tanker spill, the space shuttle Challenger explosion, and the near meltdown at the Three Mile Island nuclear plant.
While any number of reasons can account for insufficient sleep, many of those who do not sleep enough are under frequent stress. In some states, adults are far more likely to get enough sleep than in others.
24/7 Wall St. reviewed CDC data on the share of adults who sleep less than seven hours per night to identify the states getting the most and least sleep.
Click here to see the states getting the most and least sleep.
Click here to see our detailed findings and methodology.
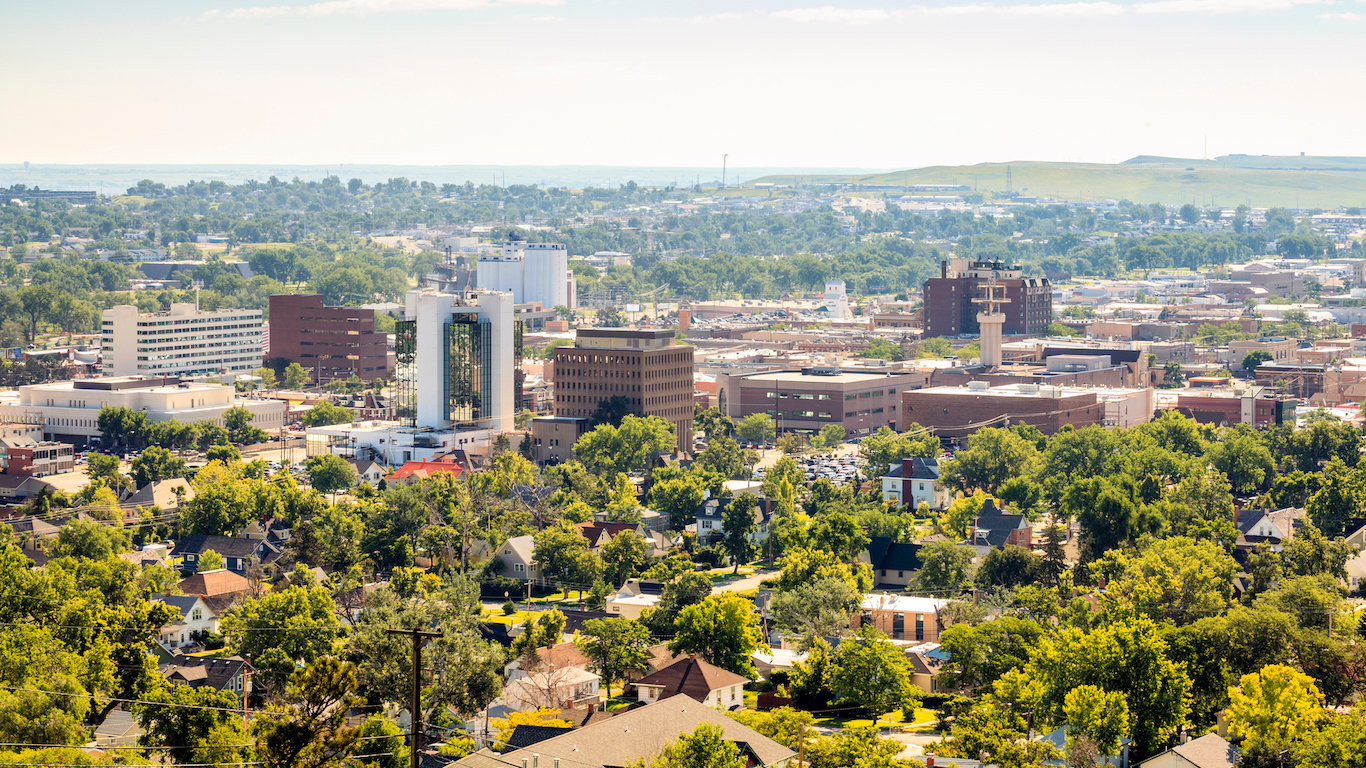
50. South Dakota
> Adults reporting insufficient sleep: 28.8%
> Adults with sedentary lifestyles: 21.5% (19th lowest)
> Avg. poor mental health days: 2.9 per month (the lowest)
> 2016 driving death rate: 13.4 per 100,000 (22nd highest)
> Poverty rate: 13.3% (24th highest)
[in-text-ad]

49. Colorado
> Adults reporting insufficient sleep: 29.6%
> Adults with sedentary lifestyles: 15.1% (the lowest)
> Avg. poor mental health days: 3.6 per month (19th lowest)
> 2016 driving death rate: 11.0 per 100,000 (20th lowest)
> Poverty rate: 11.0% (12th lowest)
[recirclink id=444492]

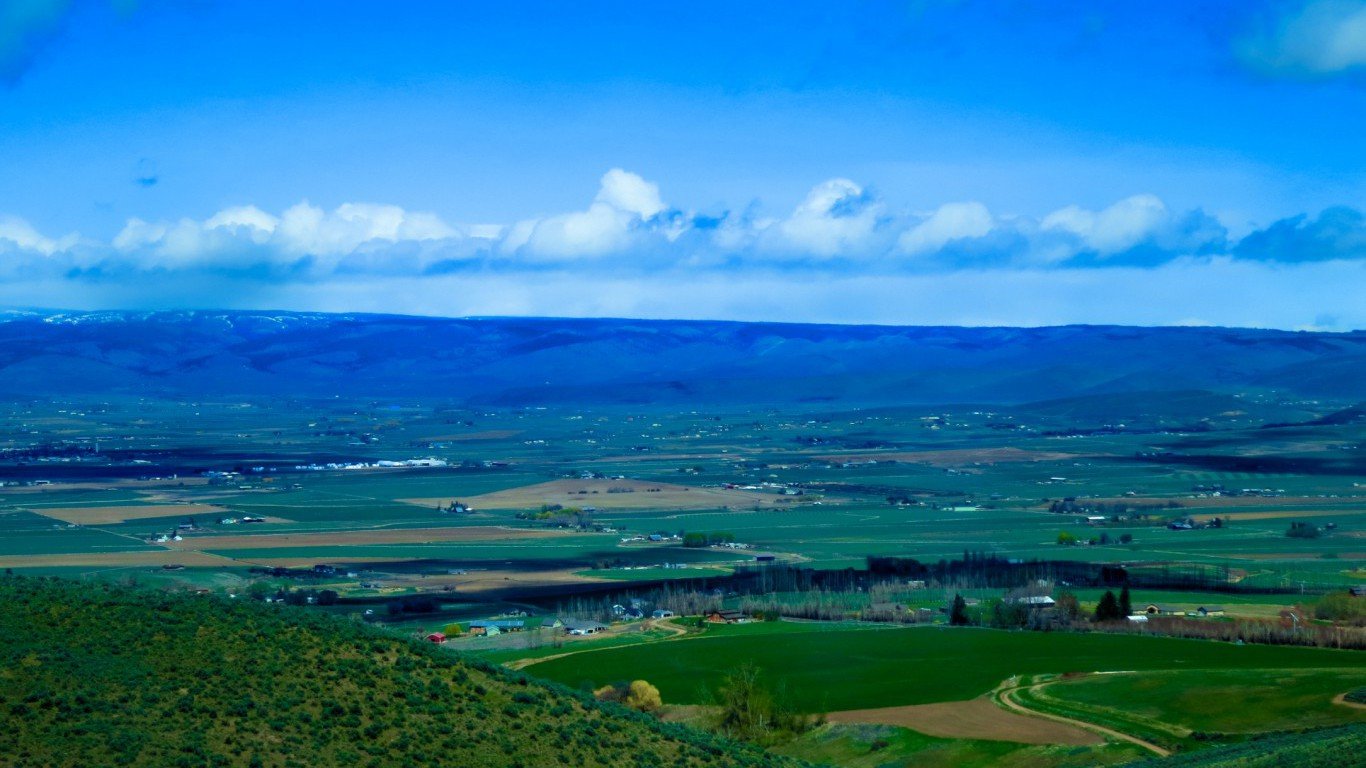
48. Montana
> Adults reporting insufficient sleep: 30.2%
> Adults with sedentary lifestyles: 20.8% (15th lowest)
> Avg. poor mental health days: 3.5 per month (14th lowest)
> 2016 driving death rate: 18.2 per 100,000 (7th highest)
> Poverty rate: 13.3% (24th highest)

47. Iowa
> Adults reporting insufficient sleep: 31.2%
> Adults with sedentary lifestyles: 24.7% (15th highest)
> Avg. poor mental health days: 3.3 per month (6th lowest)
> 2016 driving death rate: 12.9 per 100,000 (23rd highest)
> Poverty rate: 11.8% (18th lowest)
[in-text-ad-2]

46. North Dakota
> Adults reporting insufficient sleep: 31.5%
> Adults with sedentary lifestyles: 23.8% (22nd highest)
> Avg. poor mental health days: 3.1 per month (2nd lowest)
> 2016 driving death rate: 14.9 per 100,000 (16th highest)
> Poverty rate: 10.7% (10th lowest)

45. Idaho
> Adults reporting insufficient sleep: 31.9%
> Adults with sedentary lifestyles: 20.2% (12th lowest)
> Avg. poor mental health days: 3.7 per month (20th lowest)
> 2016 driving death rate: 15.0 per 100,000 (15th highest)
> Poverty rate: 14.4% (19th highest)
[in-text-ad]

44. Utah
> Adults reporting insufficient sleep: 32.1%
> Adults with sedentary lifestyles: 17.4% (4th lowest)
> Avg. poor mental health days: 3.6 per month (18th lowest)
> 2016 driving death rate: 9.2 per 100,000 (13th lowest)
> Poverty rate: 10.2% (7th lowest)
[recirclink id=444468]

43. Wyoming
> Adults reporting insufficient sleep: 32.4%
> Adults with sedentary lifestyles: 23.7% (24th highest)
> Avg. poor mental health days: 3.6 per month (17th lowest)
> 2016 driving death rate: 19.1 per 100,000 (5th highest)
> Poverty rate: 11.3% (14th lowest)

42. Minnesota
> Adults reporting insufficient sleep: 32.6%
> Adults with sedentary lifestyles: 19.8% (9th lowest)
> Avg. poor mental health days: 3.2 per month (4th lowest)
> 2016 driving death rate: 7.1 per 100,000 (5th lowest)
> Poverty rate: 9.9% (6th lowest)
[in-text-ad-2]

41. Nebraska
> Adults reporting insufficient sleep: 32.8%
> Adults with sedentary lifestyles: 22.7% (24th lowest)
> Avg. poor mental health days: 3.2 per month (5th lowest)
> 2016 driving death rate: 11.4 per 100,000 (23rd lowest)
> Poverty rate: 11.4% (15th lowest)

40. Vermont
> Adults reporting insufficient sleep: 33.0%
> Adults with sedentary lifestyles: 19.5% (8th lowest)
> Avg. poor mental health days: 4.0 per month (20th highest)
> 2016 driving death rate: 9.9 per 100,000 (16th lowest)
> Poverty rate: 11.9% (19th lowest)
[in-text-ad]

39. Kansas
> Adults reporting insufficient sleep: 33.4%
> Adults with sedentary lifestyles: 24.6% (16th highest)
> Avg. poor mental health days: 3.3 per month (7th lowest)
> 2016 driving death rate: 14.8 per 100,000 (17th highest)
> Poverty rate: 12.1% (20th lowest)
[recirclink id=444391]

38. Alaska
> Adults reporting insufficient sleep: 33.6%
> Adults with sedentary lifestyles: 19.3% (6th lowest)
> Avg. poor mental health days: 3.4 per month (8th lowest)
> 2016 driving death rate: 11.3 per 100,000 (22nd lowest)
> Poverty rate: 9.9% (6th lowest)

37. Oregon
> Adults reporting insufficient sleep: 34.0%
> Adults with sedentary lifestyles: 15.8% (2nd lowest)
> Avg. poor mental health days: 4.5 per month (8th highest)
> 2016 driving death rate: 12.1 per 100,000 (25th lowest)
> Poverty rate: 13.3% (24th highest)
[in-text-ad-2]
36. Washington
> Adults reporting insufficient sleep: 34.4%
> Adults with sedentary lifestyles: 17.1% (3rd lowest)
> Avg. poor mental health days: 3.8 per month (25th lowest)
> 2016 driving death rate: 7.4 per 100,000 (6th lowest)
> Poverty rate: 11.3% (14th lowest)

35. Illinois
> Adults reporting insufficient sleep: 34.6%
> Adults with sedentary lifestyles: 22.2% (22nd lowest)
> Avg. poor mental health days: 3.5 per month (13th lowest)
> 2016 driving death rate: 8.5 per 100,000 (10th lowest)
> Poverty rate: 13.0% (24th lowest)
[in-text-ad]

34. Texas
> Adults reporting insufficient sleep: 34.6%
> Adults with sedentary lifestyles: 24.3% (17th highest)
> Avg. poor mental health days: 3.4 per month (10th lowest)
> 2016 driving death rate: 13.6 per 100,000 (21st highest)
> Poverty rate: 15.6% (12th highest)
[recirclink id=444326]

33. Arizona
> Adults reporting insufficient sleep: 35.0%
> Adults with sedentary lifestyles: 20.2% (12th lowest)
> Avg. poor mental health days: 3.9 per month (24th highest)
> 2016 driving death rate: 13.9 per 100,000 (20th highest)
> Poverty rate: 16.4% (8th highest)
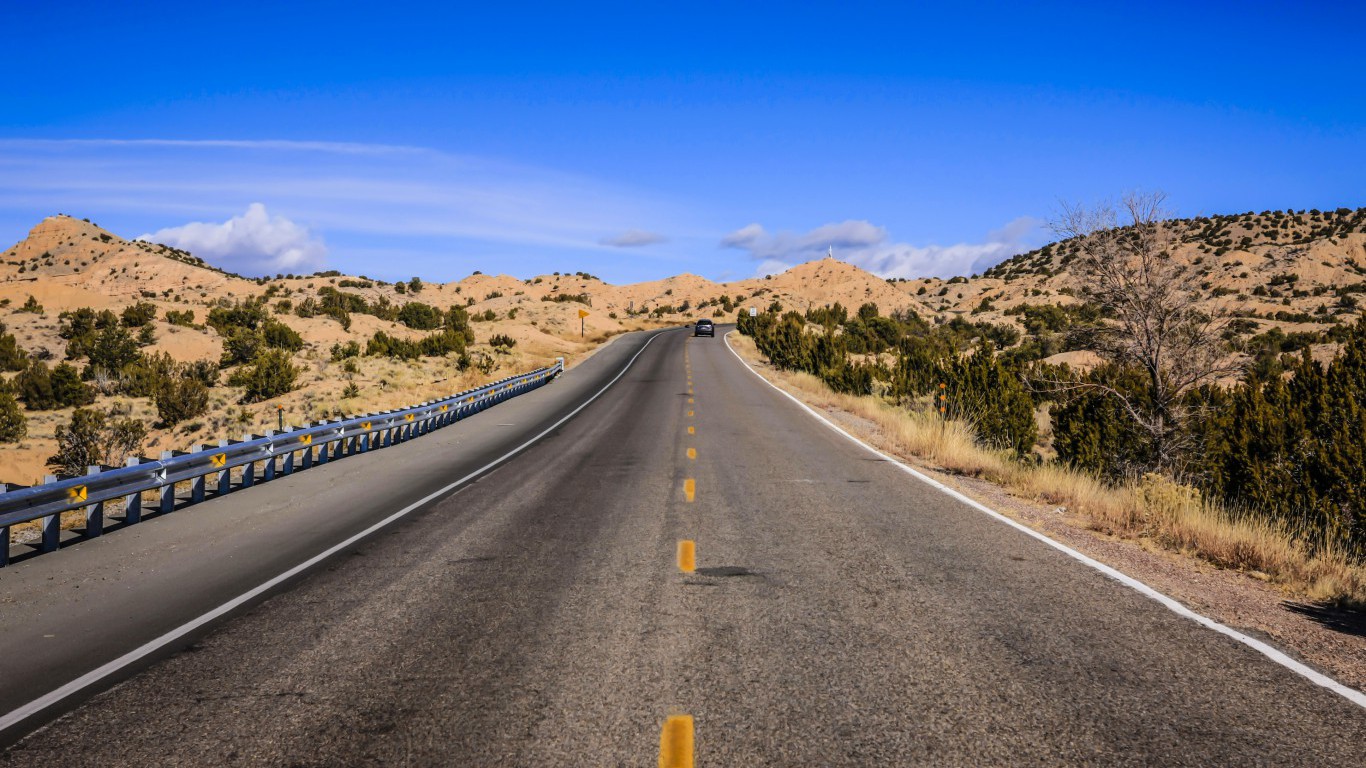
32. New Mexico
> Adults reporting insufficient sleep: 35.1%
> Adults with sedentary lifestyles: 19.4% (7th lowest)
> Avg. poor mental health days: 4.0 per month (22nd highest)
> 2016 driving death rate: 19.3 per 100,000 (4th highest)
> Poverty rate: 19.8% (3rd highest)
[in-text-ad-2]

31. Wisconsin
> Adults reporting insufficient sleep: 35.4%
> Adults with sedentary lifestyles: 21.1% (16th lowest)
> Avg. poor mental health days: 3.8 per month (25th highest)
> 2016 driving death rate: 10.5 per 100,000 (18th lowest)
> Poverty rate: 11.8% (18th lowest)

30. Maine
> Adults reporting insufficient sleep: 35.8%
> Adults with sedentary lifestyles: 21.4% (17th lowest)
> Avg. poor mental health days: 4.4 per month (10th highest)
> 2016 driving death rate: 12.1 per 100,000 (25th lowest)
> Poverty rate: 12.5% (21st lowest)
[in-text-ad]

29. Massachusetts
> Adults reporting insufficient sleep: 35.9%
> Adults with sedentary lifestyles: 21.5% (19th lowest)
> Avg. poor mental health days: 4.0 per month (21st highest)
> 2016 driving death rate: 5.7 per 100,000 (3rd lowest)
> Poverty rate: 10.4% (9th lowest)
[recirclink id=444046]

28. Connecticut
> Adults reporting insufficient sleep: 36.0%
> Adults with sedentary lifestyles: 20.4% (13th lowest)
> Avg. poor mental health days: 3.8 per month (24th lowest)
> 2016 driving death rate: 8.2 per 100,000 (7th lowest)
> Poverty rate: 9.8% (4th lowest)

27. North Carolina
> Adults reporting insufficient sleep: 36.0%
> Adults with sedentary lifestyles: 24.3% (17th highest)
> Avg. poor mental health days: 3.9 per month (23rd highest)
> 2016 driving death rate: 14.3 per 100,000 (19th highest)
> Poverty rate: 15.4% (13th highest)
[in-text-ad-2]

26. California
> Adults reporting insufficient sleep: 36.4%
> Adults with sedentary lifestyles: 17.9% (5th lowest)
> Avg. poor mental health days: 3.5 per month (15th lowest)
> 2016 driving death rate: 9.2 per 100,000 (13th lowest)
> Poverty rate: 14.3% (20th highest)

25. Missouri
> Adults reporting insufficient sleep: 36.5%
> Adults with sedentary lifestyles: 25.8% (11th highest)
> Avg. poor mental health days: 4.4 per month (13th highest)
> 2016 driving death rate: 15.5 per 100,000 (12th highest)
> Poverty rate: 14.0% (22nd highest)
[in-text-ad]

24. New Hampshire
> Adults reporting insufficient sleep: 36.5%
> Adults with sedentary lifestyles: 20.6% (14th lowest)
> Avg. poor mental health days: 4.2 per month (19th highest)
> 2016 driving death rate: 10.2 per 100,000 (17th lowest)
> Poverty rate: 7.3% (the lowest)
[recirclink id=443940]

23. Oklahoma
> Adults reporting insufficient sleep: 37.2%
> Adults with sedentary lifestyles: 29.9% (4th highest)
> Avg. poor mental health days: 4.5 per month (5th highest)
> 2016 driving death rate: 17.4 per 100,000 (9th highest)
> Poverty rate: 16.3% (9th highest)

22. Florida
> Adults reporting insufficient sleep: 37.4%
> Adults with sedentary lifestyles: 23.8% (22nd highest)
> Avg. poor mental health days: 3.8 per month (22nd lowest)
> 2016 driving death rate: 15.4 per 100,000 (13th highest)
> Poverty rate: 14.7% (16th highest)
[in-text-ad-2]

21. Arkansas
> Adults reporting insufficient sleep: 38.1%
> Adults with sedentary lifestyles: 32.3% (2nd highest)
> Avg. poor mental health days: 5.2 per month (2nd highest)
> 2016 driving death rate: 18.2 per 100,000 (7th highest)
> Poverty rate: 17.2% (6th highest)

20. Maryland
> Adults reporting insufficient sleep: 38.1%
> Adults with sedentary lifestyles: 22.2% (22nd lowest)
> Avg. poor mental health days: 3.5 per month (12th lowest)
> 2016 driving death rate: 8.4 per 100,000 (9th lowest)
> Poverty rate: 9.7% (3rd lowest)
[in-text-ad]

19. Mississippi
> Adults reporting insufficient sleep: 38.1%
> Adults with sedentary lifestyles: 34.0% (the highest)
> Avg. poor mental health days: 4.4 per month (9th highest)
> 2016 driving death rate: 23.1 per 100,000 (the highest)
> Poverty rate: 20.8% (the highest)
[recirclink id=443564]

18. Rhode Island
> Adults reporting insufficient sleep: 38.2%
> Adults with sedentary lifestyles: 24.1% (19th highest)
> Avg. poor mental health days: 4.3 per month (14th highest)
> 2016 driving death rate: 4.8 per 100,000 (the lowest)
> Poverty rate: 12.8% (22nd lowest)

17. Georgia
> Adults reporting insufficient sleep: 38.4%
> Adults with sedentary lifestyles: 24.1% (19th highest)
> Avg. poor mental health days: 3.8 per month (23rd lowest)
> 2016 driving death rate: 15.1 per 100,000 (14th highest)
> Poverty rate: 16.0% (10th highest)
[in-text-ad-2]

16. Virginia
> Adults reporting insufficient sleep: 38.7%
> Adults with sedentary lifestyles: 22.3% (23rd lowest)
> Avg. poor mental health days: 3.5 per month (11th lowest)
> 2016 driving death rate: 9.0 per 100,000 (11th lowest)
> Poverty rate: 11.0% (12th lowest)

15. Indiana
> Adults reporting insufficient sleep: 38.8%
> Adults with sedentary lifestyles: 26.8% (9th highest)
> Avg. poor mental health days: 4.3 per month (17th highest)
> 2016 driving death rate: 12.4 per 100,000 (25th highest)
> Poverty rate: 14.1% (21st highest)
[in-text-ad]

14. New York
> Adults reporting insufficient sleep: 39.0%
> Adults with sedentary lifestyles: 25.4% (13th highest)
> Avg. poor mental health days: 3.6 per month (16th lowest)
> 2016 driving death rate: 5.2 per 100,000 (2nd lowest)
> Poverty rate: 14.7% (16th highest)
[recirclink id=443882]

13. Tennessee
> Adults reporting insufficient sleep: 39.7%
> Adults with sedentary lifestyles: 30.1% (3rd highest)
> Avg. poor mental health days: 4.5 per month (7th highest)
> 2016 driving death rate: 15.7 per 100,000 (11th highest)
> Poverty rate: 15.8% (11th highest)

12. Delaware
> Adults reporting insufficient sleep: 39.8%
> Adults with sedentary lifestyles: 26.1% (10th highest)
> Avg. poor mental health days: 3.7 per month (21st lowest)
> 2016 driving death rate: 12.5 per 100,000 (24th highest)
> Poverty rate: 11.7% (16th lowest)
[in-text-ad-2]

11. Nevada
> Adults reporting insufficient sleep: 40.1%
> Adults with sedentary lifestyles: 22.2% (22nd lowest)
> Avg. poor mental health days: 4.5 per month (6th highest)
> 2016 driving death rate: 11.2 per 100,000 (21st lowest)
> Poverty rate: 13.8% (23rd highest)

10. Michigan
> Adults reporting insufficient sleep: 40.2%
> Adults with sedentary lifestyles: 23.2% (25th lowest)
> Avg. poor mental health days: 4.4 per month (11th highest)
> 2016 driving death rate: 10.7 per 100,000 (19th lowest)
> Poverty rate: 15.0% (15th highest)
[in-text-ad]

9. New Jersey
> Adults reporting insufficient sleep: 40.2%
> Adults with sedentary lifestyles: 23.3% (25th highest)
> Avg. poor mental health days: 3.4 per month (9th lowest)
> 2016 driving death rate: 6.7 per 100,000 (4th lowest)
> Poverty rate: 10.4% (9th lowest)
[recirclink id=443620]

8. South Carolina
> Adults reporting insufficient sleep: 40.2%
> Adults with sedentary lifestyles: 24.8% (14th highest)
> Avg. poor mental health days: 4.4 per month (12th highest)
> 2016 driving death rate: 20.5 per 100,000 (3rd highest)
> Poverty rate: 15.3% (14th highest)

7. Alabama
> Adults reporting insufficient sleep: 40.3%
> Adults with sedentary lifestyles: 29.0% (7th highest)
> Avg. poor mental health days: 4.6 per month (4th highest)
> 2016 driving death rate: 21.3 per 100,000 (2nd highest)
> Poverty rate: 17.1% (7th highest)
[in-text-ad-2]

6. Louisiana
> Adults reporting insufficient sleep: 40.5%
> Adults with sedentary lifestyles: 29.6% (5th highest)
> Avg. poor mental health days: 4.2 per month (18th highest)
> 2016 driving death rate: 16.2 per 100,000 (10th highest)
> Poverty rate: 20.2% (2nd highest)

5. Ohio
> Adults reporting insufficient sleep: 40.6%
> Adults with sedentary lifestyles: 25.7% (12th highest)
> Avg. poor mental health days: 4.3 per month (16th highest)
> 2016 driving death rate: 9.7 per 100,000 (15th lowest)
> Poverty rate: 14.6% (18th highest)
[in-text-ad]

4. Pennsylvania
> Adults reporting insufficient sleep: 40.6%
> Adults with sedentary lifestyles: 24.0% (21st highest)
> Avg. poor mental health days: 4.3 per month (15th highest)
> 2016 driving death rate: 9.3 per 100,000 (14th lowest)
> Poverty rate: 12.9% (23rd lowest)
[recirclink id=443575]

3. Kentucky
> Adults reporting insufficient sleep: 41.4%
> Adults with sedentary lifestyles: 28.1% (8th highest)
> Avg. poor mental health days: 4.8 per month (3rd highest)
> 2016 driving death rate: 18.8 per 100,000 (6th highest)
> Poverty rate: 18.5% (4th highest)

2. West Virginia
> Adults reporting insufficient sleep: 42.0%
> Adults with sedentary lifestyles: 29.2% (6th highest)
> Avg. poor mental health days: 5.2 per month (the highest)
> 2016 driving death rate: 14.7 per 100,000 (18th highest)
> Poverty rate: 17.9% (5th highest)
[in-text-ad-2]

1. Hawaii
> Adults reporting insufficient sleep: 44.7%
> Adults with sedentary lifestyles: 20.1% (10th lowest)
> Avg. poor mental health days: 3.2 per month (3rd lowest)
> 2016 driving death rate: 8.4 per 100,000 (9th lowest)
> Poverty rate: 9.3% (2nd lowest)
Detailed Findings
Insufficient sleep is tied to a number of factors related to lifestyle and circumstance. A 2013 poll conducted by advocacy group the National Sleep Foundation found that people who exercise vigorously are more likely to get enough quality sleep. Meanwhile, those who lead largely sedentary lifestyles are at an increased risk of not getting enough sleep.
In keeping with the NSF’s findings, states getting the most sleep are typically home to relatively active populations, in contrast to the states where large shares of the population are not sleeping enough. Nationwide, 23.0% of adults get no exercise beyond getting up and going to work. With the exception of Hawaii, each of the 10 states getting the least sleep are home to a larger than typical share of adults who lead sedentary lifestyles.
In comparison, sedentary lifestyles are more common than they are nationwide in only three of the 10 states where the smallest shares of adults are sleep deprived.
In addition to a number of disorders, such as restless leg syndrome and sleep apnea, which can prevent restful sleep, financial stress and frequent mental distress can get in the way of a full night’s sleep.
Indeed, psychological stress is more common in the states in which the smallest shares of adults are getting enough sleep, as is the prevalence of serious financial hardship. The average American adult experiences 3.8 mentally unhealthy days a month. In eight of the 10 states getting the least sleep, the average number of mentally unhealthy days is higher than the national average. Additionally, seven of those same states have a higher poverty rate than the 14.0% U.S. poverty rate.
Meanwhile, none of the 10 states getting the most sleep have a higher than average number of mentally unhealthy days per month and only one has a higher poverty rate than the country as a whole.
According to the CDC, insufficient sleep is tied to both obesity and diabetes — and each of these conditions tends to be far more common in the states getting the least sleep.
Methodology
To determine the states where residents report getting the most and least sleep, 24/7 Wall St. reviewed the share of adults 18 and older in every state who do not get sufficient sleep (< 8 hours a night ages 18-21, < 7 hours a night ages 22+). These figures were obtained from the Centers for Disease Control and Prevention’s 2016 Behavioral Risk Factor Surveillance System. Diabetes and obesity rates are also from the CDC. Average number of mentally unhealthy days per month and the share of adults with sedentary lifestyles are from County Health Rankings & Roadmaps, a Robert Wood Johnson Foundation and University of Wisconsin Population Health Institute joint program. Poverty rates are for 2016 and are from the U.S. Census Bureau’s American Community Survey. The number of fatal roadway deaths per 100,000 residents comes from the Insurance Institute for Highway Safety.
Contact [email protected] for any questions or corrections.